| Entrez ID | Symbol | Replicates | Species | Organ | Tissue | Adj P-value | Log2FC | Malignancy |
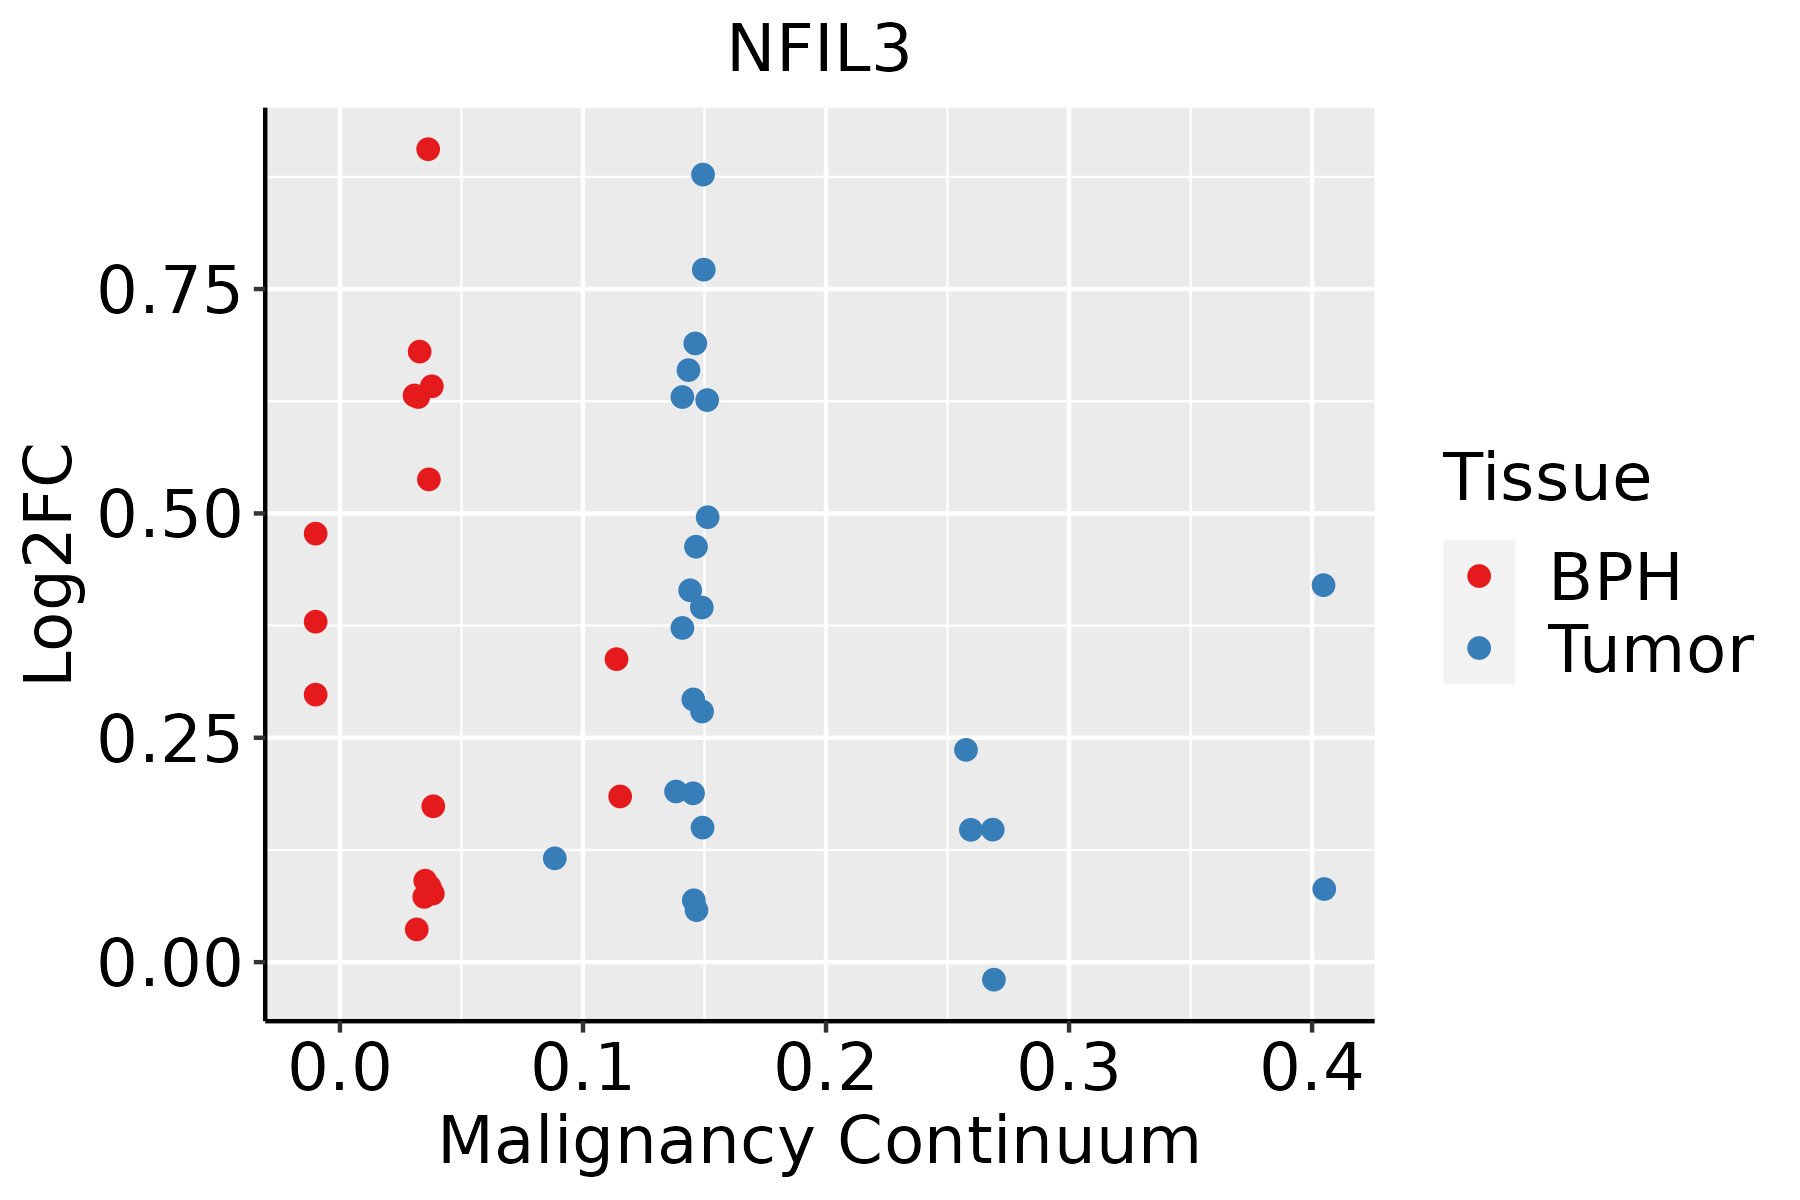
| 4783 | NFIL3 | GSM5353221_PA_PB2A_Pool_1_3_S25_L001 | Human | Prostate | Tumor | 1.97e-07 | 4.96e-01 | 0.1633 |
| 4783 | NFIL3 | GSM5353224_PA_PR5186_Pool_1_2_3_S27_L001 | Human | Prostate | Tumor | 3.02e-17 | 7.72e-01 | 0.1621 |
| 4783 | NFIL3 | GSM5353225_PA_PR5196-1_Pool_1_2_3_S53_L002 | Human | Prostate | Tumor | 5.55e-05 | 6.89e-01 | 0.1619 |
| 4783 | NFIL3 | GSM5353227_PA_PR5199-193K_Pool_1_2_3_S55_L002 | Human | Prostate | Tumor | 2.47e-04 | 4.63e-01 | 0.1602 |
| 4783 | NFIL3 | GSM5353236_PA_PR5251_T1_S7_L001 | Human | Prostate | Tumor | 1.98e-11 | 8.78e-01 | 0.1608 |
| 4783 | NFIL3 | GSM5353237_PA_PR5251_T2_S8_L001 | Human | Prostate | Tumor | 1.68e-04 | 6.26e-01 | 0.1622 |
| 4783 | NFIL3 | GSM5353240_PA_PR5254_T1_S15_L001 | Human | Prostate | Tumor | 1.16e-05 | 4.14e-01 | 0.1575 |
| 4783 | NFIL3 | GSM5353243_PA_PR5261_T1_S23_L002 | Human | Prostate | Tumor | 2.51e-11 | 6.30e-01 | 0.1545 |
| 4783 | NFIL3 | GSM5353244_PA_PR5261_T2_S24_L002 | Human | Prostate | Tumor | 2.02e-10 | 6.60e-01 | 0.1569 |
| GO ID | Tissue | Disease Stage | Description | Gene Ratio | Bg Ratio | pvalue | p.adjust | Count |
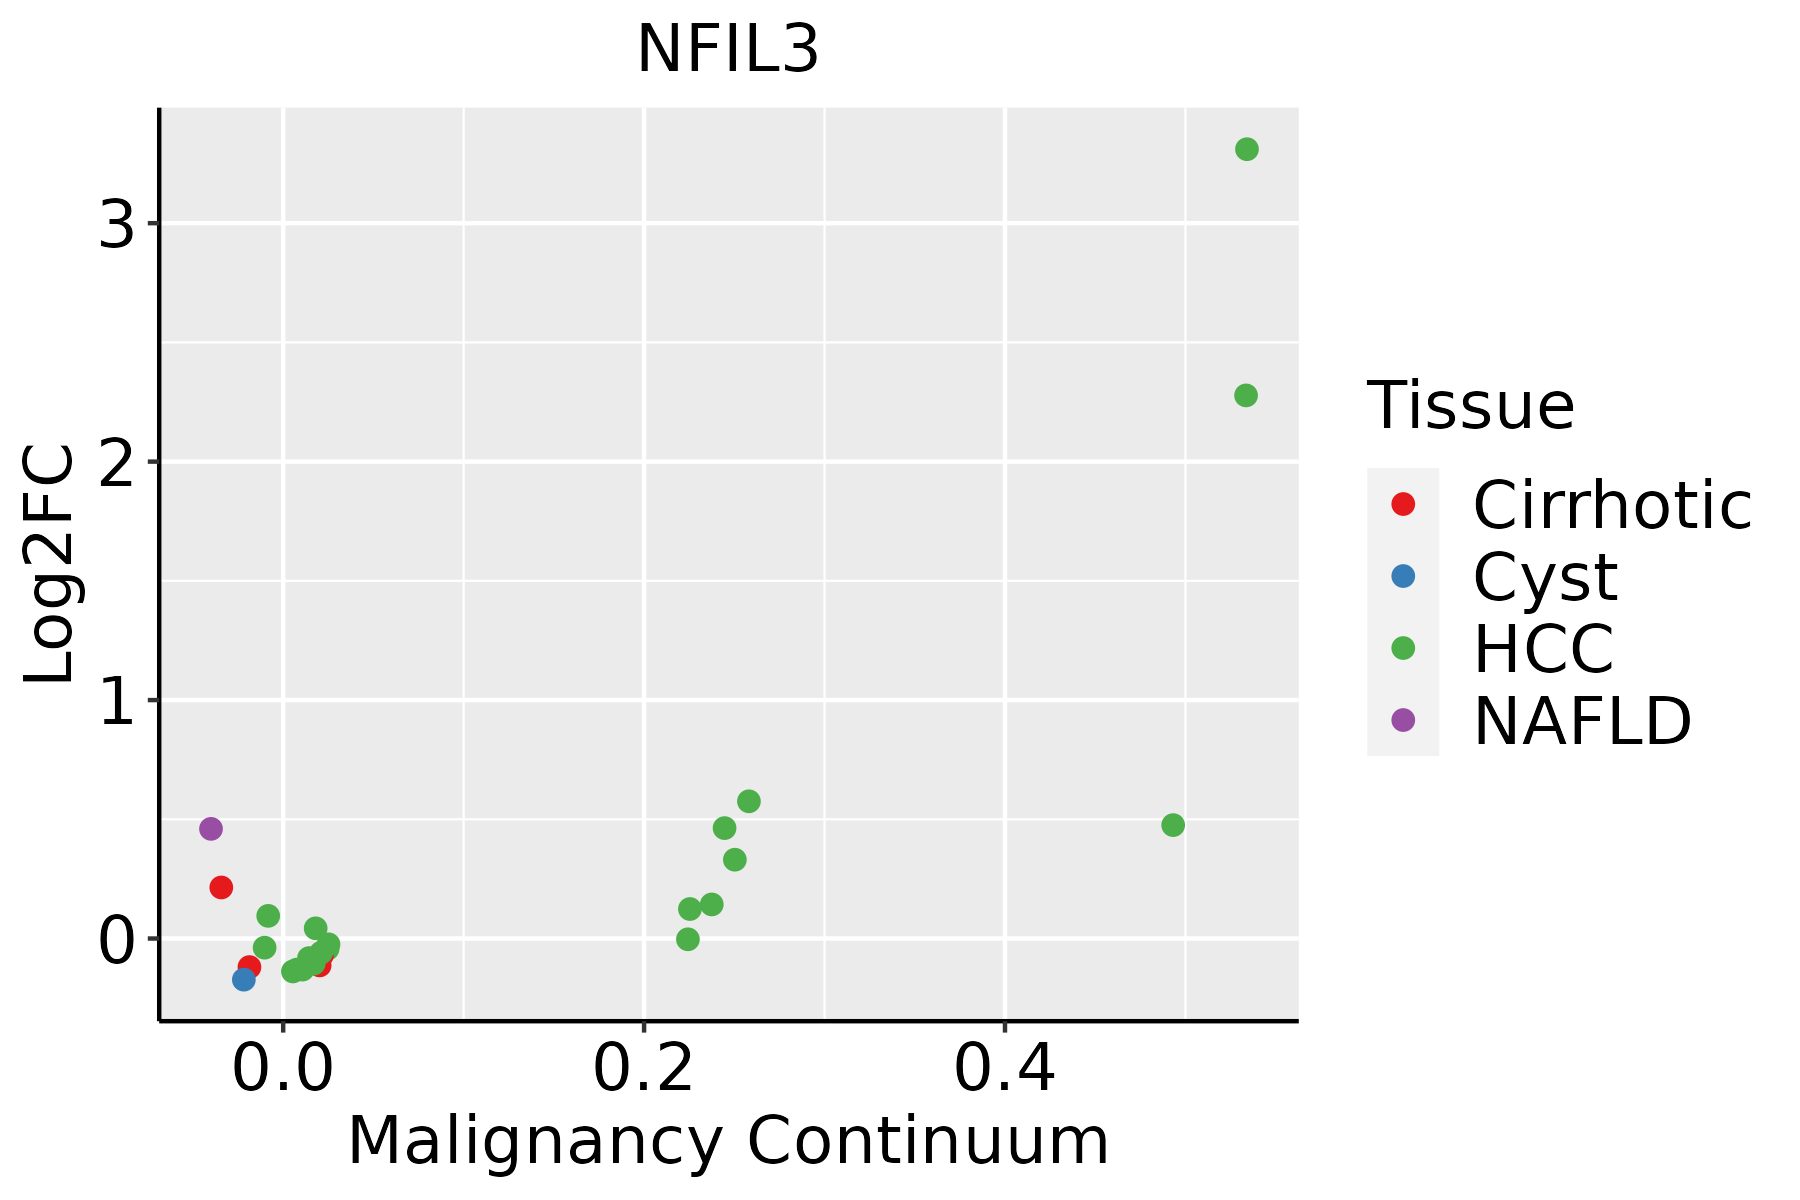
| GO:000762312 | Liver | Cirrhotic | circadian rhythm | 84/4634 | 210/18723 | 7.04e-07 | 1.50e-05 | 84 |
| GO:004851111 | Liver | Cirrhotic | rhythmic process | 103/4634 | 298/18723 | 8.47e-05 | 9.19e-04 | 103 |
| GO:00713532 | Liver | Cirrhotic | cellular response to interleukin-4 | 17/4634 | 33/18723 | 8.32e-04 | 6.06e-03 | 17 |
| GO:00706702 | Liver | Cirrhotic | response to interleukin-4 | 17/4634 | 36/18723 | 2.82e-03 | 1.63e-02 | 17 |
| GO:000762321 | Liver | HCC | circadian rhythm | 117/7958 | 210/18723 | 7.29e-05 | 6.54e-04 | 117 |
| GO:004851121 | Liver | HCC | rhythmic process | 156/7958 | 298/18723 | 3.54e-04 | 2.46e-03 | 156 |
| GO:007135311 | Liver | HCC | cellular response to interleukin-4 | 21/7958 | 33/18723 | 1.16e-02 | 4.28e-02 | 21 |
| GO:004851110 | Prostate | BPH | rhythmic process | 96/3107 | 298/18723 | 1.88e-11 | 1.31e-09 | 96 |
| GO:000762310 | Prostate | BPH | circadian rhythm | 73/3107 | 210/18723 | 1.02e-10 | 6.02e-09 | 73 |
| GO:19031315 | Prostate | BPH | mononuclear cell differentiation | 98/3107 | 426/18723 | 3.43e-04 | 2.55e-03 | 98 |
| GO:00300982 | Prostate | BPH | lymphocyte differentiation | 83/3107 | 374/18723 | 2.76e-03 | 1.46e-02 | 83 |
| GO:00713534 | Prostate | BPH | cellular response to interleukin-4 | 12/3107 | 33/18723 | 4.90e-03 | 2.32e-02 | 12 |
| GO:00706704 | Prostate | BPH | response to interleukin-4 | 12/3107 | 36/18723 | 1.07e-02 | 4.45e-02 | 12 |
| GO:004851115 | Prostate | Tumor | rhythmic process | 99/3246 | 298/18723 | 1.65e-11 | 1.21e-09 | 99 |
| GO:000762315 | Prostate | Tumor | circadian rhythm | 75/3246 | 210/18723 | 1.09e-10 | 6.79e-09 | 75 |
| GO:190313113 | Prostate | Tumor | mononuclear cell differentiation | 102/3246 | 426/18723 | 2.87e-04 | 2.32e-03 | 102 |
| GO:003009811 | Prostate | Tumor | lymphocyte differentiation | 87/3246 | 374/18723 | 1.93e-03 | 1.12e-02 | 87 |
| GO:007135312 | Prostate | Tumor | cellular response to interleukin-4 | 13/3246 | 33/18723 | 2.26e-03 | 1.28e-02 | 13 |
| GO:007067011 | Prostate | Tumor | response to interleukin-4 | 13/3246 | 36/18723 | 5.47e-03 | 2.60e-02 | 13 |
| Hugo Symbol | Variant Class | Variant Classification | dbSNP RS | HGVSc | HGVSp | HGVSp Short | SWISSPROT | BIOTYPE | SIFT | PolyPhen | Tumor Sample Barcode | Tissue | Histology | Sex | Age | Stage | Therapy Types | Drugs | Outcome |
| NFIL3 | SNV | Missense_Mutation | novel | c.571N>C | p.Ser191Pro | p.S191P | Q16649 | protein_coding | tolerated(0.08) | benign(0.067) | TCGA-A7-A0CE-01 | Breast | breast invasive carcinoma | Female | <65 | I/II | Chemotherapy | adriamycin | SD |
| NFIL3 | SNV | Missense_Mutation | novel | c.1287N>T | p.Glu429Asp | p.E429D | Q16649 | protein_coding | deleterious_low_confidence(0.01) | benign(0.006) | TCGA-AN-A046-01 | Breast | breast invasive carcinoma | Female | >=65 | I/II | Unknown | Unknown | SD |
| NFIL3 | SNV | Missense_Mutation | rs374204202 | c.1352T>C | p.Ile451Thr | p.I451T | Q16649 | protein_coding | deleterious_low_confidence(0.03) | benign(0.006) | TCGA-E2-A14R-01 | Breast | breast invasive carcinoma | Female | <65 | I/II | Chemotherapy | doxorubicin | PD |
| NFIL3 | SNV | Missense_Mutation | | c.276N>C | p.Glu92Asp | p.E92D | Q16649 | protein_coding | deleterious(0) | probably_damaging(0.978) | TCGA-EW-A1J5-01 | Breast | breast invasive carcinoma | Female | <65 | I/II | Chemotherapy | adriamycin | SD |
| NFIL3 | insertion | Nonsense_Mutation | novel | c.442_443insGATGGAGAAGACGAGCAACAGGTCCCCAAGGGCCCCATCC | p.Tyr148Ter | p.Y148* | Q16649 | protein_coding | | | TCGA-A2-A0CT-01 | Breast | breast invasive carcinoma | Female | >=65 | I/II | Chemotherapy | cytoxan | SD |
| NFIL3 | insertion | In_Frame_Ins | novel | c.568_569insCAACTGTGGTTAAAG | p.Asp189_Val190insAlaThrValValLys | p.D189_V190insATVVK | Q16649 | protein_coding | | | TCGA-A7-A0CE-01 | Breast | breast invasive carcinoma | Female | <65 | I/II | Chemotherapy | adriamycin | SD |
| NFIL3 | insertion | In_Frame_Ins | novel | c.355_356insAGAGGT | p.Glu118_Leu119insGlnArg | p.E118_L119insQR | Q16649 | protein_coding | | | TCGA-A7-A0CE-01 | Breast | breast invasive carcinoma | Female | <65 | I/II | Chemotherapy | adriamycin | SD |
| NFIL3 | insertion | Frame_Shift_Ins | novel | c.353_354insAGCAGGGGATAGCAAACTTATCT | p.Leu119AlafsTer12 | p.L119Afs*12 | Q16649 | protein_coding | | | TCGA-A7-A0CE-01 | Breast | breast invasive carcinoma | Female | <65 | I/II | Chemotherapy | adriamycin | SD |
| NFIL3 | insertion | Nonsense_Mutation | novel | c.314_315insTTGATAATGAATTTT | p.Leu105_Ile106insTer | p.L105_I106ins* | Q16649 | protein_coding | | | TCGA-A7-A0CJ-01 | Breast | breast invasive carcinoma | Female | <65 | I/II | Chemotherapy | cytoxan | SD |
| NFIL3 | insertion | Frame_Shift_Ins | novel | c.312_313insGTAGAAGC | p.Leu105ValfsTer4 | p.L105Vfs*4 | Q16649 | protein_coding | | | TCGA-A7-A0CJ-01 | Breast | breast invasive carcinoma | Female | <65 | I/II | Chemotherapy | cytoxan | SD |