
|
|||||
|
 | |
| |
| |
| |
| |
| |
|
Gene: NDRG4 |
Gene summary for NDRG4 |
| Gene information | Species | Human | Gene symbol | NDRG4 | Gene ID | 65009 |
| Gene name | NDRG family member 4 | |
| Gene Alias | BDM1 | |
| Cytomap | 16q21 | |
| Gene Type | protein-coding | GO ID | GO:0000165 | UniProtAcc | Q9ULP0 |
Top |
Malignant transformation analysis |
| Identification of the aberrant gene expression in precancerous and cancerous lesions by comparing the gene expression of stem-like cells in diseased tissues with normal stem cells |
| Entrez ID | Symbol | Replicates | Species | Organ | Tissue | Adj P-value | Log2FC | Malignancy |
| 65009 | NDRG4 | P32T-E | Human | Esophagus | ESCC | 2.11e-14 | 3.79e-01 | 0.1666 |
| 65009 | NDRG4 | P37T-E | Human | Esophagus | ESCC | 1.32e-12 | 2.53e-01 | 0.1371 |
| 65009 | NDRG4 | P39T-E | Human | Esophagus | ESCC | 7.89e-11 | 2.13e-01 | 0.0894 |
| 65009 | NDRG4 | P40T-E | Human | Esophagus | ESCC | 5.56e-10 | 2.10e-01 | 0.109 |
| 65009 | NDRG4 | P42T-E | Human | Esophagus | ESCC | 1.19e-10 | 2.82e-01 | 0.1175 |
| 65009 | NDRG4 | P44T-E | Human | Esophagus | ESCC | 5.93e-08 | 1.16e-01 | 0.1096 |
| 65009 | NDRG4 | P47T-E | Human | Esophagus | ESCC | 1.85e-21 | 5.74e-01 | 0.1067 |
| 65009 | NDRG4 | P48T-E | Human | Esophagus | ESCC | 3.07e-05 | 9.88e-02 | 0.0959 |
| 65009 | NDRG4 | P49T-E | Human | Esophagus | ESCC | 2.83e-15 | 1.11e+00 | 0.1768 |
| 65009 | NDRG4 | P52T-E | Human | Esophagus | ESCC | 1.16e-15 | 5.57e-01 | 0.1555 |
| 65009 | NDRG4 | P54T-E | Human | Esophagus | ESCC | 3.47e-02 | 3.67e-02 | 0.0975 |
| 65009 | NDRG4 | P61T-E | Human | Esophagus | ESCC | 2.49e-18 | 3.93e-01 | 0.099 |
| 65009 | NDRG4 | P62T-E | Human | Esophagus | ESCC | 4.42e-04 | 6.44e-02 | 0.1302 |
| 65009 | NDRG4 | P65T-E | Human | Esophagus | ESCC | 2.41e-10 | 2.41e-01 | 0.0978 |
| 65009 | NDRG4 | P74T-E | Human | Esophagus | ESCC | 5.32e-10 | 2.63e-01 | 0.1479 |
| 65009 | NDRG4 | P76T-E | Human | Esophagus | ESCC | 2.34e-11 | 2.63e-01 | 0.1207 |
| 65009 | NDRG4 | P79T-E | Human | Esophagus | ESCC | 4.11e-07 | 1.70e-01 | 0.1154 |
| 65009 | NDRG4 | P83T-E | Human | Esophagus | ESCC | 7.96e-36 | 9.33e-01 | 0.1738 |
| 65009 | NDRG4 | P107T-E | Human | Esophagus | ESCC | 1.64e-06 | 6.19e-02 | 0.171 |
| 65009 | NDRG4 | P126T-E | Human | Esophagus | ESCC | 3.54e-03 | 3.15e-01 | 0.1125 |
| Page: 1 2 3 |
| Tissue | Expression Dynamics | Abbreviation |
| Esophagus | 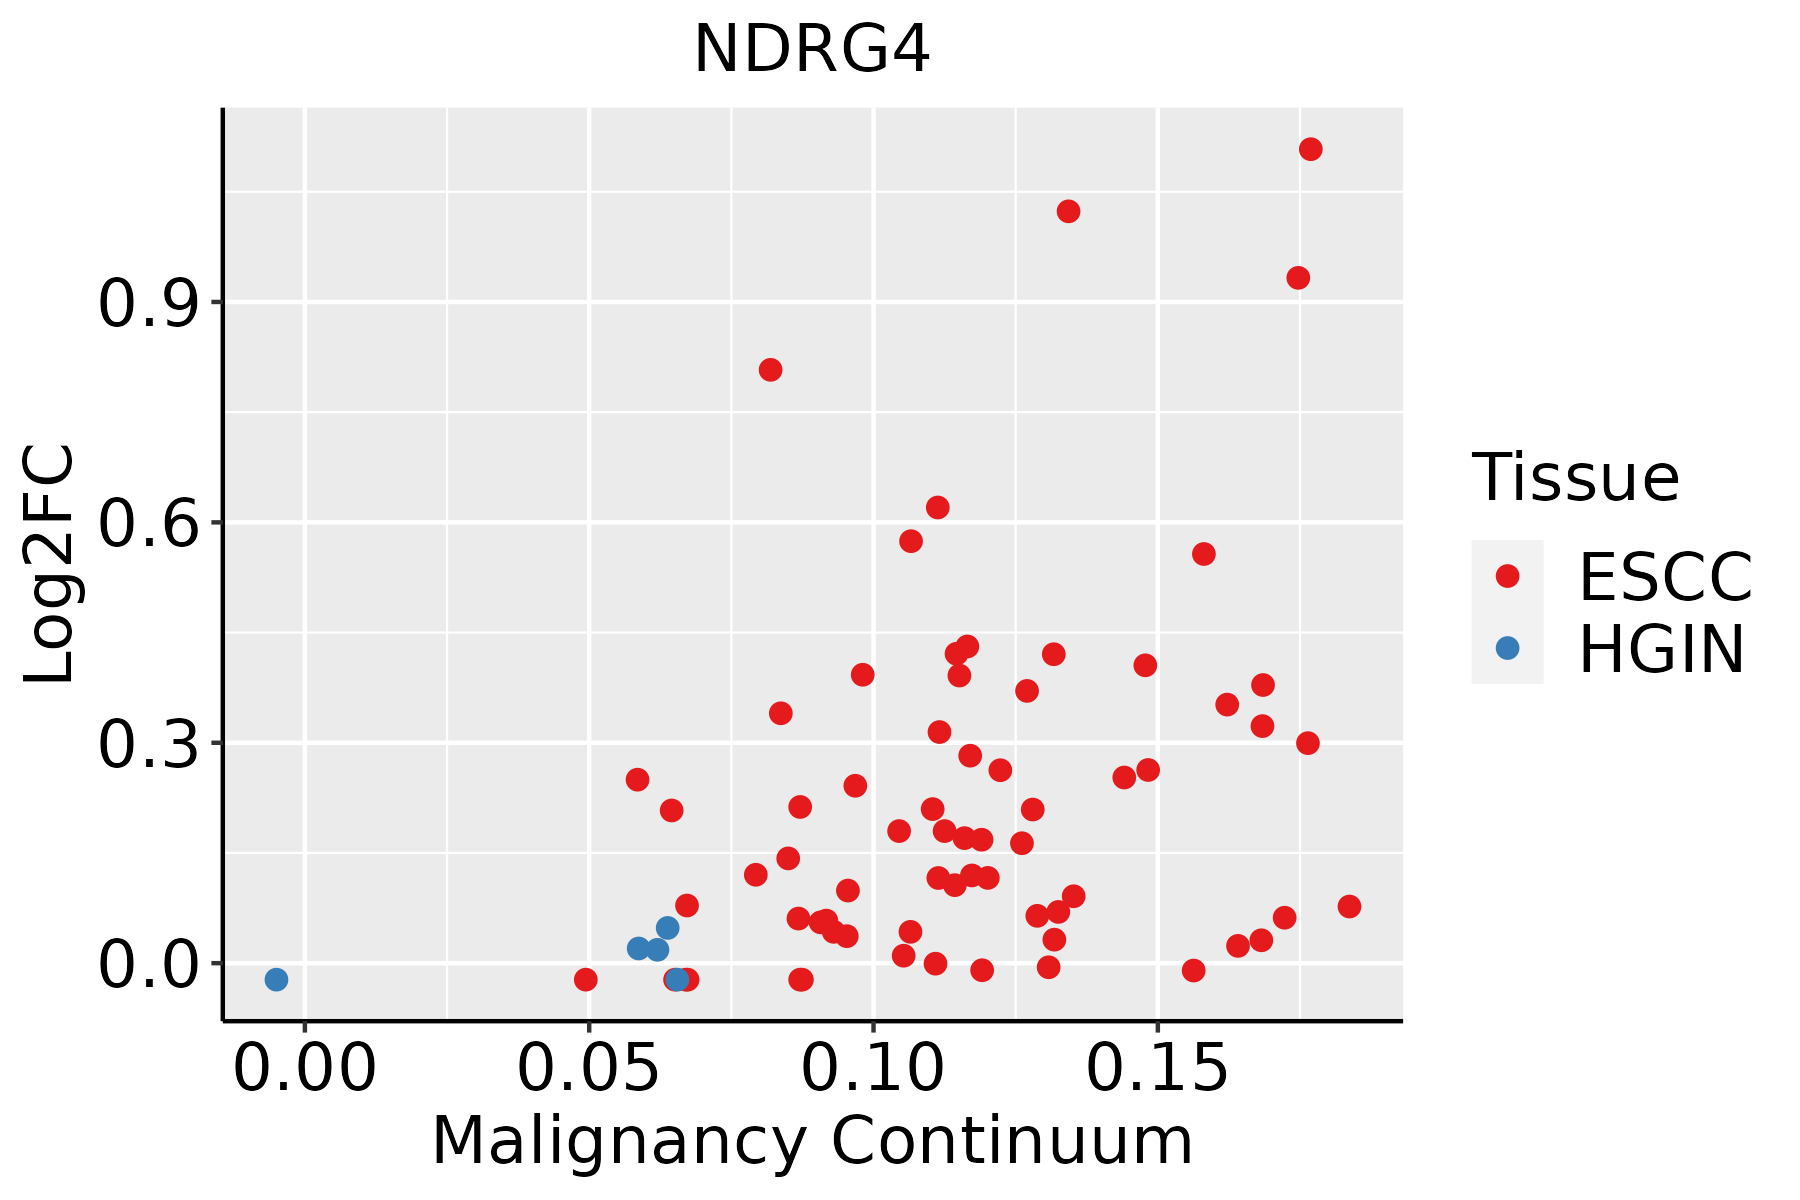 | ESCC: Esophageal squamous cell carcinoma |
| HGIN: High-grade intraepithelial neoplasias | ||
| LGIN: Low-grade intraepithelial neoplasias |
| ∗log2FC in expression of this searched gene in stem-like cells from each diseased tissue sample relative to stem-like cells in normal samples in each tissue plotted against the malignancy continuum. Samples are colored based on if they are from different disease stage. |
Top |
Malignant transformation related pathway analysis |
| Find out the enriched GO biological processes and KEGG pathways involved in transition from healthy to precancer to cancer |
| Tissue | Disease Stage | Enriched GO biological Processes |
| Colorectum | AD |  |
| Colorectum | SER |  |
| Colorectum | MSS |  |
| Colorectum | MSI-H |  |
| Colorectum | FAP |  |
| ∗Top 15 enriched GO BP terms are showed in the bar plot of each disease state in each tissue. Each row represents a significant GO biological process which is colored according to the -log10(p.adjust). |
| Page: 1 2 3 4 5 6 7 8 9 |
| GO ID | Tissue | Disease Stage | Description | Gene Ratio | Bg Ratio | pvalue | p.adjust | Count |
| GO:003238618 | Esophagus | ESCC | regulation of intracellular transport | 243/8552 | 337/18723 | 3.20e-23 | 7.25e-21 | 243 |
| GO:001619715 | Esophagus | ESCC | endosomal transport | 168/8552 | 230/18723 | 2.28e-17 | 1.93e-15 | 168 |
| GO:000931419 | Esophagus | ESCC | response to radiation | 277/8552 | 456/18723 | 4.42e-11 | 1.43e-09 | 277 |
| GO:009887615 | Esophagus | ESCC | vesicle-mediated transport to the plasma membrane | 99/8552 | 136/18723 | 1.13e-10 | 3.39e-09 | 99 |
| GO:00224069 | Esophagus | ESCC | membrane docking | 62/8552 | 86/18723 | 5.93e-07 | 7.79e-06 | 62 |
| GO:00480087 | Esophagus | ESCC | platelet-derived growth factor receptor signaling pathway | 42/8552 | 56/18723 | 7.62e-06 | 7.54e-05 | 42 |
| GO:006056210 | Esophagus | ESCC | epithelial tube morphogenesis | 187/8552 | 325/18723 | 9.95e-06 | 9.44e-05 | 187 |
| GO:003134616 | Esophagus | ESCC | positive regulation of cell projection organization | 201/8552 | 353/18723 | 1.19e-05 | 1.11e-04 | 201 |
| GO:000941611 | Esophagus | ESCC | response to light stimulus | 183/8552 | 320/18723 | 2.03e-05 | 1.76e-04 | 183 |
| GO:00324565 | Esophagus | ESCC | endocytic recycling | 51/8552 | 73/18723 | 2.47e-05 | 2.10e-04 | 51 |
| GO:01400567 | Esophagus | ESCC | organelle localization by membrane tethering | 53/8552 | 77/18723 | 3.33e-05 | 2.74e-04 | 53 |
| GO:001097516 | Esophagus | ESCC | regulation of neuron projection development | 240/8552 | 445/18723 | 2.48e-04 | 1.53e-03 | 240 |
| GO:00485687 | Esophagus | ESCC | embryonic organ development | 228/8552 | 427/18723 | 7.28e-04 | 3.79e-03 | 228 |
| GO:00482781 | Esophagus | ESCC | vesicle docking | 38/8552 | 59/18723 | 2.86e-03 | 1.21e-02 | 38 |
| GO:00486597 | Esophagus | ESCC | smooth muscle cell proliferation | 103/8552 | 184/18723 | 3.08e-03 | 1.28e-02 | 103 |
| GO:006053716 | Esophagus | ESCC | muscle tissue development | 211/8552 | 403/18723 | 3.84e-03 | 1.56e-02 | 211 |
| GO:00486607 | Esophagus | ESCC | regulation of smooth muscle cell proliferation | 100/8552 | 180/18723 | 4.76e-03 | 1.85e-02 | 100 |
| GO:00330025 | Esophagus | ESCC | muscle cell proliferation | 134/8552 | 248/18723 | 4.80e-03 | 1.86e-02 | 134 |
| GO:00109764 | Esophagus | ESCC | positive regulation of neuron projection development | 91/8552 | 163/18723 | 5.72e-03 | 2.13e-02 | 91 |
| GO:0010640 | Esophagus | ESCC | regulation of platelet-derived growth factor receptor signaling pathway | 17/8552 | 23/18723 | 5.73e-03 | 2.13e-02 | 17 |
| Page: 1 2 |
| Pathway ID | Tissue | Disease Stage | Description | Gene Ratio | Bg Ratio | pvalue | p.adjust | qvalue | Count |
| Page: 1 |
Top |
Cell-cell communication analysis |
| Identification of potential cell-cell interactions between two cell types and their ligand-receptor pairs for different disease states |
| Ligand | Receptor | LRpair | Pathway | Tissue | Disease Stage |
| Page: 1 |
Top |
Single-cell gene regulatory network inference analysis |
| Find out the significant the regulons (TFs) and the target genes of each regulon across cell types for different disease states |
| TF | Cell Type | Tissue | Disease Stage | Target Gene | RSS | Regulon Activity |
| ∗The dot plots of a searched regulon are shown for all cell subpopulations in each disease state of each tissue based on the regulon specific score inferred using pySCENIC and by calculating the average expression. |
| Page: 1 |
Top |
Somatic mutation of malignant transformation related genes |
| Annotation of somatic variants for genes involved in malignant transformation |
| Hugo Symbol | Variant Class | Variant Classification | dbSNP RS | HGVSc | HGVSp | HGVSp Short | SWISSPROT | BIOTYPE | SIFT | PolyPhen | Tumor Sample Barcode | Tissue | Histology | Sex | Age | Stage | Therapy Types | Drugs | Outcome |
| NDRG4 | SNV | Missense_Mutation | c.979C>G | p.Leu327Val | p.L327V | Q9ULP0 | protein_coding | tolerated(0.23) | possibly_damaging(0.73) | TCGA-A7-A0DA-01 | Breast | breast invasive carcinoma | Female | <65 | I/II | Chemotherapy | adriamycin | SD | |
| NDRG4 | SNV | Missense_Mutation | rs200710260 | c.245G>A | p.Arg82His | p.R82H | Q9ULP0 | protein_coding | tolerated(0.09) | benign(0) | TCGA-AN-A046-01 | Breast | breast invasive carcinoma | Female | >=65 | I/II | Unknown | Unknown | SD |
| NDRG4 | SNV | Missense_Mutation | c.1023N>A | p.Met341Ile | p.M341I | Q9ULP0 | protein_coding | tolerated(0.89) | benign(0) | TCGA-AO-A0J3-01 | Breast | breast invasive carcinoma | Female | >=65 | I/II | Chemotherapy | cyclophosphamide | SD | |
| NDRG4 | SNV | Missense_Mutation | novel | c.165C>G | p.Asp55Glu | p.D55E | Q9ULP0 | protein_coding | tolerated(0.22) | probably_damaging(0.971) | TCGA-2W-A8YY-01 | Cervix | cervical & endocervical cancer | Female | <65 | I/II | Chemotherapy | cisplatin | CR |
| NDRG4 | SNV | Missense_Mutation | rs760614649 | c.315C>G | p.Phe105Leu | p.F105L | Q9ULP0 | protein_coding | tolerated(0.11) | benign(0.009) | TCGA-Q1-A73O-01 | Cervix | cervical & endocervical cancer | Female | <65 | I/II | Chemotherapy | cisplatin | CR |
| NDRG4 | SNV | Missense_Mutation | rs370628261 | c.1043G>A | p.Arg348His | p.R348H | Q9ULP0 | protein_coding | deleterious(0.03) | probably_damaging(0.934) | TCGA-WS-AB45-01 | Colorectum | colon adenocarcinoma | Female | <65 | I/II | Unknown | Unknown | SD |
| NDRG4 | SNV | Missense_Mutation | c.1100N>A | p.Arg367His | p.R367H | Q9ULP0 | protein_coding | tolerated(0.06) | probably_damaging(0.95) | TCGA-F5-6464-01 | Colorectum | rectum adenocarcinoma | Female | >=65 | III/IV | Unknown | Unknown | SD | |
| NDRG4 | insertion | Frame_Shift_Ins | novel | c.113dupG | p.Gln39ProfsTer24 | p.Q39Pfs*24 | Q9ULP0 | protein_coding | TCGA-AA-3947-01 | Colorectum | colon adenocarcinoma | Female | <65 | I/II | Unknown | Unknown | SD | ||
| NDRG4 | SNV | Missense_Mutation | novel | c.826N>G | p.Thr276Ala | p.T276A | Q9ULP0 | protein_coding | deleterious(0.01) | possibly_damaging(0.526) | TCGA-A5-A0G2-01 | Endometrium | uterine corpus endometrioid carcinoma | Female | <65 | III/IV | Unknown | Unknown | SD |
| NDRG4 | SNV | Missense_Mutation | rs202237732 | c.244C>T | p.Arg82Cys | p.R82C | Q9ULP0 | protein_coding | deleterious(0) | possibly_damaging(0.53) | TCGA-A5-A0R9-01 | Endometrium | uterine corpus endometrioid carcinoma | Female | <65 | I/II | Unknown | Unknown | SD |
| Page: 1 2 3 |
Top |
Related drugs of malignant transformation related genes |
| Identification of chemicals and drugs interact with genes involved in malignant transfromation |
| (DGIdb 4.0) |
| Entrez ID | Symbol | Category | Interaction Types | Drug Claim Name | Drug Name | PMIDs |
| Page: 1 |

Copyright 2023-Present -The University of Texas Health Science Center at Houston |