
|
|||||
|
 | |
| |
| |
| |
| |
| |
|
Gene: NDRG1 |
Gene summary for NDRG1 |
| Gene information | Species | Human | Gene symbol | NDRG1 | Gene ID | 10397 |
| Gene name | N-myc downstream regulated 1 | |
| Gene Alias | CAP43 | |
| Cytomap | 8q24.22 | |
| Gene Type | protein-coding | GO ID | GO:0001666 | UniProtAcc | Q92597 |
Top |
Malignant transformation analysis |
| Identification of the aberrant gene expression in precancerous and cancerous lesions by comparing the gene expression of stem-like cells in diseased tissues with normal stem cells |
| Entrez ID | Symbol | Replicates | Species | Organ | Tissue | Adj P-value | Log2FC | Malignancy |
| 10397 | NDRG1 | brca1 | Human | Breast | Precancer | 3.03e-02 | -1.92e-01 | -0.0338 |
| 10397 | NDRG1 | brca3 | Human | Breast | Precancer | 3.61e-07 | 4.48e-01 | -0.0263 |
| 10397 | NDRG1 | brca7 | Human | Breast | Precancer | 4.78e-03 | 7.87e-01 | -0.009 |
| 10397 | NDRG1 | brca10 | Human | Breast | Precancer | 1.66e-27 | 8.88e-01 | -0.0029 |
| 10397 | NDRG1 | NCCBC14 | Human | Breast | DCIS | 1.30e-07 | -2.52e-01 | 0.2021 |
| 10397 | NDRG1 | NCCBC3 | Human | Breast | DCIS | 3.16e-04 | -2.58e-01 | 0.1198 |
| 10397 | NDRG1 | NCCBC5 | Human | Breast | DCIS | 1.96e-08 | -2.77e-01 | 0.2046 |
| 10397 | NDRG1 | P1 | Human | Breast | IDC | 1.13e-10 | -1.29e-01 | 0.1527 |
| 10397 | NDRG1 | P2 | Human | Breast | IDC | 7.68e-06 | 3.55e-02 | 0.21 |
| 10397 | NDRG1 | DCIS2 | Human | Breast | DCIS | 4.35e-30 | -1.06e-01 | 0.0085 |
| 10397 | NDRG1 | CA_HPV_1 | Human | Cervix | CC | 3.10e-02 | 6.89e-02 | 0.0264 |
| 10397 | NDRG1 | CA_HPV_2 | Human | Cervix | CC | 4.43e-06 | 4.95e-01 | 0.0391 |
| 10397 | NDRG1 | CA_HPV_3 | Human | Cervix | CC | 1.63e-02 | 1.76e-01 | 0.0414 |
| 10397 | NDRG1 | CCI_1 | Human | Cervix | CC | 6.54e-25 | 2.81e+00 | 0.528 |
| 10397 | NDRG1 | CCI_3 | Human | Cervix | CC | 6.28e-08 | 2.14e+00 | 0.516 |
| 10397 | NDRG1 | CCII_1 | Human | Cervix | CC | 1.05e-02 | 5.14e-01 | 0.3249 |
| 10397 | NDRG1 | Tumor | Human | Cervix | CC | 7.26e-34 | 8.53e-01 | 0.1241 |
| 10397 | NDRG1 | sample1 | Human | Cervix | CC | 2.25e-10 | 7.09e-01 | 0.0959 |
| 10397 | NDRG1 | sample3 | Human | Cervix | CC | 1.71e-48 | 1.10e+00 | 0.1387 |
| 10397 | NDRG1 | L1 | Human | Cervix | CC | 1.10e-15 | 7.65e-01 | 0.0802 |
| Page: 1 2 3 4 5 6 7 8 9 10 11 12 13 14 |
| Tissue | Expression Dynamics | Abbreviation |
| Breast | 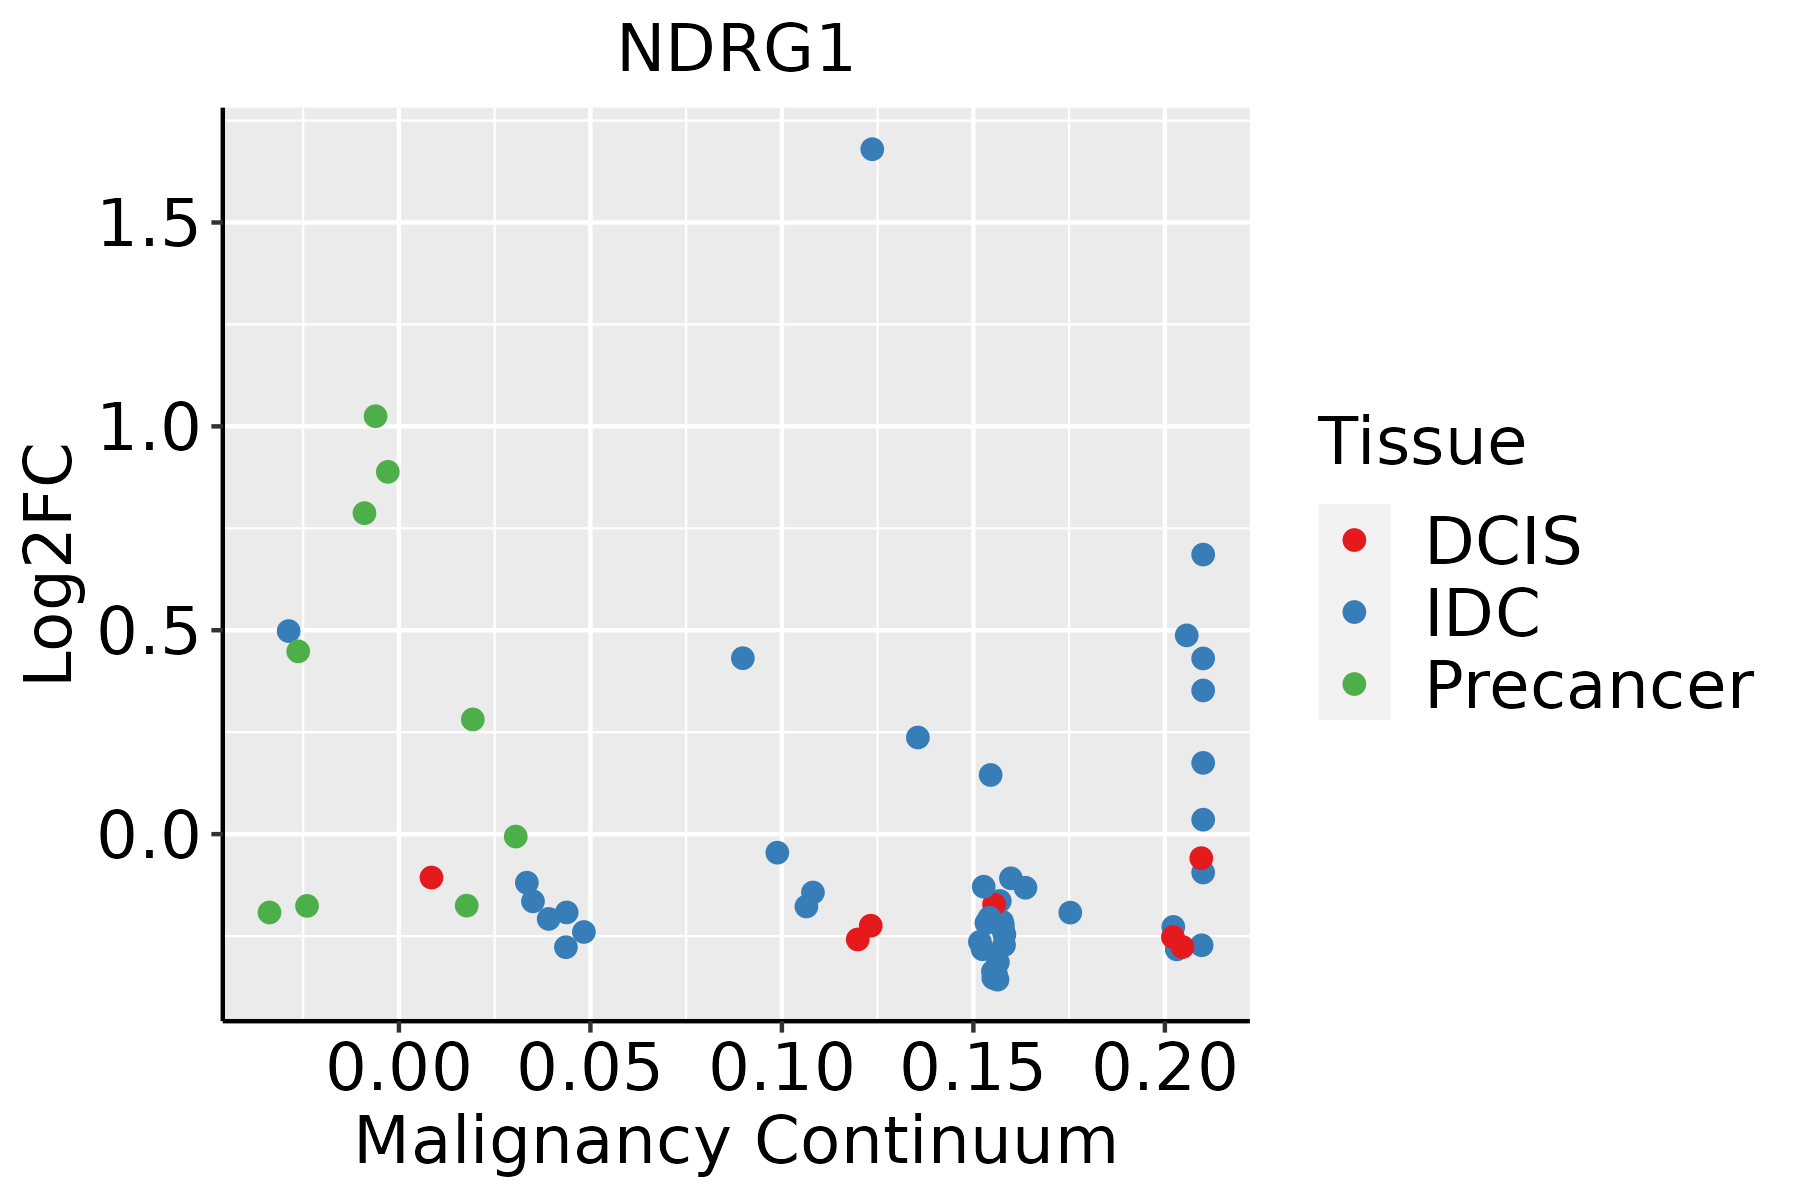 | IDC: Invasive ductal carcinoma |
| DCIS: Ductal carcinoma in situ | ||
| Precancer(BRCA1-mut): Precancerous lesion from BRCA1 mutation carriers | ||
| Cervix |  | CC: Cervix cancer |
| HSIL_HPV: HPV-infected high-grade squamous intraepithelial lesions | ||
| N_HPV: HPV-infected normal cervix | ||
| Colorectum (GSE201348) |  | FAP: Familial adenomatous polyposis |
| CRC: Colorectal cancer | ||
| Colorectum (HTA11) |  | AD: Adenomas |
| SER: Sessile serrated lesions | ||
| MSI-H: Microsatellite-high colorectal cancer | ||
| MSS: Microsatellite stable colorectal cancer | ||
| Endometrium | 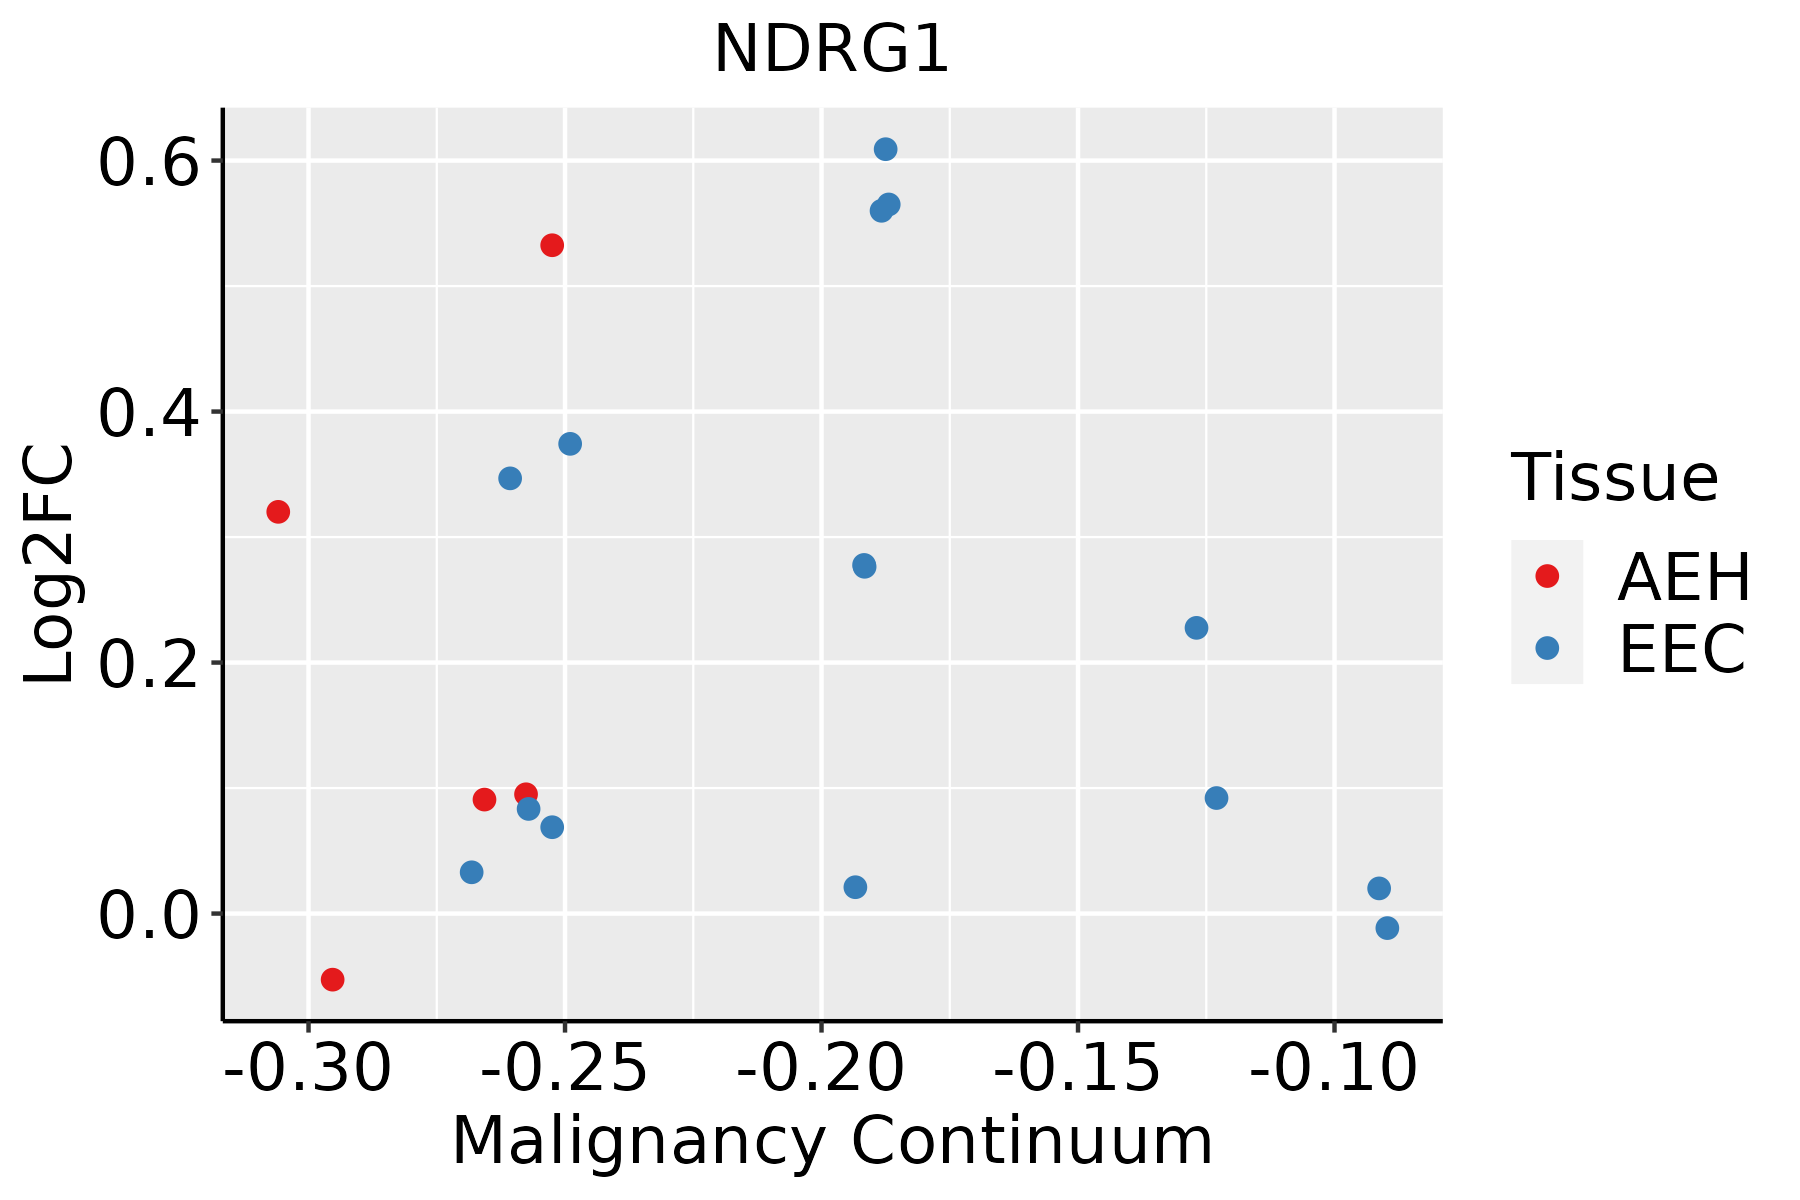 | AEH: Atypical endometrial hyperplasia |
| EEC: Endometrioid Cancer | ||
| Esophagus | 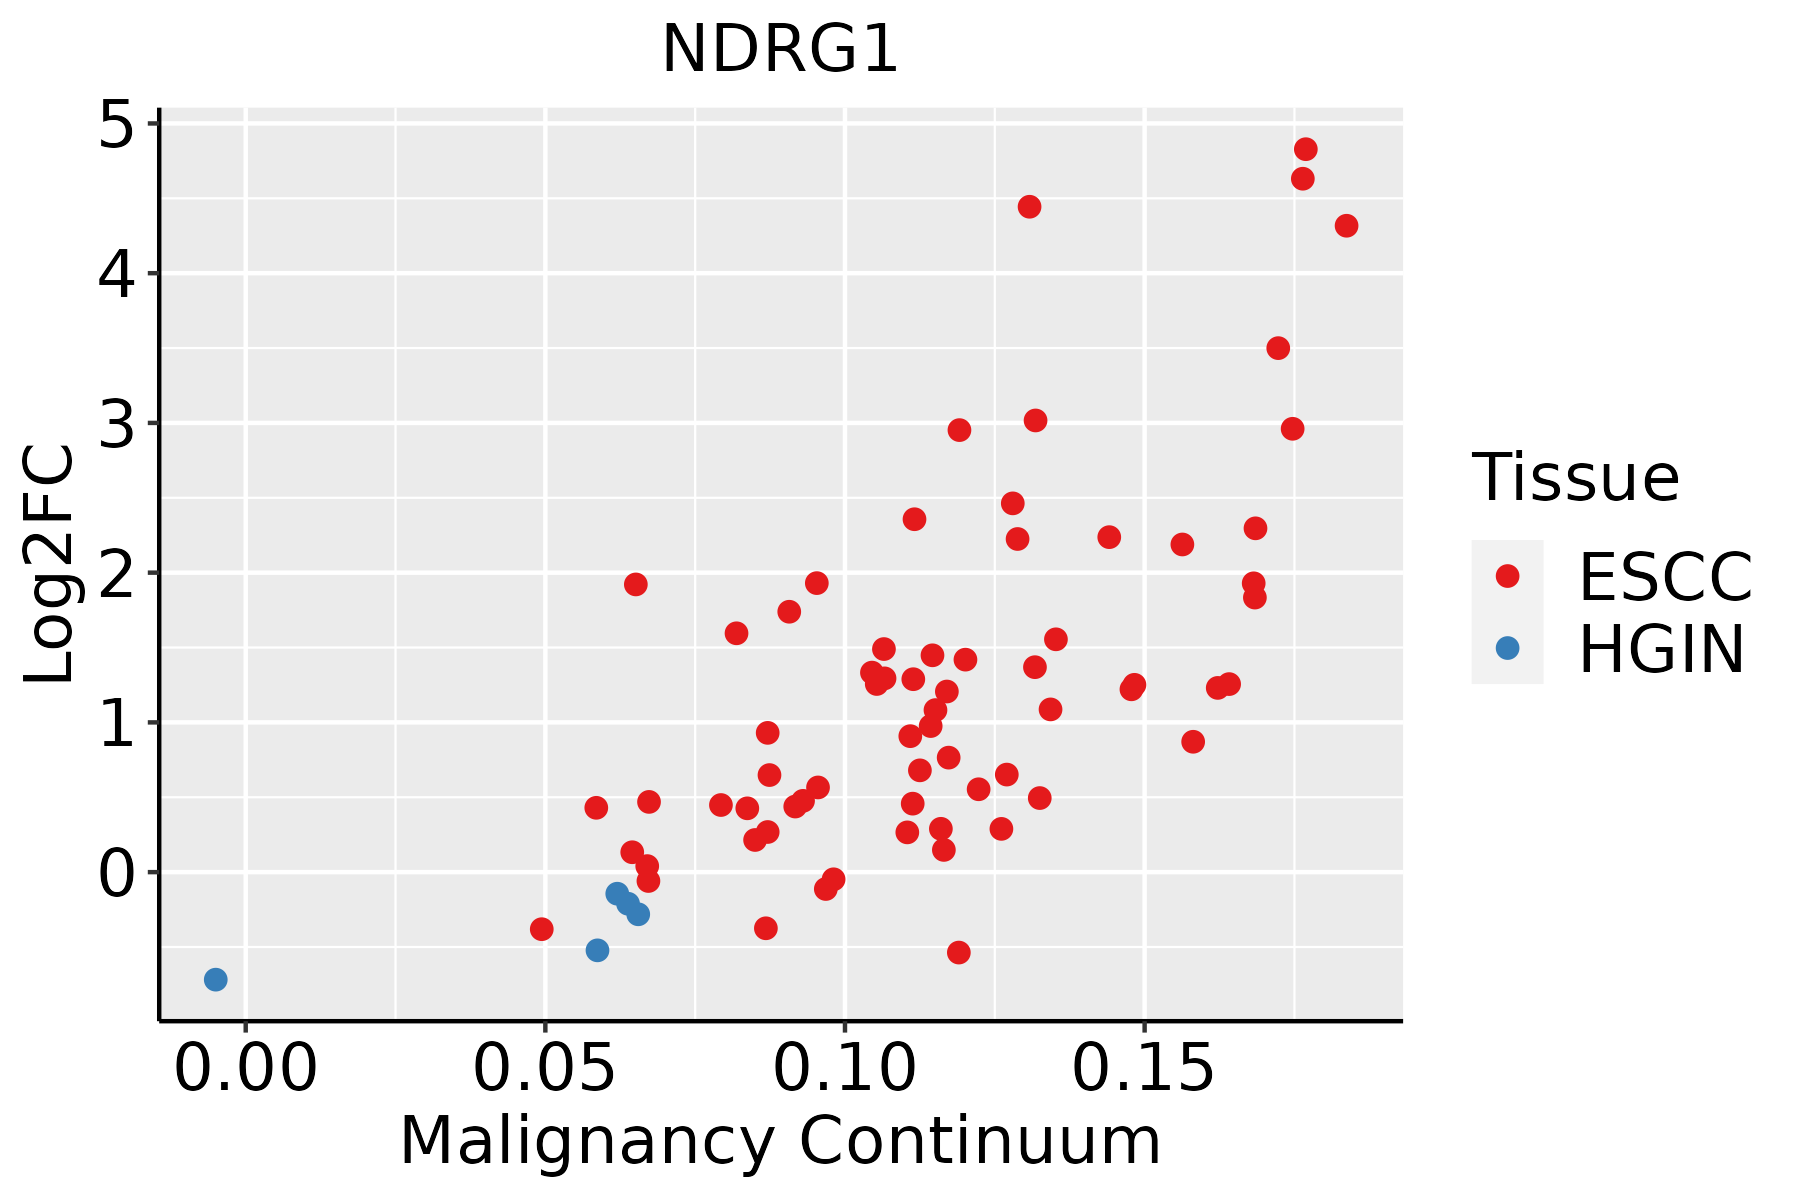 | ESCC: Esophageal squamous cell carcinoma |
| HGIN: High-grade intraepithelial neoplasias | ||
| LGIN: Low-grade intraepithelial neoplasias | ||
| GC | 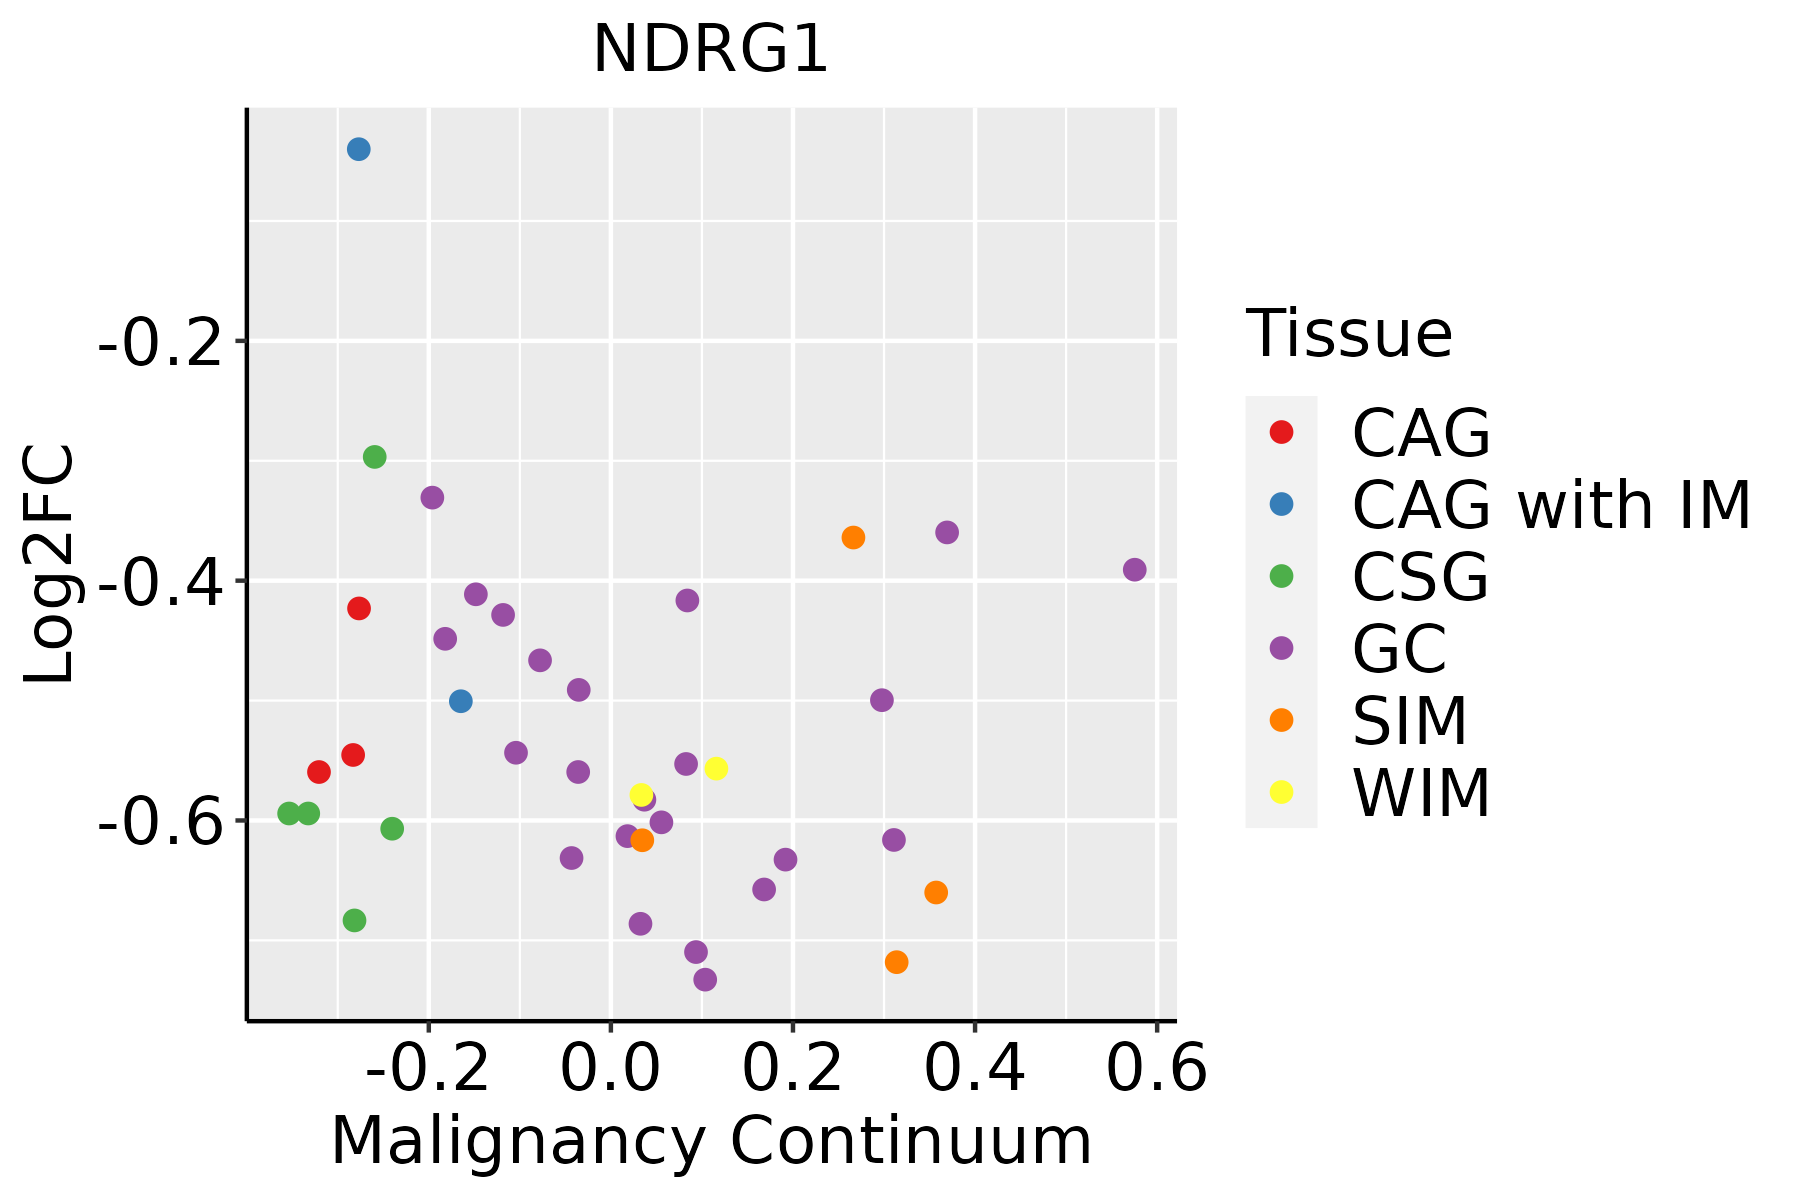 | CAG: Chronic atrophic gastritis |
| CAG with IM: Chronic atrophic gastritis with intestinal metaplasia | ||
| CSG: Chronic superficial gastritis | ||
| GC: Gastric cancer | ||
| SIM: Severe intestinal metaplasia | ||
| WIM: Wild intestinal metaplasia | ||
| Liver |  | HCC: Hepatocellular carcinoma |
| NAFLD: Non-alcoholic fatty liver disease | ||
| Lung | 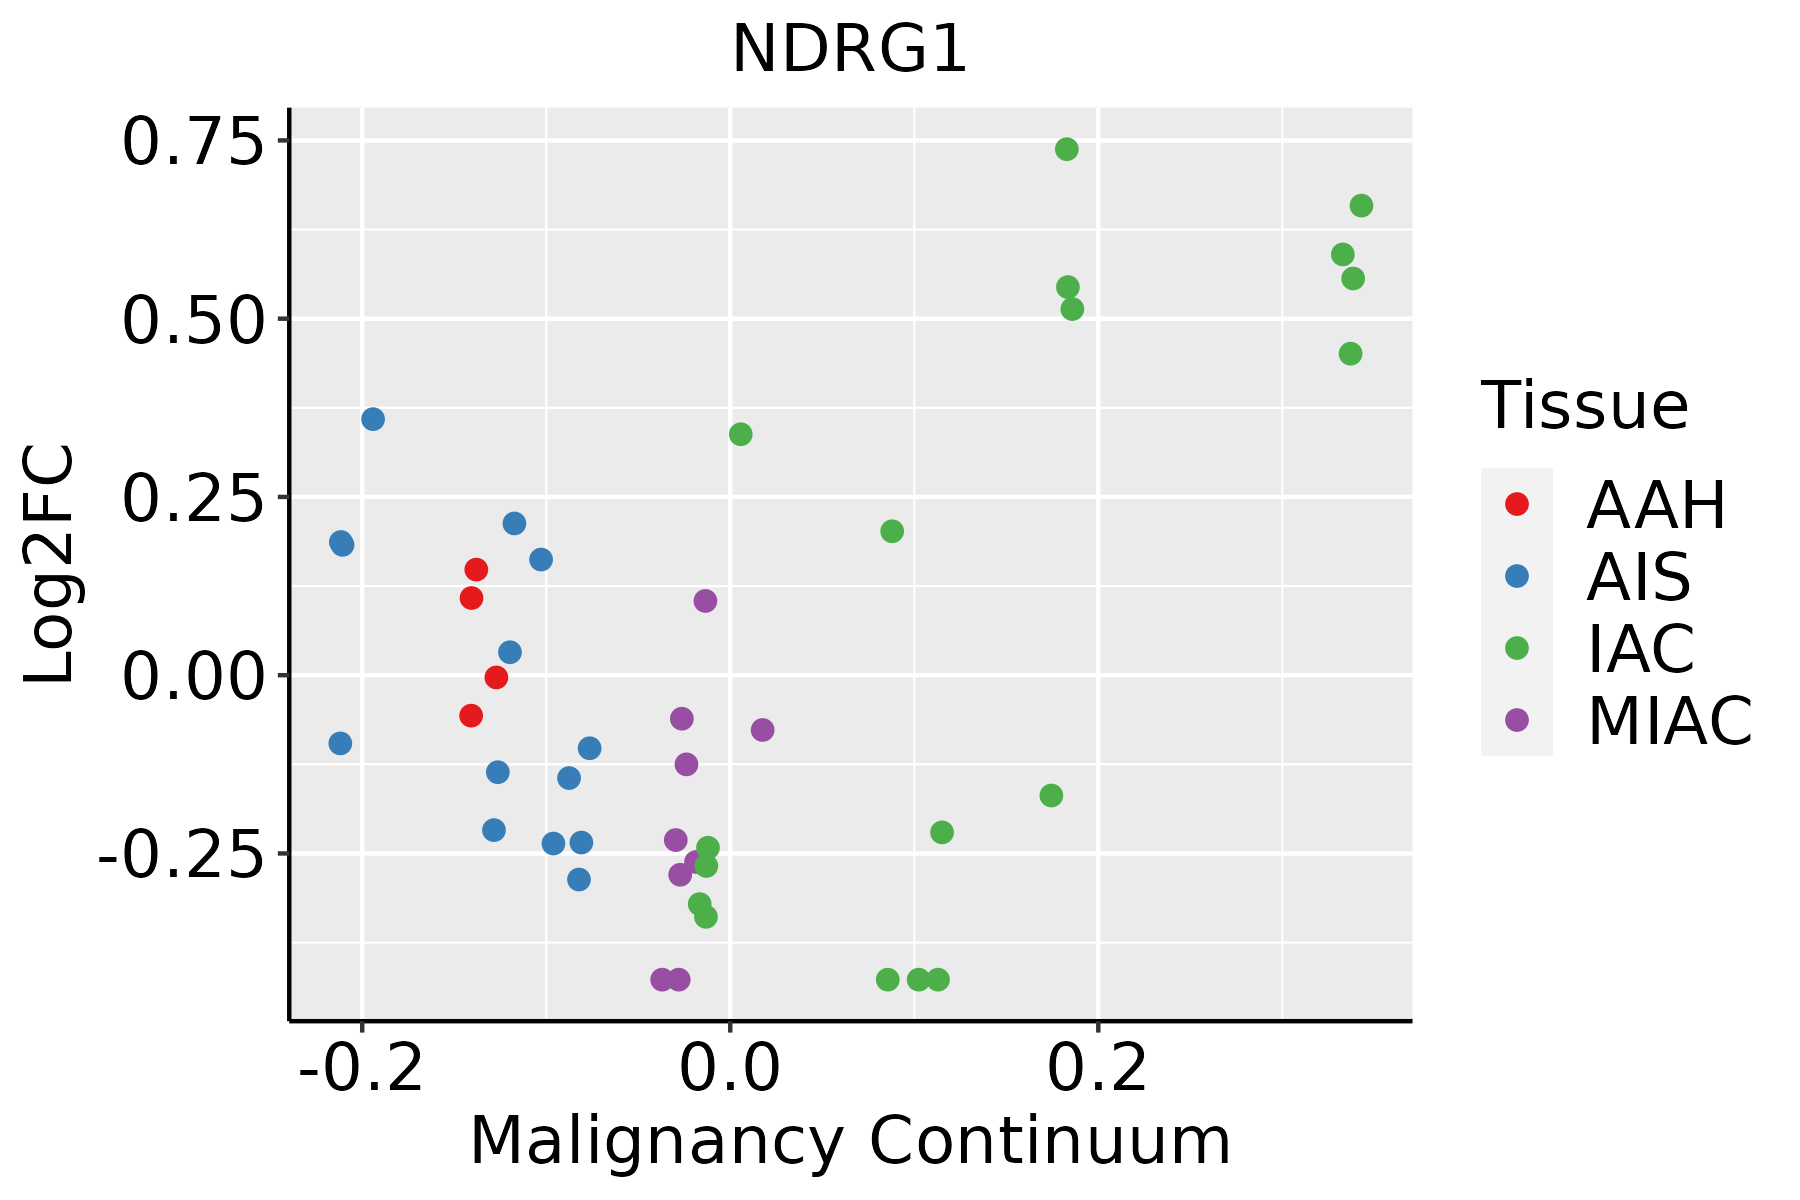 | AAH: Atypical adenomatous hyperplasia |
| AIS: Adenocarcinoma in situ | ||
| IAC: Invasive lung adenocarcinoma | ||
| MIA: Minimally invasive adenocarcinoma | ||
| Oral Cavity |  | EOLP: Erosive Oral lichen planus |
| LP: leukoplakia | ||
| NEOLP: Non-erosive oral lichen planus | ||
| OSCC: Oral squamous cell carcinoma | ||
| Prostate |  | BPH: Benign Prostatic Hyperplasia |
| Skin | 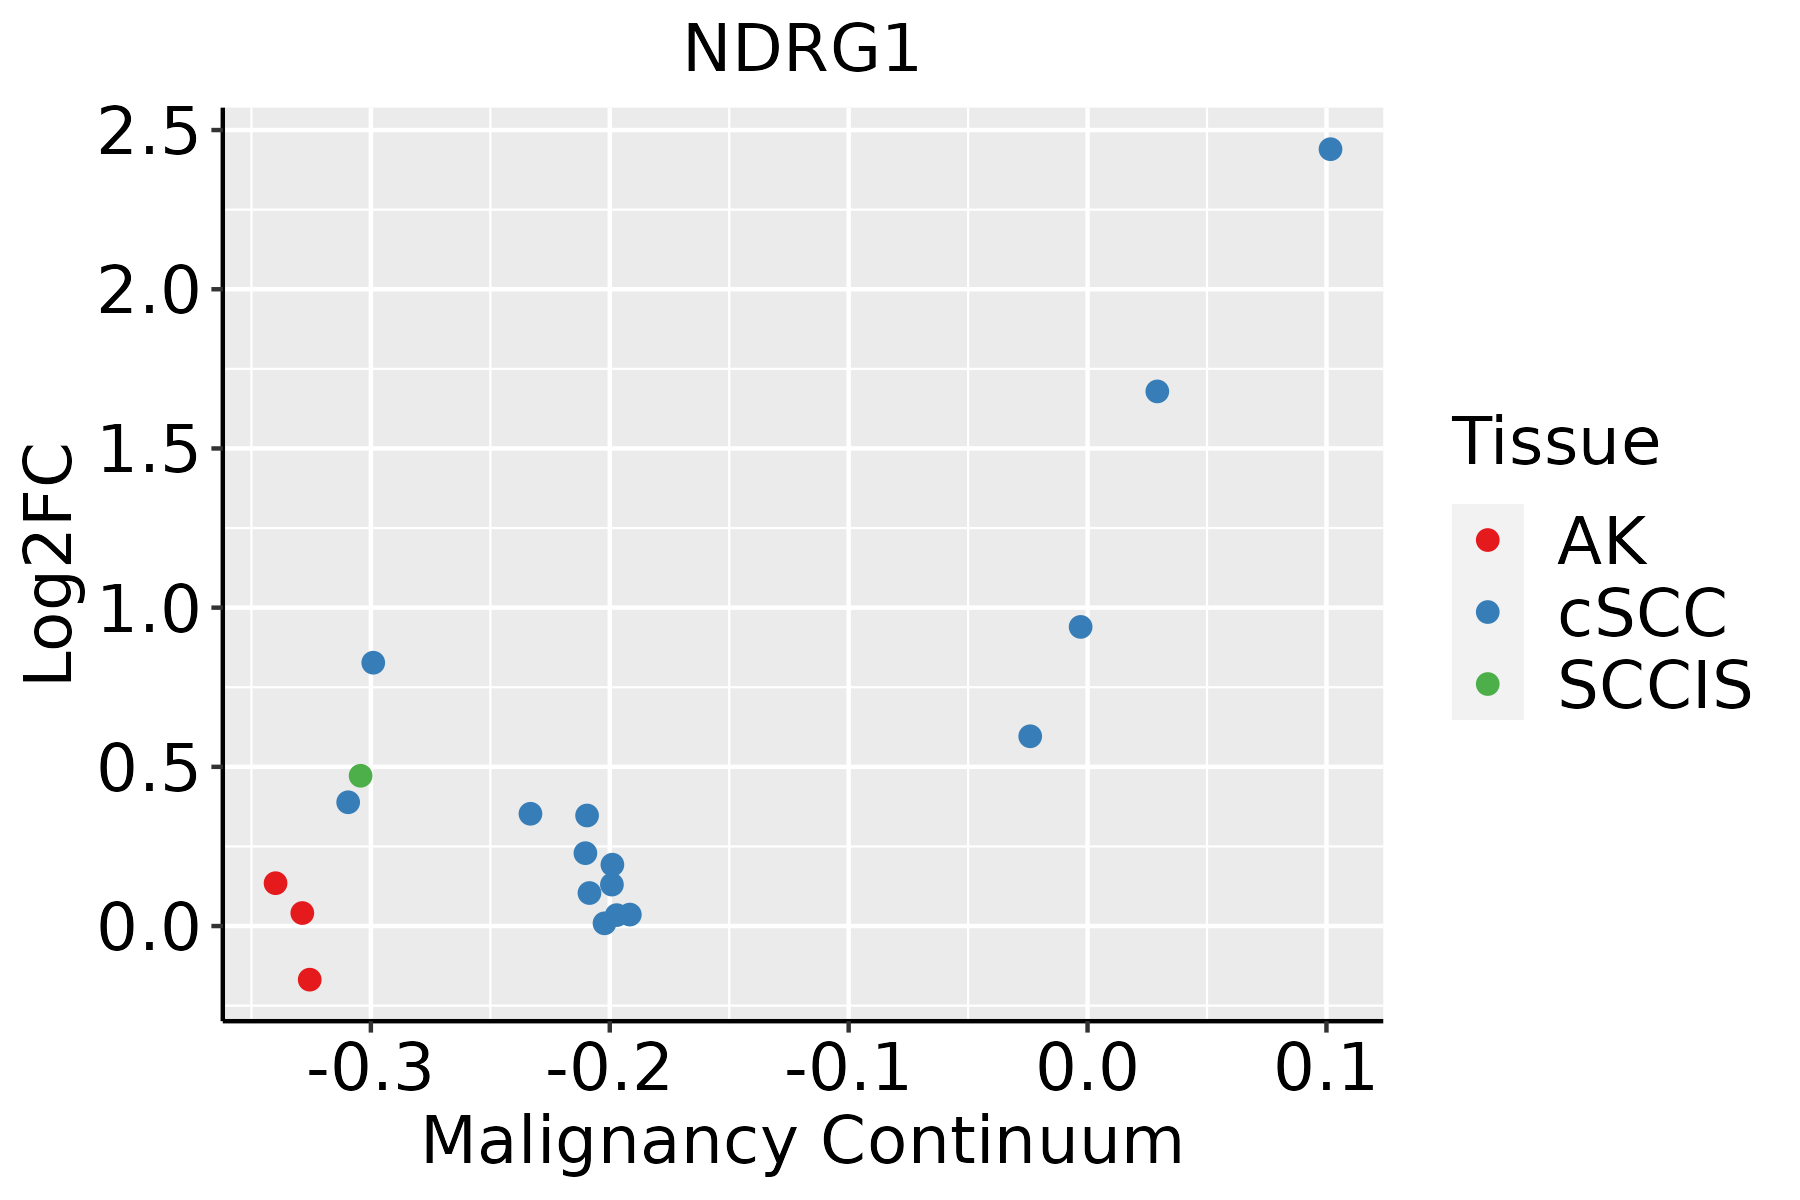 | AK: Actinic keratosis |
| cSCC: Cutaneous squamous cell carcinoma | ||
| SCCIS:squamous cell carcinoma in situ | ||
| Thyroid |  | ATC: Anaplastic thyroid cancer |
| HT: Hashimoto's thyroiditis | ||
| PTC: Papillary thyroid cancer |
| ∗log2FC in expression of this searched gene in stem-like cells from each diseased tissue sample relative to stem-like cells in normal samples in each tissue plotted against the malignancy continuum. Samples are colored based on if they are from different disease stage. |
Top |
Malignant transformation related pathway analysis |
| Find out the enriched GO biological processes and KEGG pathways involved in transition from healthy to precancer to cancer |
| Tissue | Disease Stage | Enriched GO biological Processes |
| Colorectum | AD |  |
| Colorectum | SER |  |
| Colorectum | MSS |  |
| Colorectum | MSI-H |  |
| Colorectum | FAP |  |
| ∗Top 15 enriched GO BP terms are showed in the bar plot of each disease state in each tissue. Each row represents a significant GO biological process which is colored according to the -log10(p.adjust). |
| Page: 1 2 3 4 5 6 7 8 9 |
| GO ID | Tissue | Disease Stage | Description | Gene Ratio | Bg Ratio | pvalue | p.adjust | Count |
| GO:00362939 | Breast | Precancer | response to decreased oxygen levels | 53/1080 | 322/18723 | 4.09e-12 | 6.84e-10 | 53 |
| GO:00016669 | Breast | Precancer | response to hypoxia | 51/1080 | 307/18723 | 7.33e-12 | 1.11e-09 | 51 |
| GO:00704829 | Breast | Precancer | response to oxygen levels | 55/1080 | 347/18723 | 7.47e-12 | 1.11e-09 | 55 |
| GO:00362948 | Breast | Precancer | cellular response to decreased oxygen levels | 31/1080 | 161/18723 | 2.61e-09 | 2.11e-07 | 31 |
| GO:00714538 | Breast | Precancer | cellular response to oxygen levels | 32/1080 | 177/18723 | 7.32e-09 | 5.52e-07 | 32 |
| GO:00714565 | Breast | Precancer | cellular response to hypoxia | 29/1080 | 151/18723 | 8.98e-09 | 6.50e-07 | 29 |
| GO:00100389 | Breast | Precancer | response to metal ion | 47/1080 | 373/18723 | 3.88e-07 | 1.79e-05 | 47 |
| GO:00723319 | Breast | Precancer | signal transduction by p53 class mediator | 26/1080 | 163/18723 | 2.23e-06 | 7.76e-05 | 26 |
| GO:00420633 | Breast | Precancer | gliogenesis | 33/1080 | 301/18723 | 3.06e-04 | 4.40e-03 | 33 |
| GO:00100013 | Breast | Precancer | glial cell differentiation | 25/1080 | 225/18723 | 1.29e-03 | 1.37e-02 | 25 |
| GO:00303309 | Breast | Precancer | DNA damage response, signal transduction by p53 class mediator | 11/1080 | 72/18723 | 2.65e-03 | 2.36e-02 | 11 |
| GO:0021782 | Breast | Precancer | glial cell development | 14/1080 | 116/18723 | 6.92e-03 | 4.67e-02 | 14 |
| GO:007048214 | Breast | IDC | response to oxygen levels | 64/1434 | 347/18723 | 3.45e-11 | 5.57e-09 | 64 |
| GO:003629314 | Breast | IDC | response to decreased oxygen levels | 60/1434 | 322/18723 | 9.26e-11 | 1.25e-08 | 60 |
| GO:000166614 | Breast | IDC | response to hypoxia | 58/1434 | 307/18723 | 1.09e-10 | 1.38e-08 | 58 |
| GO:001003814 | Breast | IDC | response to metal ion | 65/1434 | 373/18723 | 2.95e-10 | 3.42e-08 | 65 |
| GO:003629413 | Breast | IDC | cellular response to decreased oxygen levels | 34/1434 | 161/18723 | 4.73e-08 | 3.02e-06 | 34 |
| GO:007145613 | Breast | IDC | cellular response to hypoxia | 32/1434 | 151/18723 | 1.07e-07 | 6.26e-06 | 32 |
| GO:007145313 | Breast | IDC | cellular response to oxygen levels | 35/1434 | 177/18723 | 1.68e-07 | 9.10e-06 | 35 |
| GO:007233114 | Breast | IDC | signal transduction by p53 class mediator | 30/1434 | 163/18723 | 5.82e-06 | 1.89e-04 | 30 |
| Page: 1 2 3 4 5 6 7 8 9 10 11 12 13 14 15 16 17 18 19 20 |
| Pathway ID | Tissue | Disease Stage | Description | Gene Ratio | Bg Ratio | pvalue | p.adjust | qvalue | Count |
| Page: 1 |
Top |
Cell-cell communication analysis |
| Identification of potential cell-cell interactions between two cell types and their ligand-receptor pairs for different disease states |
| Ligand | Receptor | LRpair | Pathway | Tissue | Disease Stage |
| Page: 1 |
Top |
Single-cell gene regulatory network inference analysis |
| Find out the significant the regulons (TFs) and the target genes of each regulon across cell types for different disease states |
| TF | Cell Type | Tissue | Disease Stage | Target Gene | RSS | Regulon Activity |
| ∗The dot plots of a searched regulon are shown for all cell subpopulations in each disease state of each tissue based on the regulon specific score inferred using pySCENIC and by calculating the average expression. |
| Page: 1 |
Top |
Somatic mutation of malignant transformation related genes |
| Annotation of somatic variants for genes involved in malignant transformation |
| Hugo Symbol | Variant Class | Variant Classification | dbSNP RS | HGVSc | HGVSp | HGVSp Short | SWISSPROT | BIOTYPE | SIFT | PolyPhen | Tumor Sample Barcode | Tissue | Histology | Sex | Age | Stage | Therapy Types | Drugs | Outcome |
| NDRG1 | SNV | Missense_Mutation | rs779194865 | c.563C>T | p.Pro188Leu | p.P188L | Q92597 | protein_coding | tolerated(0.16) | probably_damaging(1) | TCGA-C8-A27B-01 | Breast | breast invasive carcinoma | Female | <65 | I/II | Chemotherapy | 5-fluorouracil | CR |
| NDRG1 | SNV | Missense_Mutation | c.734N>C | p.Gly245Ala | p.G245A | Q92597 | protein_coding | tolerated(0.13) | benign(0.15) | TCGA-D8-A147-01 | Breast | breast invasive carcinoma | Female | <65 | I/II | Chemotherapy | doxorubicine | SD | |
| NDRG1 | SNV | Missense_Mutation | rs780329667 | c.196G>A | p.Gly66Ser | p.G66S | Q92597 | protein_coding | deleterious(0.02) | probably_damaging(1) | TCGA-C5-A3HL-01 | Cervix | cervical & endocervical cancer | Female | >=65 | I/II | Unknown | Unknown | SD |
| NDRG1 | SNV | Missense_Mutation | c.226N>A | p.Leu76Ile | p.L76I | Q92597 | protein_coding | tolerated(0.07) | probably_damaging(0.914) | TCGA-AA-3492-01 | Colorectum | colon adenocarcinoma | Female | >=65 | I/II | Unknown | Unknown | SD | |
| NDRG1 | SNV | Missense_Mutation | rs748331213 | c.704N>A | p.Arg235His | p.R235H | Q92597 | protein_coding | deleterious(0.01) | probably_damaging(0.939) | TCGA-AA-3811-01 | Colorectum | colon adenocarcinoma | Female | >=65 | III/IV | Unknown | Unknown | PD |
| NDRG1 | SNV | Missense_Mutation | c.506N>T | p.Ala169Val | p.A169V | Q92597 | protein_coding | deleterious(0) | probably_damaging(0.972) | TCGA-DM-A1D4-01 | Colorectum | colon adenocarcinoma | Male | >=65 | I/II | Unknown | Unknown | PD | |
| NDRG1 | SNV | Missense_Mutation | c.635G>A | p.Arg212His | p.R212H | Q92597 | protein_coding | deleterious(0.02) | probably_damaging(0.943) | TCGA-G4-6628-01 | Colorectum | colon adenocarcinoma | Male | >=65 | I/II | Unknown | Unknown | SD | |
| NDRG1 | SNV | Missense_Mutation | c.979C>T | p.Arg327Cys | p.R327C | Q92597 | protein_coding | deleterious(0) | possibly_damaging(0.863) | TCGA-NH-A5IV-01 | Colorectum | colon adenocarcinoma | Female | >=65 | I/II | Unknown | Unknown | SD | |
| NDRG1 | SNV | Missense_Mutation | c.112N>A | p.Glu38Lys | p.E38K | Q92597 | protein_coding | deleterious(0) | possibly_damaging(0.81) | TCGA-F5-6814-01 | Colorectum | rectum adenocarcinoma | Male | <65 | I/II | Unknown | Unknown | SD | |
| NDRG1 | SNV | Missense_Mutation | novel | c.910N>A | p.Ala304Thr | p.A304T | Q92597 | protein_coding | deleterious(0.01) | probably_damaging(1) | TCGA-AJ-A3EK-01 | Endometrium | uterine corpus endometrioid carcinoma | Female | <65 | I/II | Chemotherapy | carboplatin | CR |
| Page: 1 2 3 4 5 |
Top |
Related drugs of malignant transformation related genes |
| Identification of chemicals and drugs interact with genes involved in malignant transfromation |
| (DGIdb 4.0) |
| Entrez ID | Symbol | Category | Interaction Types | Drug Claim Name | Drug Name | PMIDs |
| Page: 1 |

Copyright 2023-Present -The University of Texas Health Science Center at Houston |