
|
|||||
|
 | |
| |
| |
| |
| |
| |
|
Gene: NARS2 |
Gene summary for NARS2 |
| Gene information | Species | Human | Gene symbol | NARS2 | Gene ID | 79731 |
| Gene name | asparaginyl-tRNA synthetase 2, mitochondrial | |
| Gene Alias | DFNB94 | |
| Cytomap | 11q14.1 | |
| Gene Type | protein-coding | GO ID | GO:0006082 | UniProtAcc | B3KPX5 |
Top |
Malignant transformation analysis |
| Identification of the aberrant gene expression in precancerous and cancerous lesions by comparing the gene expression of stem-like cells in diseased tissues with normal stem cells |
| Entrez ID | Symbol | Replicates | Species | Organ | Tissue | Adj P-value | Log2FC | Malignancy |
| 79731 | NARS2 | P27T-E | Human | Esophagus | ESCC | 1.67e-11 | 2.24e-01 | 0.1055 |
| 79731 | NARS2 | P28T-E | Human | Esophagus | ESCC | 7.07e-09 | 2.06e-01 | 0.1149 |
| 79731 | NARS2 | P30T-E | Human | Esophagus | ESCC | 2.09e-11 | 5.16e-01 | 0.137 |
| 79731 | NARS2 | P31T-E | Human | Esophagus | ESCC | 8.68e-17 | 3.27e-01 | 0.1251 |
| 79731 | NARS2 | P32T-E | Human | Esophagus | ESCC | 4.88e-08 | 1.37e-01 | 0.1666 |
| 79731 | NARS2 | P36T-E | Human | Esophagus | ESCC | 4.38e-08 | 2.14e-01 | 0.1187 |
| 79731 | NARS2 | P37T-E | Human | Esophagus | ESCC | 4.33e-06 | 1.27e-01 | 0.1371 |
| 79731 | NARS2 | P39T-E | Human | Esophagus | ESCC | 9.08e-03 | 8.76e-02 | 0.0894 |
| 79731 | NARS2 | P40T-E | Human | Esophagus | ESCC | 4.57e-02 | 1.30e-01 | 0.109 |
| 79731 | NARS2 | P42T-E | Human | Esophagus | ESCC | 3.89e-07 | 2.57e-01 | 0.1175 |
| 79731 | NARS2 | P44T-E | Human | Esophagus | ESCC | 5.40e-03 | 8.87e-02 | 0.1096 |
| 79731 | NARS2 | P47T-E | Human | Esophagus | ESCC | 1.65e-03 | 1.07e-01 | 0.1067 |
| 79731 | NARS2 | P48T-E | Human | Esophagus | ESCC | 2.67e-07 | 6.97e-02 | 0.0959 |
| 79731 | NARS2 | P49T-E | Human | Esophagus | ESCC | 4.21e-07 | 6.41e-01 | 0.1768 |
| 79731 | NARS2 | P52T-E | Human | Esophagus | ESCC | 2.08e-06 | 1.03e-01 | 0.1555 |
| 79731 | NARS2 | P54T-E | Human | Esophagus | ESCC | 2.36e-74 | 1.65e+00 | 0.0975 |
| 79731 | NARS2 | P56T-E | Human | Esophagus | ESCC | 4.69e-03 | 4.23e-01 | 0.1613 |
| 79731 | NARS2 | P57T-E | Human | Esophagus | ESCC | 2.50e-09 | 1.61e-01 | 0.0926 |
| 79731 | NARS2 | P61T-E | Human | Esophagus | ESCC | 1.91e-05 | 8.35e-02 | 0.099 |
| 79731 | NARS2 | P62T-E | Human | Esophagus | ESCC | 6.39e-23 | 4.25e-01 | 0.1302 |
| Page: 1 2 3 4 |
| Tissue | Expression Dynamics | Abbreviation |
| Esophagus | 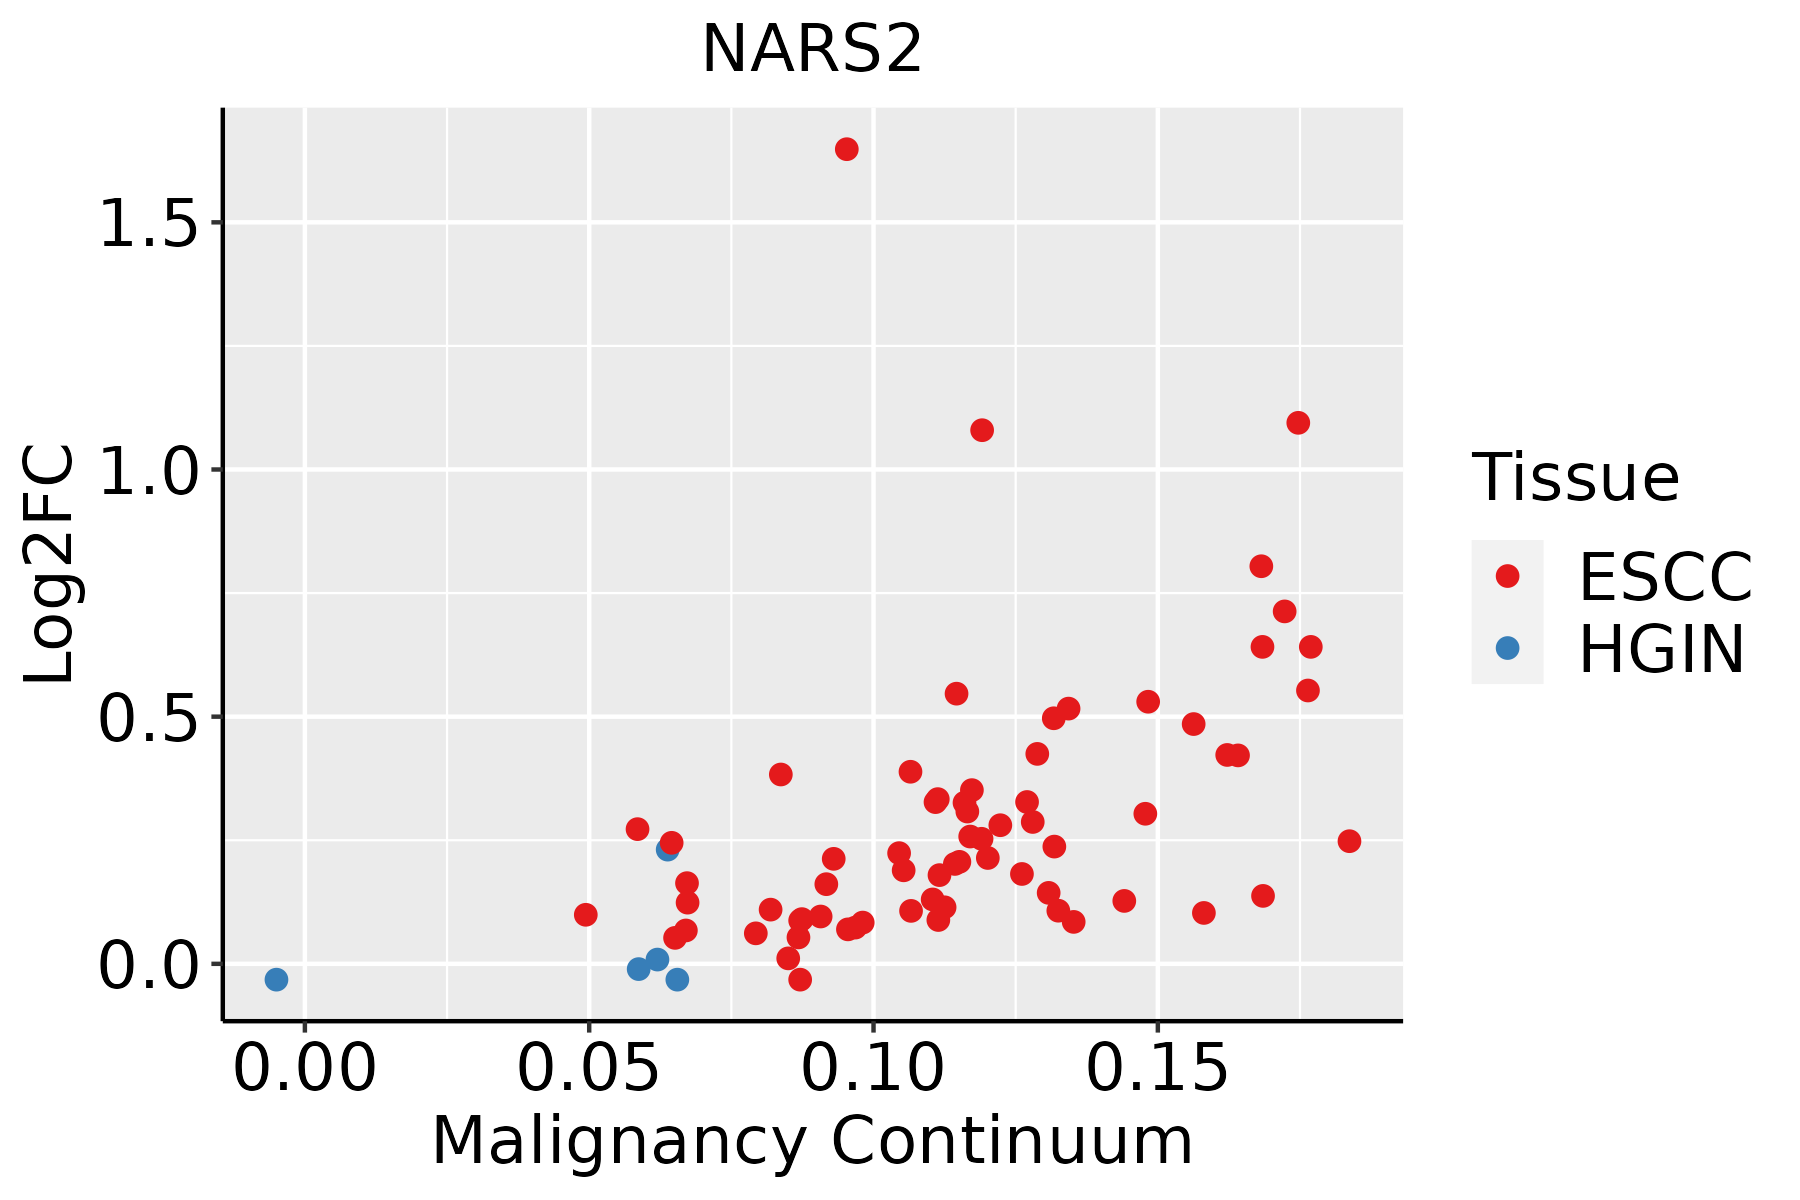 | ESCC: Esophageal squamous cell carcinoma |
| HGIN: High-grade intraepithelial neoplasias | ||
| LGIN: Low-grade intraepithelial neoplasias | ||
| Liver |  | HCC: Hepatocellular carcinoma |
| NAFLD: Non-alcoholic fatty liver disease | ||
| Oral Cavity | 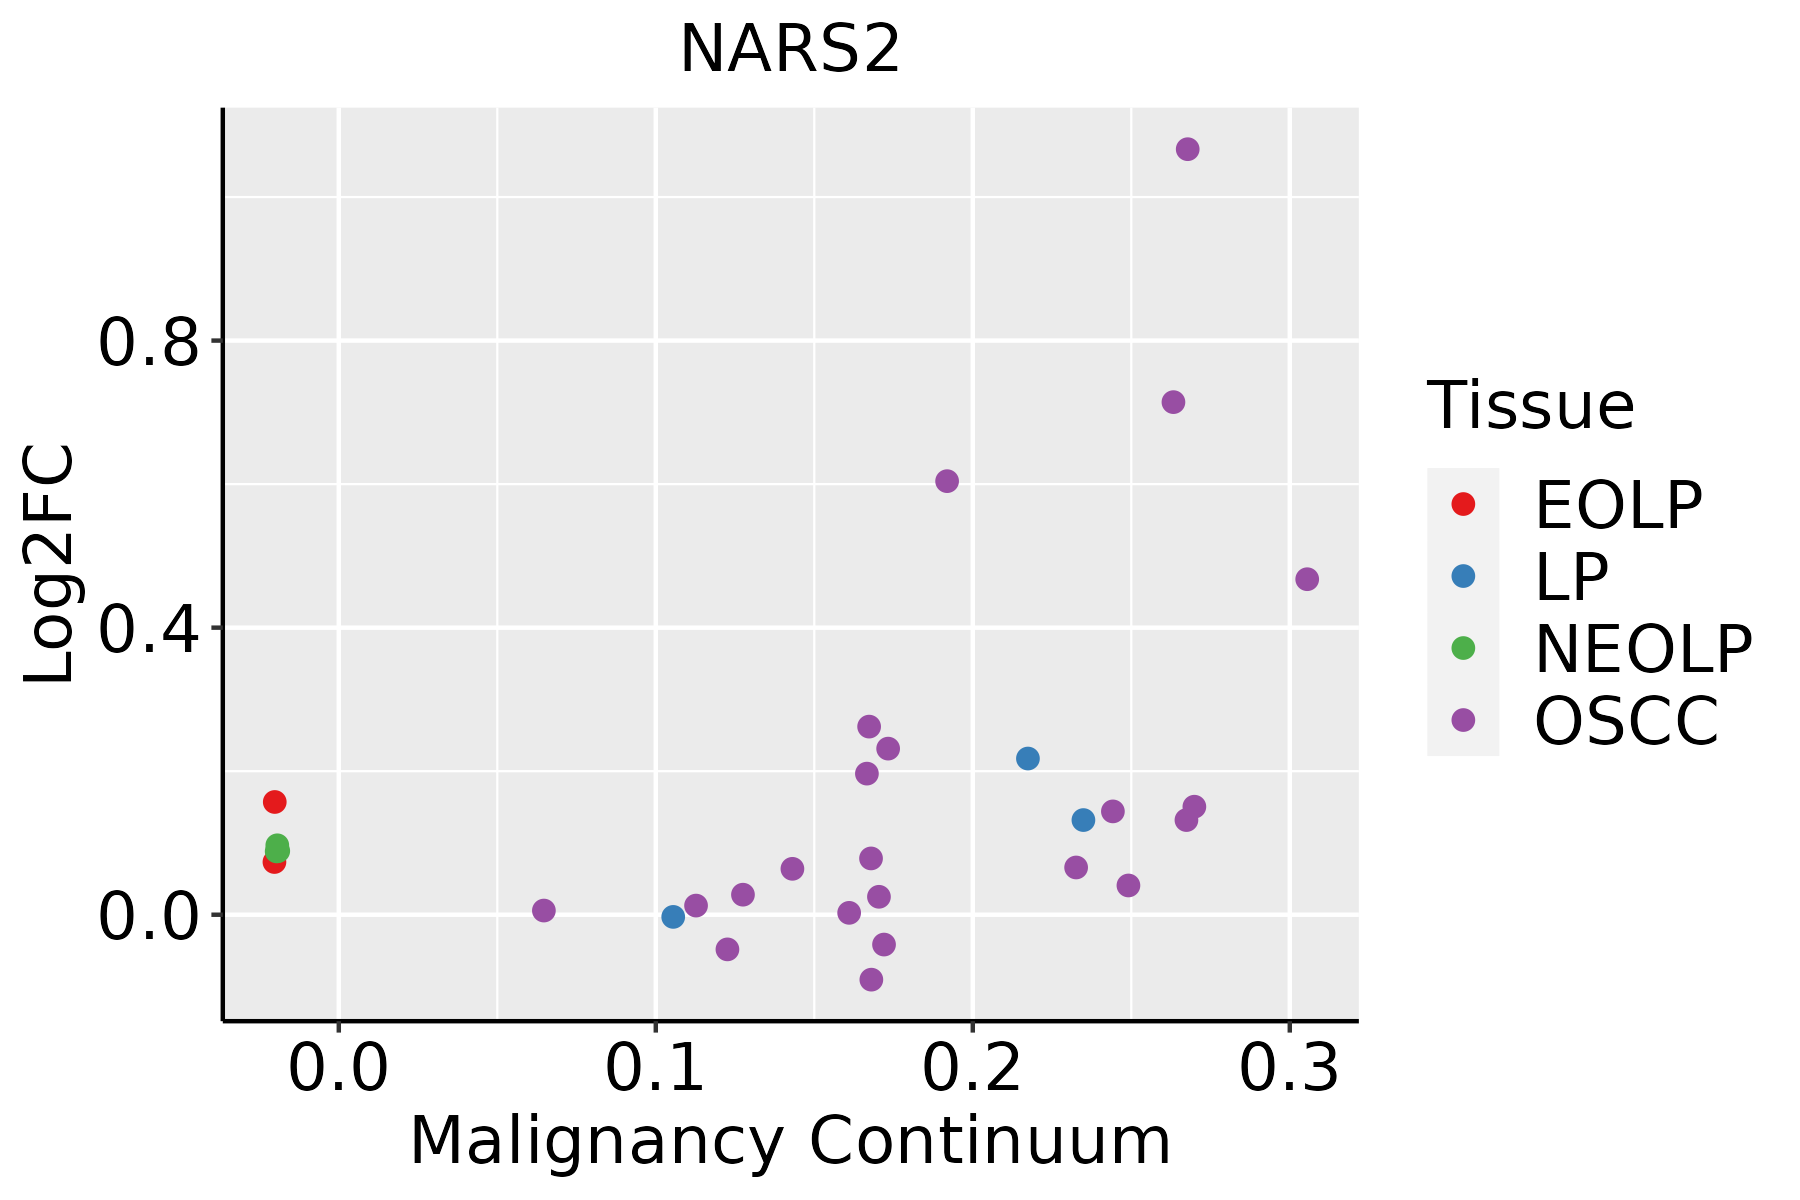 | EOLP: Erosive Oral lichen planus |
| LP: leukoplakia | ||
| NEOLP: Non-erosive oral lichen planus | ||
| OSCC: Oral squamous cell carcinoma |
| ∗log2FC in expression of this searched gene in stem-like cells from each diseased tissue sample relative to stem-like cells in normal samples in each tissue plotted against the malignancy continuum. Samples are colored based on if they are from different disease stage. |
Top |
Malignant transformation related pathway analysis |
| Find out the enriched GO biological processes and KEGG pathways involved in transition from healthy to precancer to cancer |
| Tissue | Disease Stage | Enriched GO biological Processes |
| Colorectum | AD |  |
| Colorectum | SER |  |
| Colorectum | MSS |  |
| Colorectum | MSI-H |  |
| Colorectum | FAP |  |
| ∗Top 15 enriched GO BP terms are showed in the bar plot of each disease state in each tissue. Each row represents a significant GO biological process which is colored according to the -log10(p.adjust). |
| Page: 1 2 3 4 5 6 7 8 9 |
| GO ID | Tissue | Disease Stage | Description | Gene Ratio | Bg Ratio | pvalue | p.adjust | Count |
| GO:003466012 | Esophagus | ESCC | ncRNA metabolic process | 346/8552 | 485/18723 | 4.35e-31 | 2.51e-28 | 346 |
| GO:00063992 | Esophagus | ESCC | tRNA metabolic process | 122/8552 | 179/18723 | 9.03e-10 | 2.19e-08 | 122 |
| GO:00346601 | Liver | HCC | ncRNA metabolic process | 332/7958 | 485/18723 | 1.48e-31 | 7.80e-29 | 332 |
| GO:00065202 | Liver | HCC | cellular amino acid metabolic process | 167/7958 | 284/18723 | 1.91e-08 | 4.56e-07 | 167 |
| GO:0006399 | Liver | HCC | tRNA metabolic process | 108/7958 | 179/18723 | 1.07e-06 | 1.59e-05 | 108 |
| GO:00346605 | Oral cavity | OSCC | ncRNA metabolic process | 296/7305 | 485/18723 | 2.94e-23 | 6.65e-21 | 296 |
| GO:00063991 | Oral cavity | OSCC | tRNA metabolic process | 101/7305 | 179/18723 | 1.65e-06 | 2.15e-05 | 101 |
| Page: 1 |
| Pathway ID | Tissue | Disease Stage | Description | Gene Ratio | Bg Ratio | pvalue | p.adjust | qvalue | Count |
| Page: 1 |
Top |
Cell-cell communication analysis |
| Identification of potential cell-cell interactions between two cell types and their ligand-receptor pairs for different disease states |
| Ligand | Receptor | LRpair | Pathway | Tissue | Disease Stage |
| Page: 1 |
Top |
Single-cell gene regulatory network inference analysis |
| Find out the significant the regulons (TFs) and the target genes of each regulon across cell types for different disease states |
| TF | Cell Type | Tissue | Disease Stage | Target Gene | RSS | Regulon Activity |
| ∗The dot plots of a searched regulon are shown for all cell subpopulations in each disease state of each tissue based on the regulon specific score inferred using pySCENIC and by calculating the average expression. |
| Page: 1 |
Top |
Somatic mutation of malignant transformation related genes |
| Annotation of somatic variants for genes involved in malignant transformation |
| Hugo Symbol | Variant Class | Variant Classification | dbSNP RS | HGVSc | HGVSp | HGVSp Short | SWISSPROT | BIOTYPE | SIFT | PolyPhen | Tumor Sample Barcode | Tissue | Histology | Sex | Age | Stage | Therapy Types | Drugs | Outcome |
| NARS2 | SNV | Missense_Mutation | c.719C>G | p.Pro240Arg | p.P240R | Q96I59 | protein_coding | deleterious(0) | probably_damaging(0.988) | TCGA-A2-A0EW-01 | Breast | breast invasive carcinoma | Female | <65 | III/IV | Chemotherapy | adriamycin | PD | |
| NARS2 | SNV | Missense_Mutation | rs535877562 | c.1253G>A | p.Arg418His | p.R418H | Q96I59 | protein_coding | deleterious(0) | possibly_damaging(0.852) | TCGA-A2-A0YJ-01 | Breast | breast invasive carcinoma | Female | <65 | III/IV | Chemotherapy | cytoxan | PD |
| NARS2 | SNV | Missense_Mutation | c.444N>T | p.Arg148Ser | p.R148S | Q96I59 | protein_coding | deleterious(0) | probably_damaging(1) | TCGA-A8-A06X-01 | Breast | breast invasive carcinoma | Female | >=65 | I/II | Unknown | Unknown | SD | |
| NARS2 | SNV | Missense_Mutation | novel | c.1348G>A | p.Glu450Lys | p.E450K | Q96I59 | protein_coding | deleterious(0) | probably_damaging(0.999) | TCGA-D8-A73U-01 | Breast | breast invasive carcinoma | Female | >=65 | I/II | Hormone Therapy | tamoxiphen | SD |
| NARS2 | insertion | Frame_Shift_Ins | novel | c.527_528insCC | p.His179PhefsTer5 | p.H179Ffs*5 | Q96I59 | protein_coding | TCGA-5T-A9QA-01 | Breast | breast invasive carcinoma | Female | <65 | I/II | Chemotherapy | taxol | SD | ||
| NARS2 | insertion | Frame_Shift_Ins | novel | c.526_527insGGAGTTGGCTGCAGGGCGTACACTTTTCTCTGTGT | p.Val176GlyfsTer19 | p.V176Gfs*19 | Q96I59 | protein_coding | TCGA-5T-A9QA-01 | Breast | breast invasive carcinoma | Female | <65 | I/II | Chemotherapy | taxol | SD | ||
| NARS2 | insertion | Nonsense_Mutation | novel | c.307_308insATAGGTAATTTTAAAATTGAACACCAGCCTTG | p.Ser103TyrfsTer3 | p.S103Yfs*3 | Q96I59 | protein_coding | TCGA-A2-A0CP-01 | Breast | breast invasive carcinoma | Female | <65 | I/II | Chemotherapy | cytoxan | SD | ||
| NARS2 | insertion | Nonsense_Mutation | novel | c.121_122insACATCTCTAAATAATGTTTCATCAGCTCTAAAATGATAAC | p.Gly41AspfsTer5 | p.G41Dfs*5 | Q96I59 | protein_coding | TCGA-A8-A07J-01 | Breast | breast invasive carcinoma | Female | <65 | I/II | Chemotherapy | 5-fluorouracil | CR | ||
| NARS2 | insertion | Nonsense_Mutation | novel | c.96_97insTCATAGTCTACAAATGTTAGCTGCTATTGTTTCTCTTGCTGATT | p.Ala33SerfsTer2 | p.A33Sfs*2 | Q96I59 | protein_coding | TCGA-A8-A07R-01 | Breast | breast invasive carcinoma | Female | >=65 | III/IV | Ancillary | zoledronic | SD | ||
| NARS2 | SNV | Missense_Mutation | rs372086134 | c.544N>G | p.Ile182Val | p.I182V | Q96I59 | protein_coding | tolerated(0.24) | benign(0.009) | TCGA-EA-A4BA-01 | Cervix | cervical & endocervical cancer | Female | <65 | I/II | Chemotherapy | carboplatin | CR |
| Page: 1 2 3 4 5 6 7 8 |
Top |
Related drugs of malignant transformation related genes |
| Identification of chemicals and drugs interact with genes involved in malignant transfromation |
| (DGIdb 4.0) |
| Entrez ID | Symbol | Category | Interaction Types | Drug Claim Name | Drug Name | PMIDs |
| Page: 1 |

Copyright 2023-Present -The University of Texas Health Science Center at Houston |