
|
|||||
|
 | |
| |
| |
| |
| |
| |
|
Gene: MYBL2 |
Gene summary for MYBL2 |
| Gene information | Species | Human | Gene symbol | MYBL2 | Gene ID | 4605 |
| Gene name | MYB proto-oncogene like 2 | |
| Gene Alias | B-MYB | |
| Cytomap | 20q13.12 | |
| Gene Type | protein-coding | GO ID | GO:0000226 | UniProtAcc | P10244 |
Top |
Malignant transformation analysis |
| Identification of the aberrant gene expression in precancerous and cancerous lesions by comparing the gene expression of stem-like cells in diseased tissues with normal stem cells |
| Entrez ID | Symbol | Replicates | Species | Organ | Tissue | Adj P-value | Log2FC | Malignancy |
| 4605 | MYBL2 | P65T-E | Human | Esophagus | ESCC | 2.06e-03 | 1.45e-01 | 0.0978 |
| 4605 | MYBL2 | P74T-E | Human | Esophagus | ESCC | 2.66e-02 | 2.09e-01 | 0.1479 |
| 4605 | MYBL2 | P75T-E | Human | Esophagus | ESCC | 2.02e-06 | 2.71e-01 | 0.1125 |
| 4605 | MYBL2 | P76T-E | Human | Esophagus | ESCC | 2.03e-09 | 4.13e-01 | 0.1207 |
| 4605 | MYBL2 | P79T-E | Human | Esophagus | ESCC | 1.76e-12 | 4.13e-01 | 0.1154 |
| 4605 | MYBL2 | P80T-E | Human | Esophagus | ESCC | 1.26e-02 | 2.19e-01 | 0.155 |
| 4605 | MYBL2 | P83T-E | Human | Esophagus | ESCC | 3.38e-25 | 9.21e-01 | 0.1738 |
| 4605 | MYBL2 | P89T-E | Human | Esophagus | ESCC | 6.22e-10 | 5.44e-01 | 0.1752 |
| 4605 | MYBL2 | P91T-E | Human | Esophagus | ESCC | 1.03e-13 | 1.76e+00 | 0.1828 |
| 4605 | MYBL2 | P107T-E | Human | Esophagus | ESCC | 1.56e-19 | 5.40e-01 | 0.171 |
| 4605 | MYBL2 | P130T-E | Human | Esophagus | ESCC | 6.38e-31 | 8.03e-01 | 0.1676 |
| 4605 | MYBL2 | HCC1_Meng | Human | Liver | HCC | 2.13e-22 | 6.38e-02 | 0.0246 |
| 4605 | MYBL2 | S014 | Human | Liver | HCC | 2.85e-11 | 6.98e-01 | 0.2254 |
| 4605 | MYBL2 | S016 | Human | Liver | HCC | 9.52e-06 | 3.93e-01 | 0.2243 |
| 4605 | MYBL2 | S028 | Human | Liver | HCC | 2.94e-05 | 6.11e-01 | 0.2503 |
| 4605 | MYBL2 | C04 | Human | Oral cavity | OSCC | 1.34e-19 | 1.24e+00 | 0.2633 |
| 4605 | MYBL2 | C21 | Human | Oral cavity | OSCC | 2.32e-17 | 8.69e-01 | 0.2678 |
| 4605 | MYBL2 | C30 | Human | Oral cavity | OSCC | 5.59e-32 | 1.85e+00 | 0.3055 |
| 4605 | MYBL2 | C43 | Human | Oral cavity | OSCC | 7.23e-07 | 2.66e-01 | 0.1704 |
| 4605 | MYBL2 | C46 | Human | Oral cavity | OSCC | 2.58e-07 | 3.79e-01 | 0.1673 |
| Page: 1 2 3 |
| Tissue | Expression Dynamics | Abbreviation |
| Esophagus | 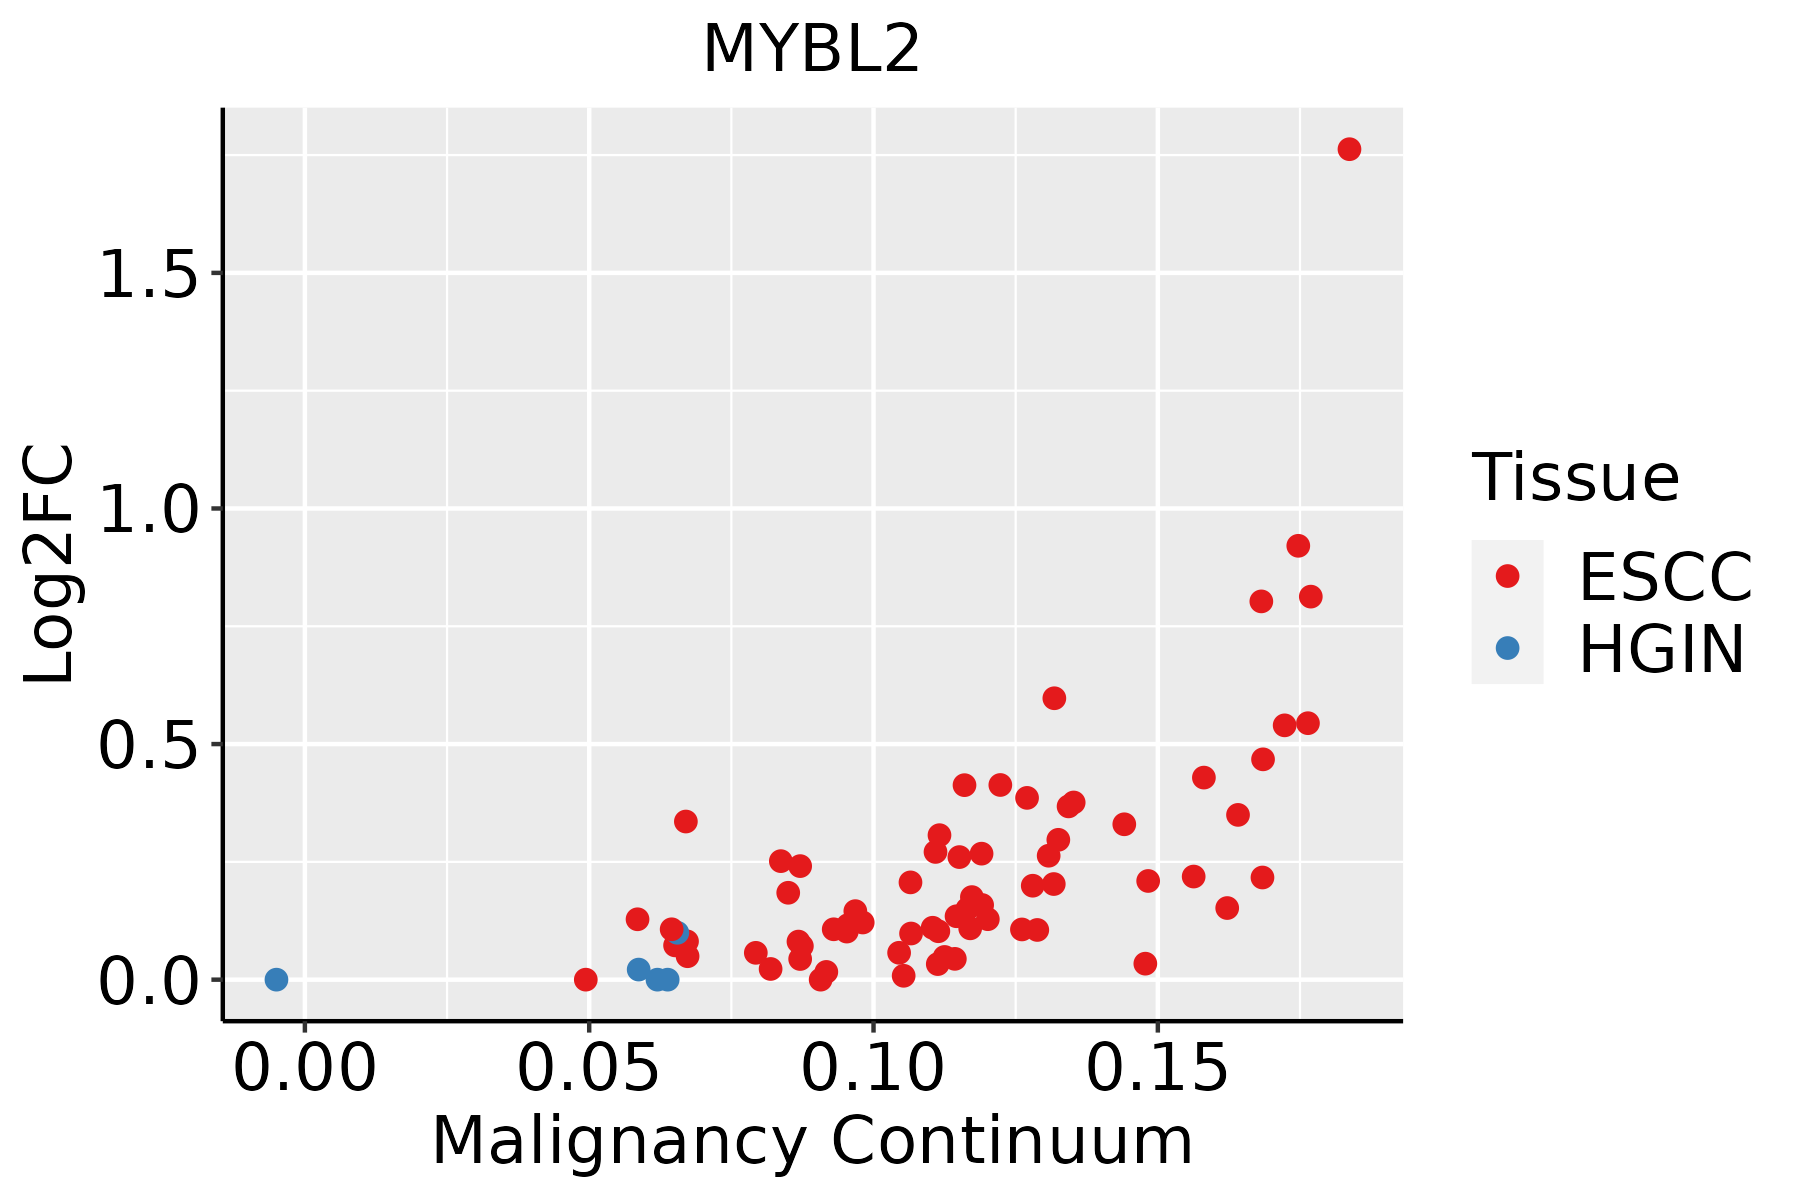 | ESCC: Esophageal squamous cell carcinoma |
| HGIN: High-grade intraepithelial neoplasias | ||
| LGIN: Low-grade intraepithelial neoplasias | ||
| Liver |  | HCC: Hepatocellular carcinoma |
| NAFLD: Non-alcoholic fatty liver disease | ||
| Oral Cavity | 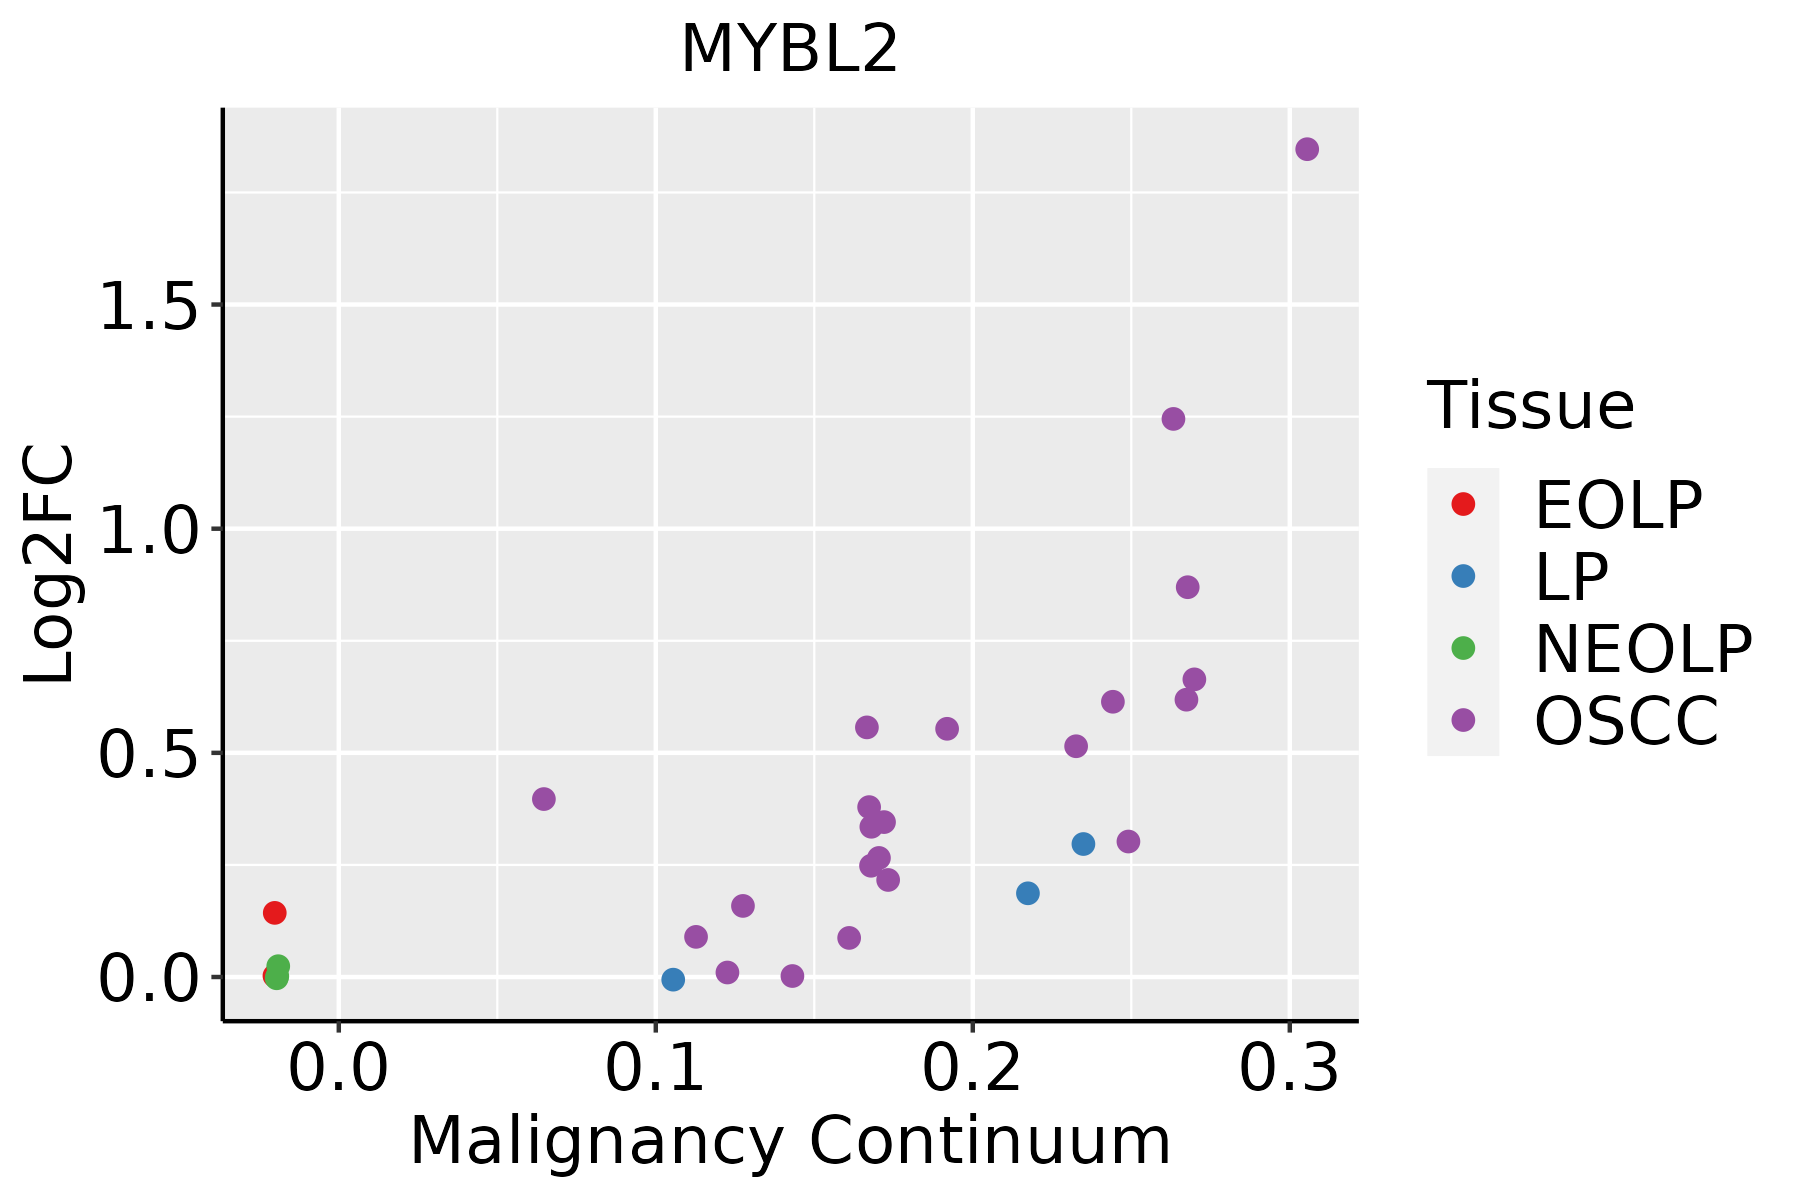 | EOLP: Erosive Oral lichen planus |
| LP: leukoplakia | ||
| NEOLP: Non-erosive oral lichen planus | ||
| OSCC: Oral squamous cell carcinoma | ||
| Skin | 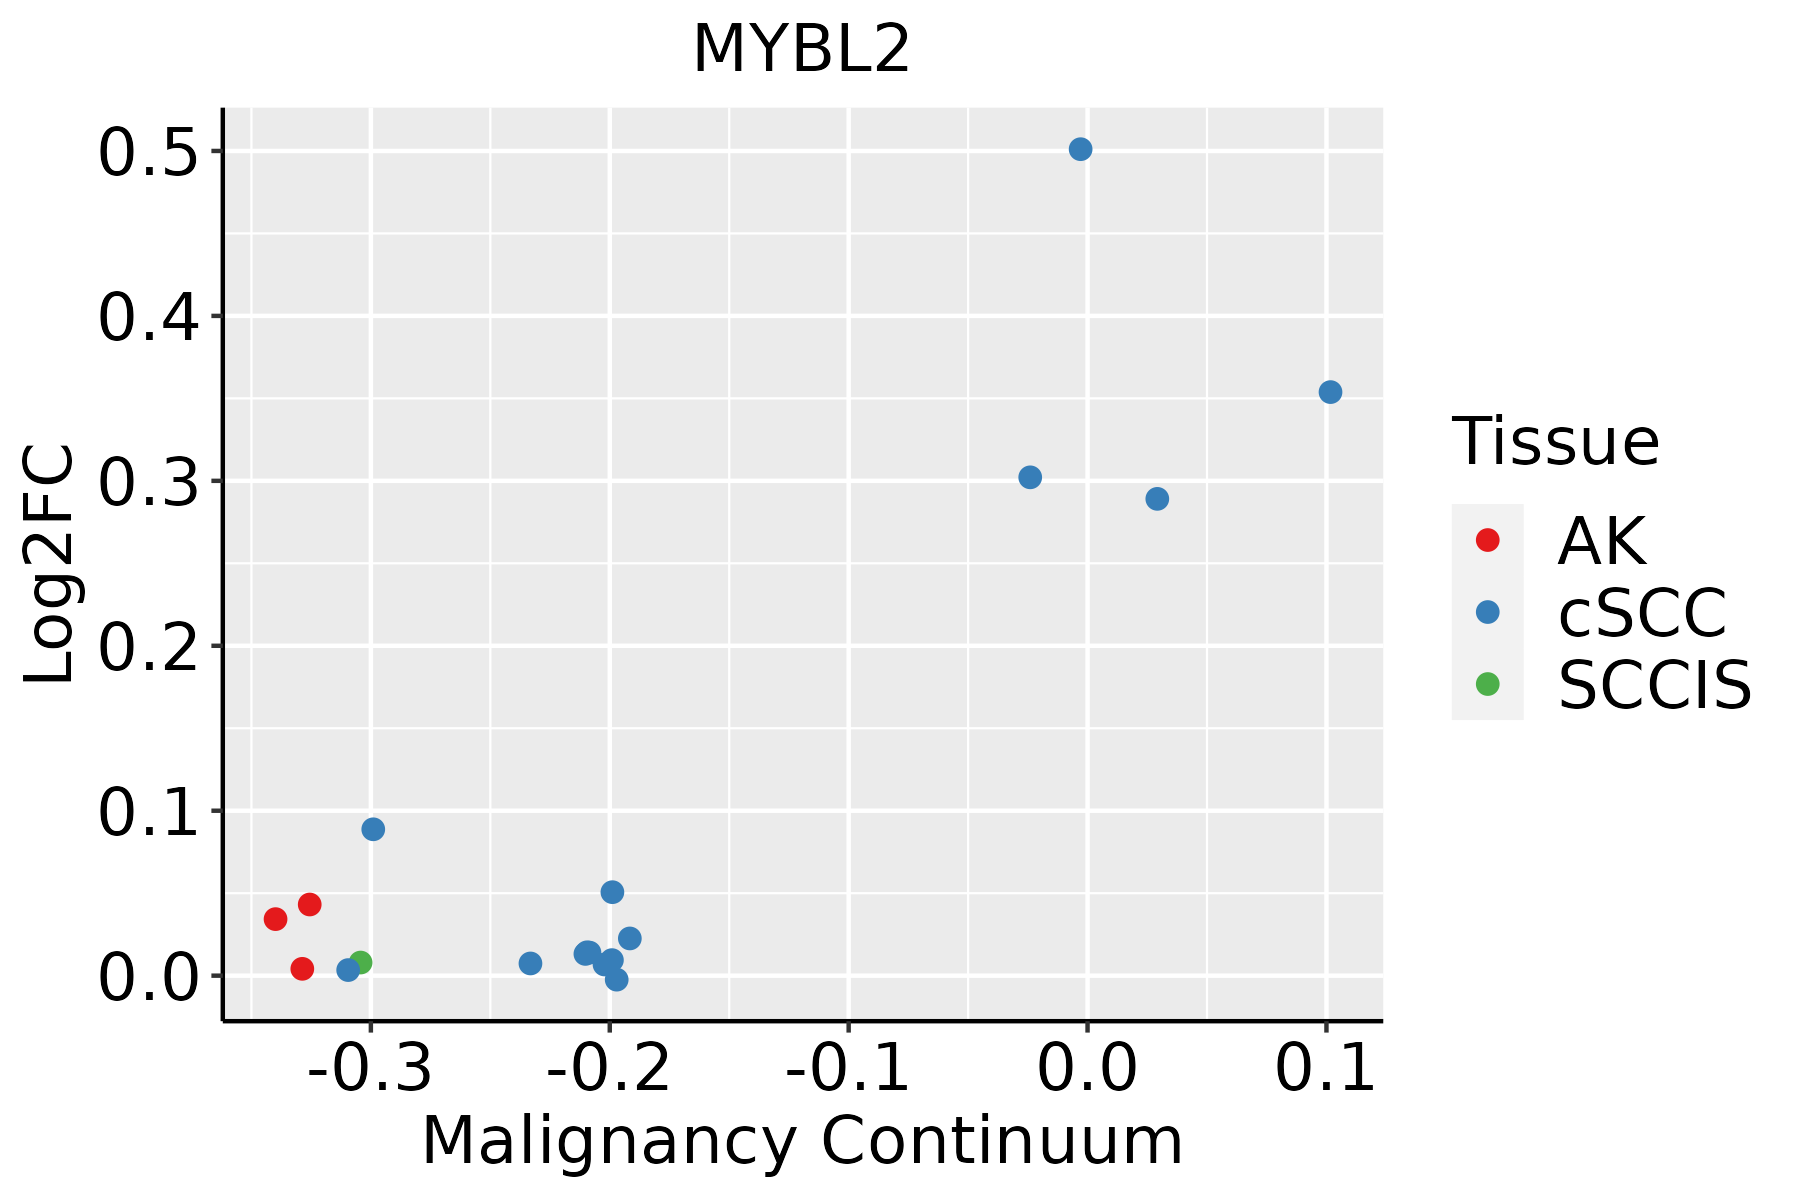 | AK: Actinic keratosis |
| cSCC: Cutaneous squamous cell carcinoma | ||
| SCCIS:squamous cell carcinoma in situ | ||
| Thyroid |  | ATC: Anaplastic thyroid cancer |
| HT: Hashimoto's thyroiditis | ||
| PTC: Papillary thyroid cancer |
| ∗log2FC in expression of this searched gene in stem-like cells from each diseased tissue sample relative to stem-like cells in normal samples in each tissue plotted against the malignancy continuum. Samples are colored based on if they are from different disease stage. |
Top |
Malignant transformation related pathway analysis |
| Find out the enriched GO biological processes and KEGG pathways involved in transition from healthy to precancer to cancer |
| Tissue | Disease Stage | Enriched GO biological Processes |
| Colorectum | AD |  |
| Colorectum | SER |  |
| Colorectum | MSS |  |
| Colorectum | MSI-H |  |
| Colorectum | FAP |  |
| ∗Top 15 enriched GO BP terms are showed in the bar plot of each disease state in each tissue. Each row represents a significant GO biological process which is colored according to the -log10(p.adjust). |
| Page: 1 2 3 4 5 6 7 8 9 |
| GO ID | Tissue | Disease Stage | Description | Gene Ratio | Bg Ratio | pvalue | p.adjust | Count |
| GO:014001414 | Esophagus | ESCC | mitotic nuclear division | 218/8552 | 287/18723 | 6.17e-26 | 1.78e-23 | 218 |
| GO:190285015 | Esophagus | ESCC | microtubule cytoskeleton organization involved in mitosis | 116/8552 | 147/18723 | 1.25e-16 | 9.91e-15 | 116 |
| GO:000705214 | Esophagus | ESCC | mitotic spindle organization | 97/8552 | 120/18723 | 2.17e-15 | 1.33e-13 | 97 |
| GO:000705114 | Esophagus | ESCC | spindle organization | 134/8552 | 184/18723 | 5.70e-14 | 2.87e-12 | 134 |
| GO:00482853 | Esophagus | ESCC | organelle fission | 301/8552 | 488/18723 | 4.64e-13 | 2.12e-11 | 301 |
| GO:00002802 | Esophagus | ESCC | nuclear division | 270/8552 | 439/18723 | 1.17e-11 | 4.24e-10 | 270 |
| GO:00512256 | Esophagus | ESCC | spindle assembly | 85/8552 | 117/18723 | 2.72e-09 | 5.98e-08 | 85 |
| GO:009030715 | Esophagus | ESCC | mitotic spindle assembly | 52/8552 | 65/18723 | 1.41e-08 | 2.77e-07 | 52 |
| GO:0070997111 | Esophagus | ESCC | neuron death | 216/8552 | 361/18723 | 3.49e-08 | 6.45e-07 | 216 |
| GO:0051402110 | Esophagus | ESCC | neuron apoptotic process | 148/8552 | 246/18723 | 3.08e-06 | 3.47e-05 | 148 |
| GO:1901214111 | Esophagus | ESCC | regulation of neuron death | 186/8552 | 319/18723 | 3.35e-06 | 3.73e-05 | 186 |
| GO:1901216111 | Esophagus | ESCC | positive regulation of neuron death | 65/8552 | 97/18723 | 1.76e-05 | 1.56e-04 | 65 |
| GO:0043525110 | Esophagus | ESCC | positive regulation of neuron apoptotic process | 40/8552 | 58/18723 | 2.83e-04 | 1.71e-03 | 40 |
| GO:004352317 | Esophagus | ESCC | regulation of neuron apoptotic process | 122/8552 | 212/18723 | 3.21e-04 | 1.90e-03 | 122 |
| GO:199082316 | Esophagus | ESCC | response to leukemia inhibitory factor | 60/8552 | 95/18723 | 4.41e-04 | 2.48e-03 | 60 |
| GO:199083015 | Esophagus | ESCC | cellular response to leukemia inhibitory factor | 59/8552 | 94/18723 | 6.19e-04 | 3.32e-03 | 59 |
| GO:014001411 | Liver | HCC | mitotic nuclear division | 174/7958 | 287/18723 | 3.74e-10 | 1.23e-08 | 174 |
| GO:000705111 | Liver | HCC | spindle organization | 116/7958 | 184/18723 | 1.40e-08 | 3.40e-07 | 116 |
| GO:000705211 | Liver | HCC | mitotic spindle organization | 80/7958 | 120/18723 | 7.43e-08 | 1.50e-06 | 80 |
| GO:007099722 | Liver | HCC | neuron death | 202/7958 | 361/18723 | 1.44e-07 | 2.70e-06 | 202 |
| Page: 1 2 3 4 |
| Pathway ID | Tissue | Disease Stage | Description | Gene Ratio | Bg Ratio | pvalue | p.adjust | qvalue | Count |
| hsa0421829 | Esophagus | ESCC | Cellular senescence | 119/4205 | 156/8465 | 5.89e-12 | 9.40e-11 | 4.81e-11 | 119 |
| hsa0421838 | Esophagus | ESCC | Cellular senescence | 119/4205 | 156/8465 | 5.89e-12 | 9.40e-11 | 4.81e-11 | 119 |
| hsa0421822 | Liver | HCC | Cellular senescence | 102/4020 | 156/8465 | 4.18e-06 | 3.59e-05 | 2.00e-05 | 102 |
| hsa0421832 | Liver | HCC | Cellular senescence | 102/4020 | 156/8465 | 4.18e-06 | 3.59e-05 | 2.00e-05 | 102 |
| hsa0421820 | Oral cavity | OSCC | Cellular senescence | 112/3704 | 156/8465 | 8.04e-13 | 1.42e-11 | 7.21e-12 | 112 |
| hsa04218110 | Oral cavity | OSCC | Cellular senescence | 112/3704 | 156/8465 | 8.04e-13 | 1.42e-11 | 7.21e-12 | 112 |
| Page: 1 |
Top |
Cell-cell communication analysis |
| Identification of potential cell-cell interactions between two cell types and their ligand-receptor pairs for different disease states |
| Ligand | Receptor | LRpair | Pathway | Tissue | Disease Stage |
| Page: 1 |
Top |
Single-cell gene regulatory network inference analysis |
| Find out the significant the regulons (TFs) and the target genes of each regulon across cell types for different disease states |
| TF | Cell Type | Tissue | Disease Stage | Target Gene | RSS | Regulon Activity |
| MYBL2 | GC | Breast | DCIS | HIST1H4C,HMGB1,DUT, etc. | 2.23e-01 |  |
| MYBL2 | CD8TEX | Breast | IDC | HIST1H4C,HMGB1,DUT, etc. | 7.75e-02 |  |
| MYBL2 | TREG | Cervix | ADJ | LIG1,DUT,DTL, etc. | 6.60e-02 |  |
| MYBL2 | CD8TEREX | Cervix | ADJ | LIG1,DUT,DTL, etc. | -2.22e-16 | |
| MYBL2 | CD8TEREX | Cervix | CC | LIG1,DUT,DTL, etc. | 9.72e-02 |  |
| MYBL2 | DC | Cervix | Healthy | LIG1,DUT,DTL, etc. | 3.08e-02 |  |
| MYBL2 | M2MAC | Cervix | Healthy | LIG1,DUT,DTL, etc. | 2.34e-02 | |
| MYBL2 | CD8TEREX | Cervix | Healthy | LIG1,DUT,DTL, etc. | 1.30e-01 | |
| MYBL2 | CD8TEREX | Cervix | HSIL_HPV | LIG1,DUT,DTL, etc. | 6.78e-02 |  |
| MYBL2 | PLA | Cervix | HSIL_HPV | LIG1,DUT,DTL, etc. | 1.41e-02 | |
| ∗The dot plots of a searched regulon are shown for all cell subpopulations in each disease state of each tissue based on the regulon specific score inferred using pySCENIC and by calculating the average expression. |
| Page: 1 2 3 4 |
Top |
Somatic mutation of malignant transformation related genes |
| Annotation of somatic variants for genes involved in malignant transformation |
| Hugo Symbol | Variant Class | Variant Classification | dbSNP RS | HGVSc | HGVSp | HGVSp Short | SWISSPROT | BIOTYPE | SIFT | PolyPhen | Tumor Sample Barcode | Tissue | Histology | Sex | Age | Stage | Therapy Types | Drugs | Outcome |
| MYBL2 | SNV | Missense_Mutation | novel | c.1849T>C | p.Ser617Pro | p.S617P | P10244 | protein_coding | tolerated(0.22) | benign(0.143) | TCGA-A2-A0D0-01 | Breast | breast invasive carcinoma | Female | <65 | I/II | Chemotherapy | cytoxan | SD |
| MYBL2 | SNV | Missense_Mutation | c.1666N>A | p.Glu556Lys | p.E556K | P10244 | protein_coding | deleterious(0.01) | benign(0.385) | TCGA-A2-A3XY-01 | Breast | breast invasive carcinoma | Female | <65 | I/II | Chemotherapy | adriamycin | PD | |
| MYBL2 | SNV | Missense_Mutation | novel | c.1418T>A | p.Leu473Gln | p.L473Q | P10244 | protein_coding | deleterious(0) | probably_damaging(1) | TCGA-AC-A5XU-01 | Breast | breast invasive carcinoma | Female | >=65 | I/II | Hormone Therapy | letrozole | SD |
| MYBL2 | SNV | Missense_Mutation | novel | c.364N>T | p.Arg122Cys | p.R122C | P10244 | protein_coding | deleterious(0) | probably_damaging(0.938) | TCGA-AN-A046-01 | Breast | breast invasive carcinoma | Female | >=65 | I/II | Unknown | Unknown | SD |
| MYBL2 | SNV | Missense_Mutation | c.1847N>A | p.Ser616Tyr | p.S616Y | P10244 | protein_coding | deleterious(0) | possibly_damaging(0.751) | TCGA-AO-A124-01 | Breast | breast invasive carcinoma | Female | <65 | I/II | Chemotherapy | doxorubicin | SD | |
| MYBL2 | SNV | Missense_Mutation | c.215N>A | p.Arg72Lys | p.R72K | P10244 | protein_coding | deleterious(0.03) | probably_damaging(0.996) | TCGA-BH-A0BF-01 | Breast | breast invasive carcinoma | Female | <65 | I/II | Unknown | Unknown | SD | |
| MYBL2 | insertion | Frame_Shift_Ins | novel | c.1376_1377insGAGCCACTCTCCCACAGTTGGCTTC | p.Phe459LeufsTer102 | p.F459Lfs*102 | P10244 | protein_coding | TCGA-A2-A0T2-01 | Breast | breast invasive carcinoma | Female | >=65 | III/IV | Chemotherapy | xeloda | PD | ||
| MYBL2 | insertion | In_Frame_Ins | novel | c.1304_1305insTATAAAAATATCTGCAGGCTGGGTACTGTGGTT | p.Ser435_Cys436insIleLysIleSerAlaGlyTrpValLeuTrpPhe | p.S435_C436insIKISAGWVLWF | P10244 | protein_coding | TCGA-A8-A097-01 | Breast | breast invasive carcinoma | Female | >=65 | I/II | Hormone Therapy | tamoxiphen | SD | ||
| MYBL2 | insertion | In_Frame_Ins | novel | c.1114_1115insAGTTCGAGACCA | p.Arg372delinsGlnPheGluThrSer | p.R372delinsQFETS | P10244 | protein_coding | TCGA-A8-A09E-01 | Breast | breast invasive carcinoma | Female | >=65 | III/IV | Hormone Therapy | anastrozole | SD | ||
| MYBL2 | deletion | Frame_Shift_Del | novel | c.408delN | p.Cys137AlafsTer36 | p.C137Afs*36 | P10244 | protein_coding | TCGA-EW-A2FV-01 | Breast | breast invasive carcinoma | Female | <65 | III/IV | Chemotherapy | docetaxel | SD |
| Page: 1 2 3 4 5 6 7 8 9 10 |
Top |
Related drugs of malignant transformation related genes |
| Identification of chemicals and drugs interact with genes involved in malignant transfromation |
| (DGIdb 4.0) |
| Entrez ID | Symbol | Category | Interaction Types | Drug Claim Name | Drug Name | PMIDs |
| Page: 1 |

Copyright 2023-Present -The University of Texas Health Science Center at Houston |