| Tissue | Expression Dynamics | Abbreviation |
| Colorectum (GSE201348) |  | FAP: Familial adenomatous polyposis |
| CRC: Colorectal cancer |
| Colorectum (HTA11) | 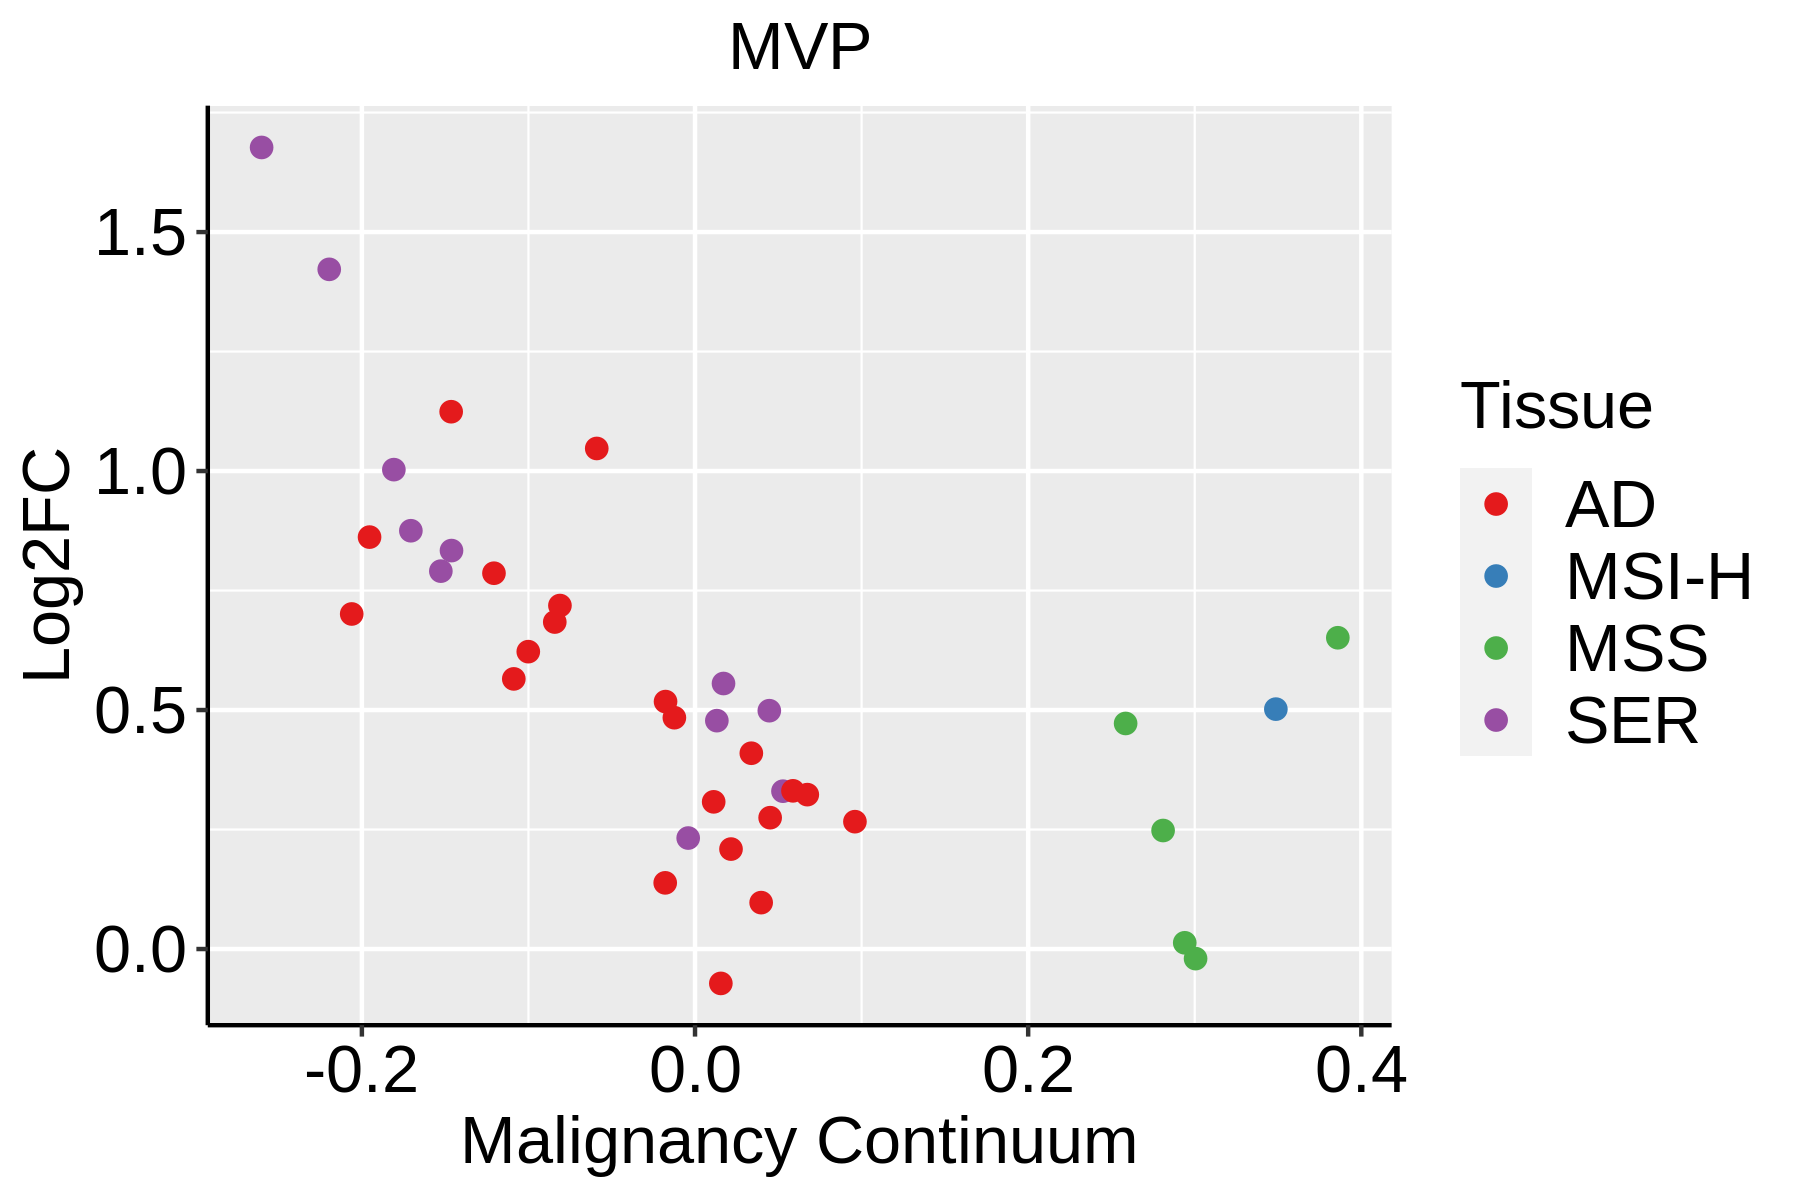 | AD: Adenomas |
| SER: Sessile serrated lesions |
| MSI-H: Microsatellite-high colorectal cancer |
| MSS: Microsatellite stable colorectal cancer |
| Esophagus | 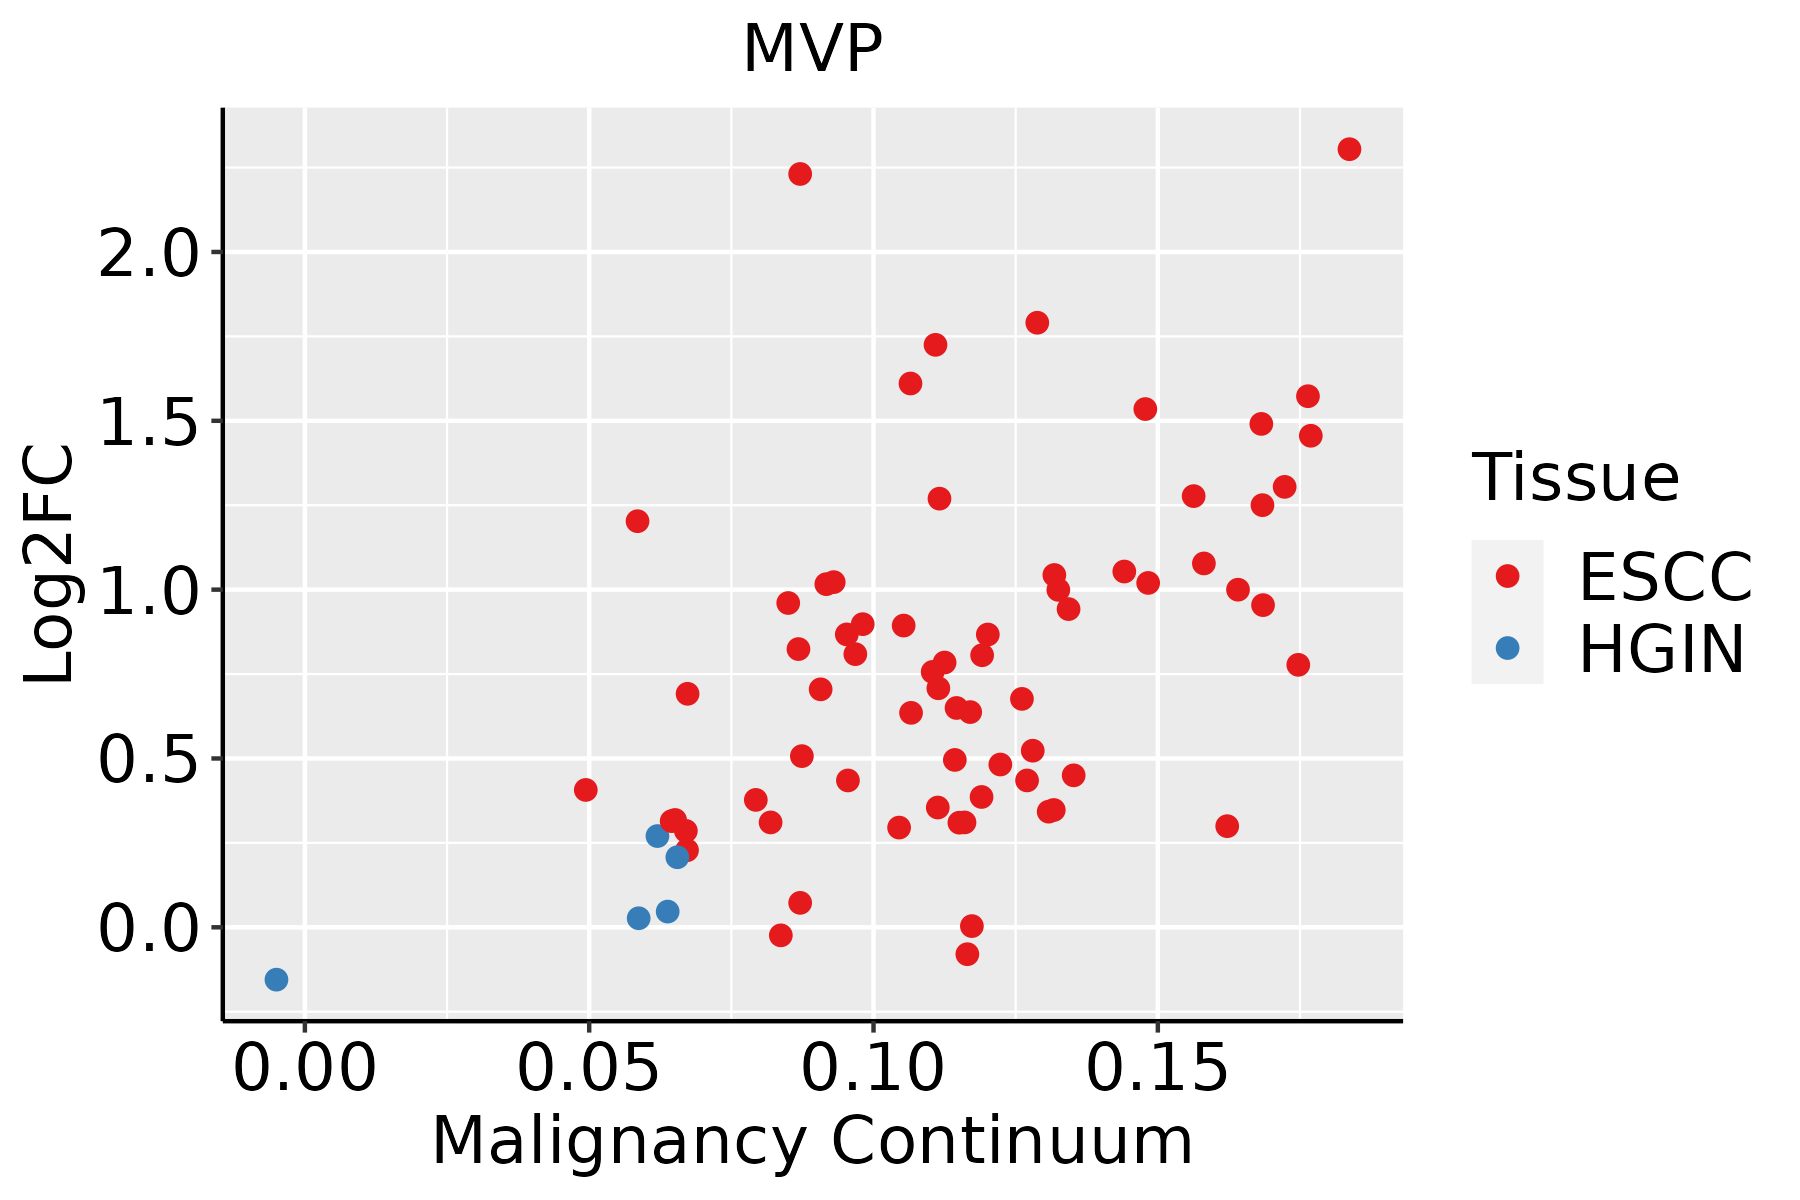 | ESCC: Esophageal squamous cell carcinoma |
| HGIN: High-grade intraepithelial neoplasias |
| LGIN: Low-grade intraepithelial neoplasias |
| GC | 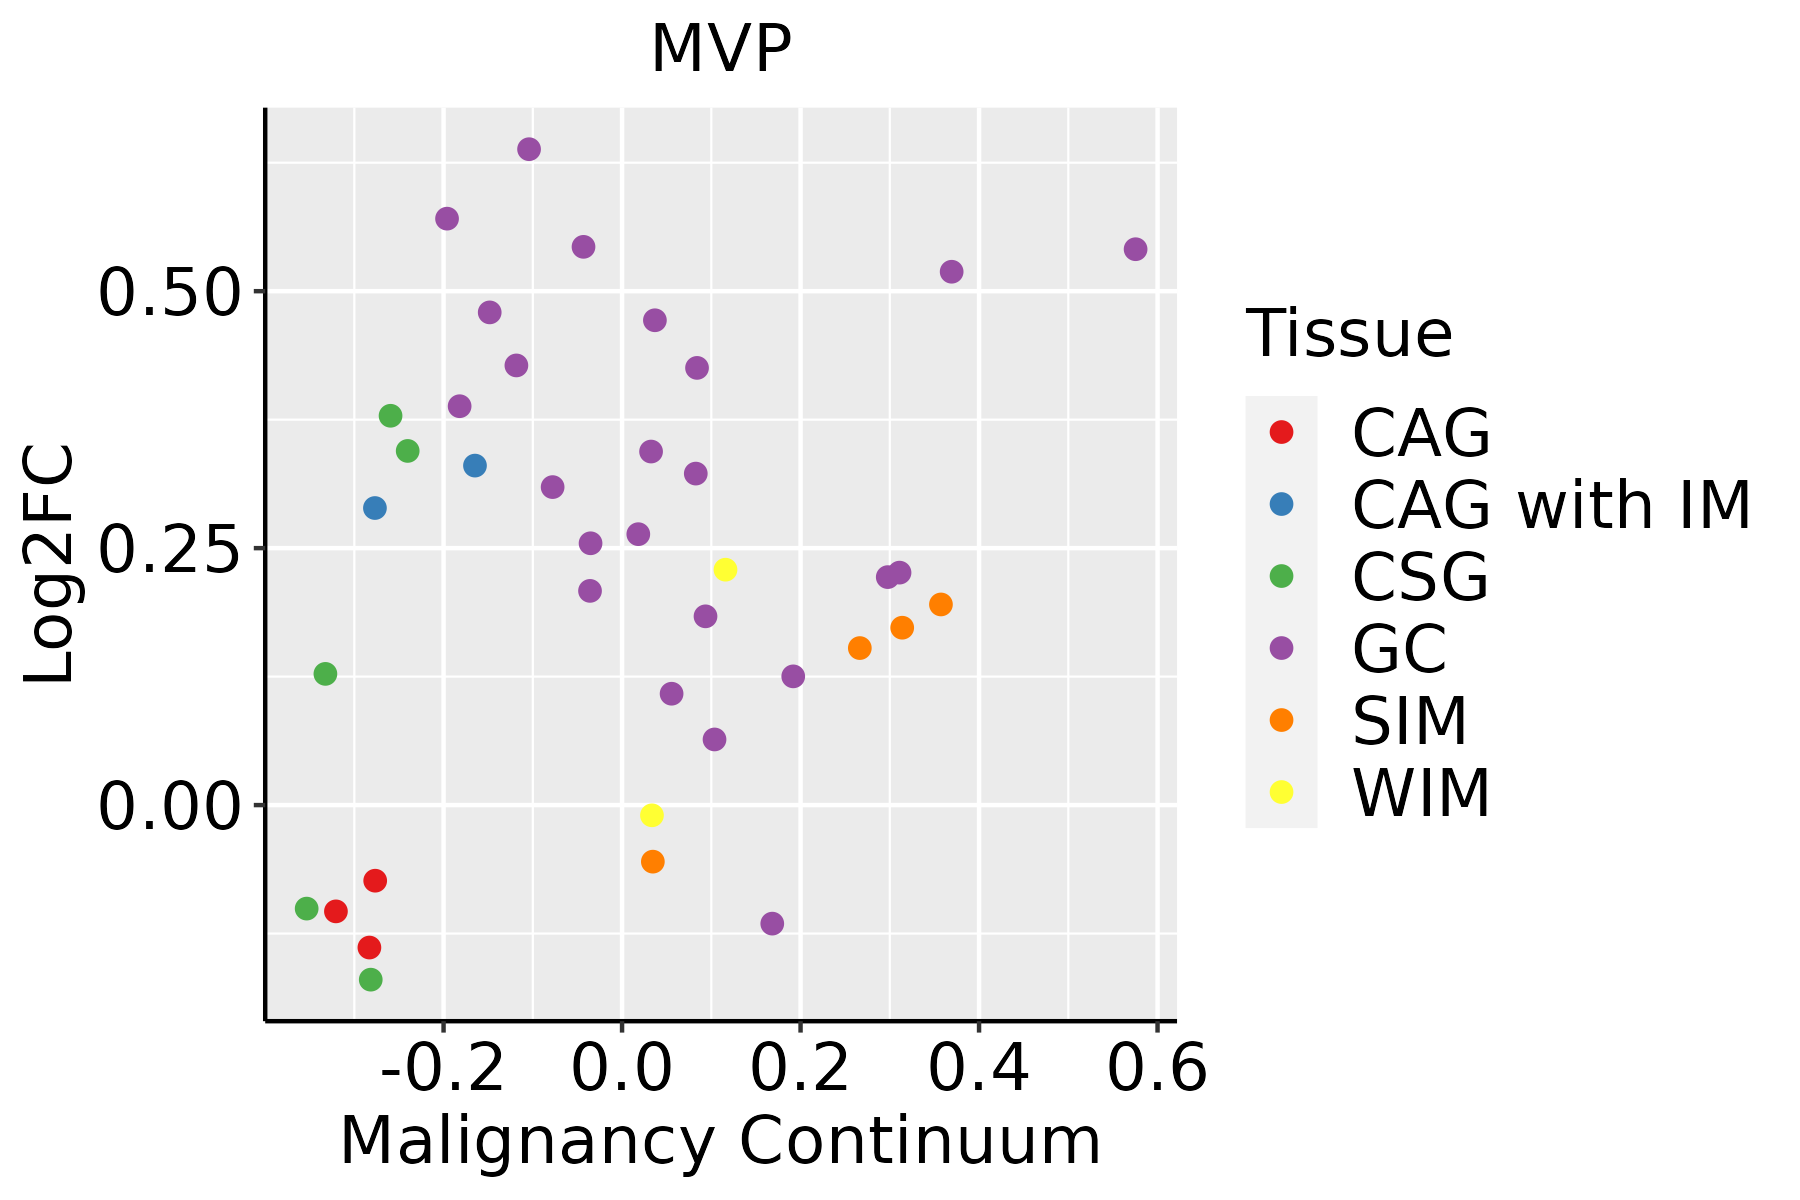 | CAG: Chronic atrophic gastritis |
| CAG with IM: Chronic atrophic gastritis with intestinal metaplasia |
| CSG: Chronic superficial gastritis |
| GC: Gastric cancer |
| SIM: Severe intestinal metaplasia |
| WIM: Wild intestinal metaplasia |
| Liver | 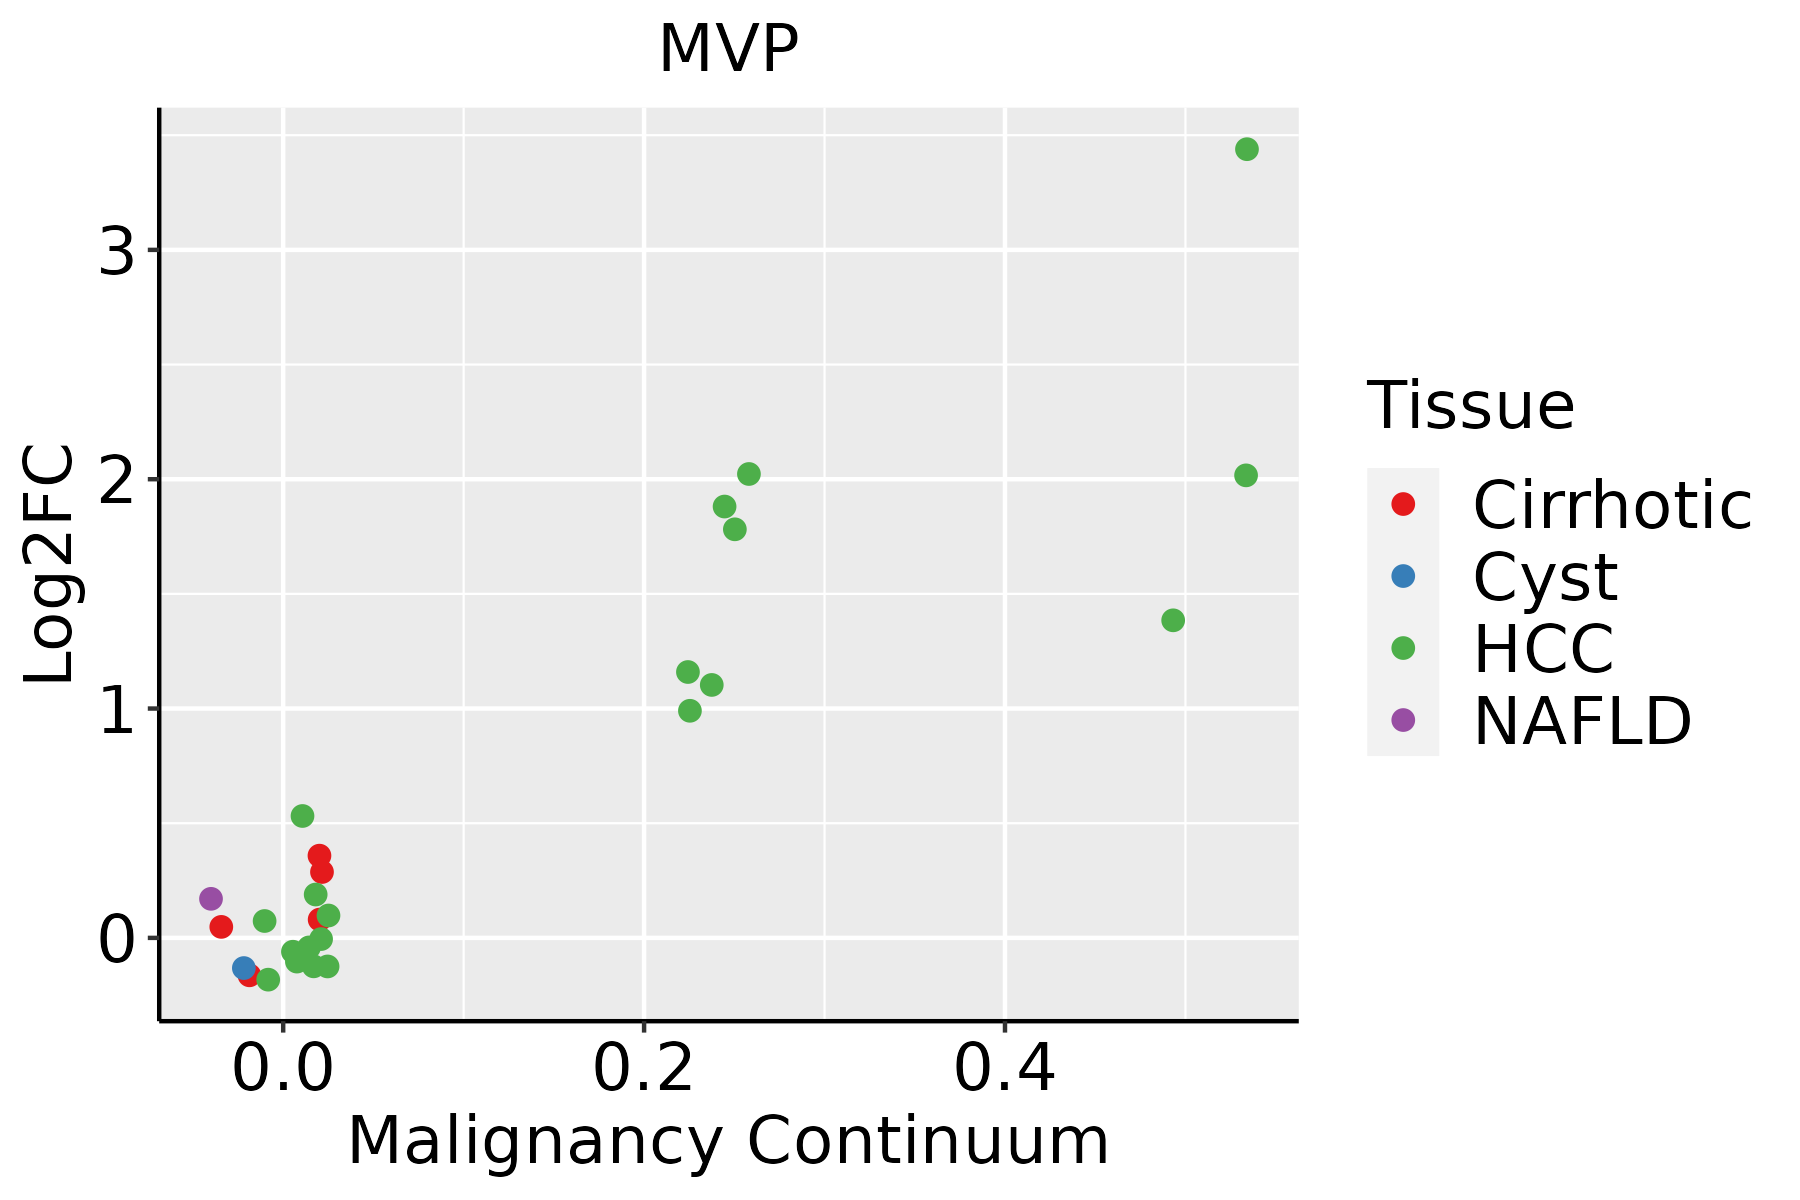 | HCC: Hepatocellular carcinoma |
| NAFLD: Non-alcoholic fatty liver disease |
| Oral Cavity | 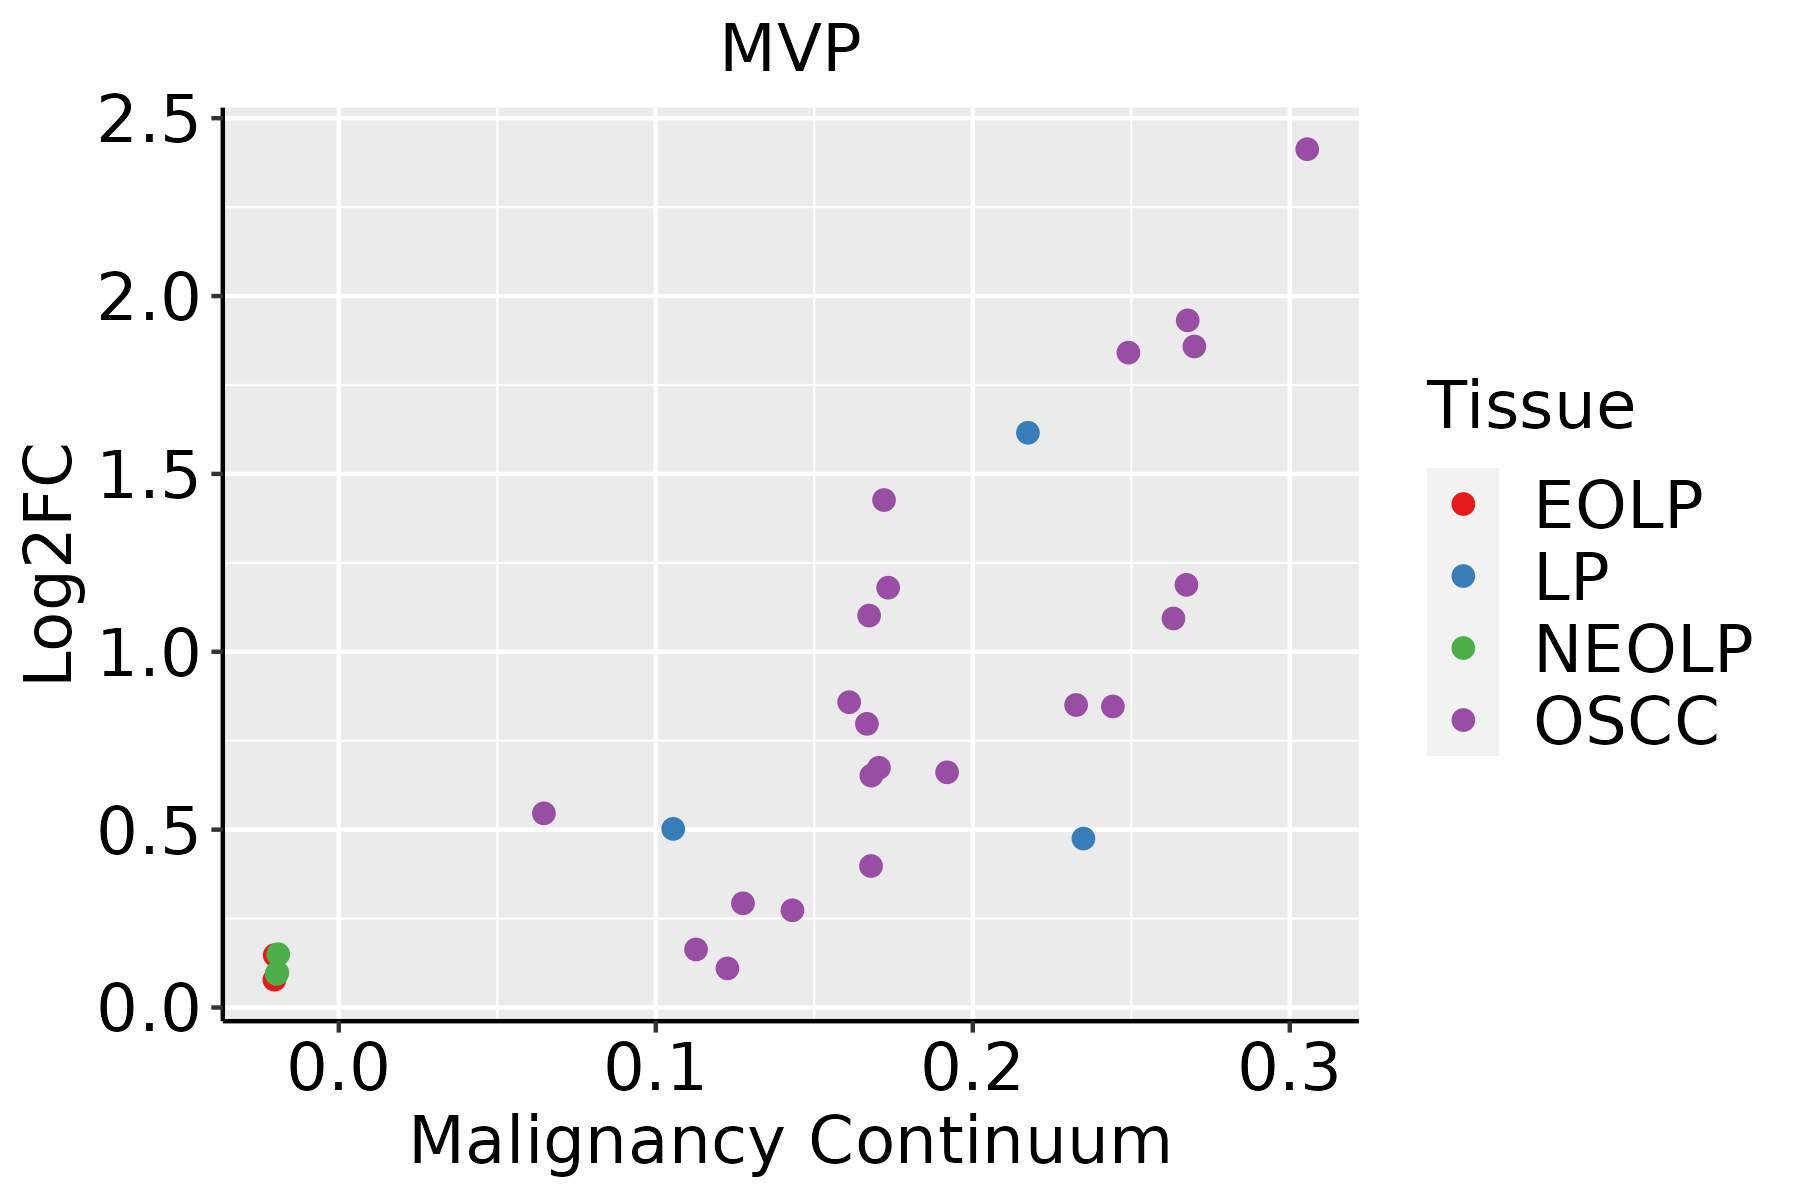 | EOLP: Erosive Oral lichen planus |
| LP: leukoplakia |
| NEOLP: Non-erosive oral lichen planus |
| OSCC: Oral squamous cell carcinoma |
| Skin |  | AK: Actinic keratosis |
| cSCC: Cutaneous squamous cell carcinoma |
| SCCIS:squamous cell carcinoma in situ |
| Thyroid |  | ATC: Anaplastic thyroid cancer |
| HT: Hashimoto's thyroiditis |
| PTC: Papillary thyroid cancer |
| GO ID | Tissue | Disease Stage | Description | Gene Ratio | Bg Ratio | pvalue | p.adjust | Count |
| GO:0038127 | Colorectum | AD | ERBB signaling pathway | 55/3918 | 121/18723 | 1.19e-09 | 8.85e-08 | 55 |
| GO:0007173 | Colorectum | AD | epidermal growth factor receptor signaling pathway | 50/3918 | 108/18723 | 3.08e-09 | 2.07e-07 | 50 |
| GO:0006403 | Colorectum | AD | RNA localization | 71/3918 | 201/18723 | 1.54e-06 | 4.76e-05 | 71 |
| GO:1901185 | Colorectum | AD | negative regulation of ERBB signaling pathway | 19/3918 | 32/18723 | 2.39e-06 | 6.98e-05 | 19 |
| GO:1901184 | Colorectum | AD | regulation of ERBB signaling pathway | 34/3918 | 79/18723 | 7.46e-06 | 1.82e-04 | 34 |
| GO:0010563 | Colorectum | AD | negative regulation of phosphorus metabolic process | 130/3918 | 442/18723 | 1.26e-05 | 2.76e-04 | 130 |
| GO:0045936 | Colorectum | AD | negative regulation of phosphate metabolic process | 129/3918 | 441/18723 | 1.81e-05 | 3.76e-04 | 129 |
| GO:0051236 | Colorectum | AD | establishment of RNA localization | 58/3918 | 166/18723 | 1.95e-05 | 4.01e-04 | 58 |
| GO:0015931 | Colorectum | AD | nucleobase-containing compound transport | 73/3918 | 222/18723 | 2.02e-05 | 4.10e-04 | 73 |
| GO:0051348 | Colorectum | AD | negative regulation of transferase activity | 85/3918 | 268/18723 | 2.07e-05 | 4.19e-04 | 85 |
| GO:0050657 | Colorectum | AD | nucleic acid transport | 57/3918 | 163/18723 | 2.22e-05 | 4.39e-04 | 57 |
| GO:0050658 | Colorectum | AD | RNA transport | 57/3918 | 163/18723 | 2.22e-05 | 4.39e-04 | 57 |
| GO:0046777 | Colorectum | AD | protein autophosphorylation | 74/3918 | 227/18723 | 2.48e-05 | 4.76e-04 | 74 |
| GO:0042058 | Colorectum | AD | regulation of epidermal growth factor receptor signaling pathway | 31/3918 | 73/18723 | 2.56e-05 | 4.89e-04 | 31 |
| GO:0042059 | Colorectum | AD | negative regulation of epidermal growth factor receptor signaling pathway | 16/3918 | 28/18723 | 2.96e-05 | 5.46e-04 | 16 |
| GO:0042326 | Colorectum | AD | negative regulation of phosphorylation | 112/3918 | 385/18723 | 8.02e-05 | 1.27e-03 | 112 |
| GO:0001933 | Colorectum | AD | negative regulation of protein phosphorylation | 101/3918 | 342/18723 | 9.39e-05 | 1.42e-03 | 101 |
| GO:0006469 | Colorectum | AD | negative regulation of protein kinase activity | 65/3918 | 212/18723 | 5.21e-04 | 5.62e-03 | 65 |
| GO:0033673 | Colorectum | AD | negative regulation of kinase activity | 71/3918 | 237/18723 | 6.18e-04 | 6.47e-03 | 71 |
| GO:0051028 | Colorectum | AD | mRNA transport | 42/3918 | 130/18723 | 1.57e-03 | 1.32e-02 | 42 |
| Hugo Symbol | Variant Class | Variant Classification | dbSNP RS | HGVSc | HGVSp | HGVSp Short | SWISSPROT | BIOTYPE | SIFT | PolyPhen | Tumor Sample Barcode | Tissue | Histology | Sex | Age | Stage | Therapy Types | Drugs | Outcome |
| MVP | SNV | Missense_Mutation | | c.510G>C | p.Gln170His | p.Q170H | Q14764 | protein_coding | tolerated(0.29) | benign(0.003) | TCGA-AR-A0TX-01 | Breast | breast invasive carcinoma | Female | <65 | I/II | Unknown | Unknown | SD |
| MVP | SNV | Missense_Mutation | | c.1234G>A | p.Glu412Lys | p.E412K | Q14764 | protein_coding | deleterious(0) | probably_damaging(0.952) | TCGA-C8-A3M7-01 | Breast | breast invasive carcinoma | Female | <65 | III/IV | Unknown | Unknown | PD |
| MVP | insertion | Frame_Shift_Ins | novel | c.2374_2375insAAGGCCTTTTGCAATGGCTATTCCTGCTGCCCAGAAAGCT | p.Val792GlufsTer38 | p.V792Efs*38 | Q14764 | protein_coding | | | TCGA-A8-A06P-01 | Breast | breast invasive carcinoma | Female | <65 | III/IV | Unspecific | | SD |
| MVP | insertion | Frame_Shift_Ins | novel | c.874_875insA | p.Gly292GlufsTer55 | p.G292Efs*55 | Q14764 | protein_coding | | | TCGA-AO-A0JD-01 | Breast | breast invasive carcinoma | Female | <65 | III/IV | Chemotherapy | cyclophosphamide | SD |
| MVP | insertion | In_Frame_Ins | novel | c.875_876insCTCTTCCTTTGAGCCCCAGTTTCAGTT | p.Gly292_Lys293insSerSerPheGluProGlnPheGlnPhe | p.G292_K293insSSFEPQFQF | Q14764 | protein_coding | | | TCGA-AO-A0JD-01 | Breast | breast invasive carcinoma | Female | <65 | III/IV | Chemotherapy | cyclophosphamide | SD |
| MVP | insertion | Frame_Shift_Ins | novel | c.2596_2597insAGGTGAGAGTTGGGGAAGGTGTGTTGGTTTCAGGA | p.Pro866GlnfsTer43 | p.P866Qfs*43 | Q14764 | protein_coding | | | TCGA-BH-A0B4-01 | Breast | breast invasive carcinoma | Male | >=65 | III/IV | Hormone Therapy | tamoxiphen | SD |
| MVP | insertion | Frame_Shift_Ins | rs778534743 | c.1744dupG | p.Ala582GlyfsTer9 | p.A582Gfs*9 | Q14764 | protein_coding | | | TCGA-BH-A0HX-01 | Breast | breast invasive carcinoma | Female | <65 | I/II | Chemotherapy | adrimycin | SD |
| MVP | SNV | Missense_Mutation | novel | c.2012C>T | p.Ala671Val | p.A671V | Q14764 | protein_coding | deleterious(0) | probably_damaging(0.99) | TCGA-2W-A8YY-01 | Cervix | cervical & endocervical cancer | Female | <65 | I/II | Chemotherapy | cisplatin | CR |
| MVP | SNV | Missense_Mutation | novel | c.10N>A | p.Glu4Lys | p.E4K | Q14764 | protein_coding | tolerated(0.15) | benign(0.08) | TCGA-JW-A5VL-01 | Cervix | cervical & endocervical cancer | Female | <65 | I/II | Unknown | Unknown | SD |
| MVP | SNV | Missense_Mutation | | c.2641N>G | p.Gln881Glu | p.Q881E | Q14764 | protein_coding | tolerated_low_confidence(0.21) | benign(0) | TCGA-Q1-A5R2-01 | Cervix | cervical & endocervical cancer | Female | <65 | I/II | Chemotherapy | cisplatin | PR |


