
|
|||||
|
 | |
| |
| |
| |
| |
| |
|
Gene: MRPS33 |
Gene summary for MRPS33 |
| Gene information | Species | Human | Gene symbol | MRPS33 | Gene ID | 51650 |
| Gene name | mitochondrial ribosomal protein S33 | |
| Gene Alias | CGI-139 | |
| Cytomap | 7q34 | |
| Gene Type | protein-coding | GO ID | GO:0006412 | UniProtAcc | A4D1T3 |
Top |
Malignant transformation analysis |
| Identification of the aberrant gene expression in precancerous and cancerous lesions by comparing the gene expression of stem-like cells in diseased tissues with normal stem cells |
| Entrez ID | Symbol | Replicates | Species | Organ | Tissue | Adj P-value | Log2FC | Malignancy |
| 51650 | MRPS33 | HTA11_99999965104_69814 | Human | Colorectum | MSS | 4.09e-11 | 6.42e-01 | 0.281 |
| 51650 | MRPS33 | HTA11_99999971662_82457 | Human | Colorectum | MSS | 2.30e-20 | 6.98e-01 | 0.3859 |
| 51650 | MRPS33 | HTA11_99999974143_84620 | Human | Colorectum | MSS | 7.28e-14 | 4.77e-01 | 0.3005 |
| 51650 | MRPS33 | LZE4T | Human | Esophagus | ESCC | 3.31e-10 | 2.18e-01 | 0.0811 |
| 51650 | MRPS33 | LZE5T | Human | Esophagus | ESCC | 1.35e-02 | 1.77e-01 | 0.0514 |
| 51650 | MRPS33 | LZE7T | Human | Esophagus | ESCC | 2.05e-05 | 6.47e-01 | 0.0667 |
| 51650 | MRPS33 | LZE8T | Human | Esophagus | ESCC | 1.89e-03 | 3.30e-01 | 0.067 |
| 51650 | MRPS33 | LZE20T | Human | Esophagus | ESCC | 1.47e-06 | 4.38e-01 | 0.0662 |
| 51650 | MRPS33 | LZE22D1 | Human | Esophagus | HGIN | 9.51e-05 | 1.37e-01 | 0.0595 |
| 51650 | MRPS33 | LZE24T | Human | Esophagus | ESCC | 8.02e-06 | 5.92e-01 | 0.0596 |
| 51650 | MRPS33 | LZE6T | Human | Esophagus | ESCC | 7.93e-04 | 4.08e-01 | 0.0845 |
| 51650 | MRPS33 | P1T-E | Human | Esophagus | ESCC | 5.72e-10 | 4.48e-01 | 0.0875 |
| 51650 | MRPS33 | P2T-E | Human | Esophagus | ESCC | 7.46e-17 | 4.07e-01 | 0.1177 |
| 51650 | MRPS33 | P4T-E | Human | Esophagus | ESCC | 2.25e-52 | 1.54e+00 | 0.1323 |
| 51650 | MRPS33 | P5T-E | Human | Esophagus | ESCC | 2.03e-50 | 1.16e+00 | 0.1327 |
| 51650 | MRPS33 | P8T-E | Human | Esophagus | ESCC | 1.06e-24 | 5.54e-01 | 0.0889 |
| 51650 | MRPS33 | P9T-E | Human | Esophagus | ESCC | 1.44e-22 | 8.71e-01 | 0.1131 |
| 51650 | MRPS33 | P10T-E | Human | Esophagus | ESCC | 2.28e-35 | 6.39e-01 | 0.116 |
| 51650 | MRPS33 | P11T-E | Human | Esophagus | ESCC | 9.34e-08 | 3.08e-01 | 0.1426 |
| 51650 | MRPS33 | P12T-E | Human | Esophagus | ESCC | 3.56e-59 | 1.27e+00 | 0.1122 |
| Page: 1 2 3 4 5 6 7 8 |
| Tissue | Expression Dynamics | Abbreviation |
| Colorectum (GSE201348) |  | FAP: Familial adenomatous polyposis |
| CRC: Colorectal cancer | ||
| Colorectum (HTA11) | 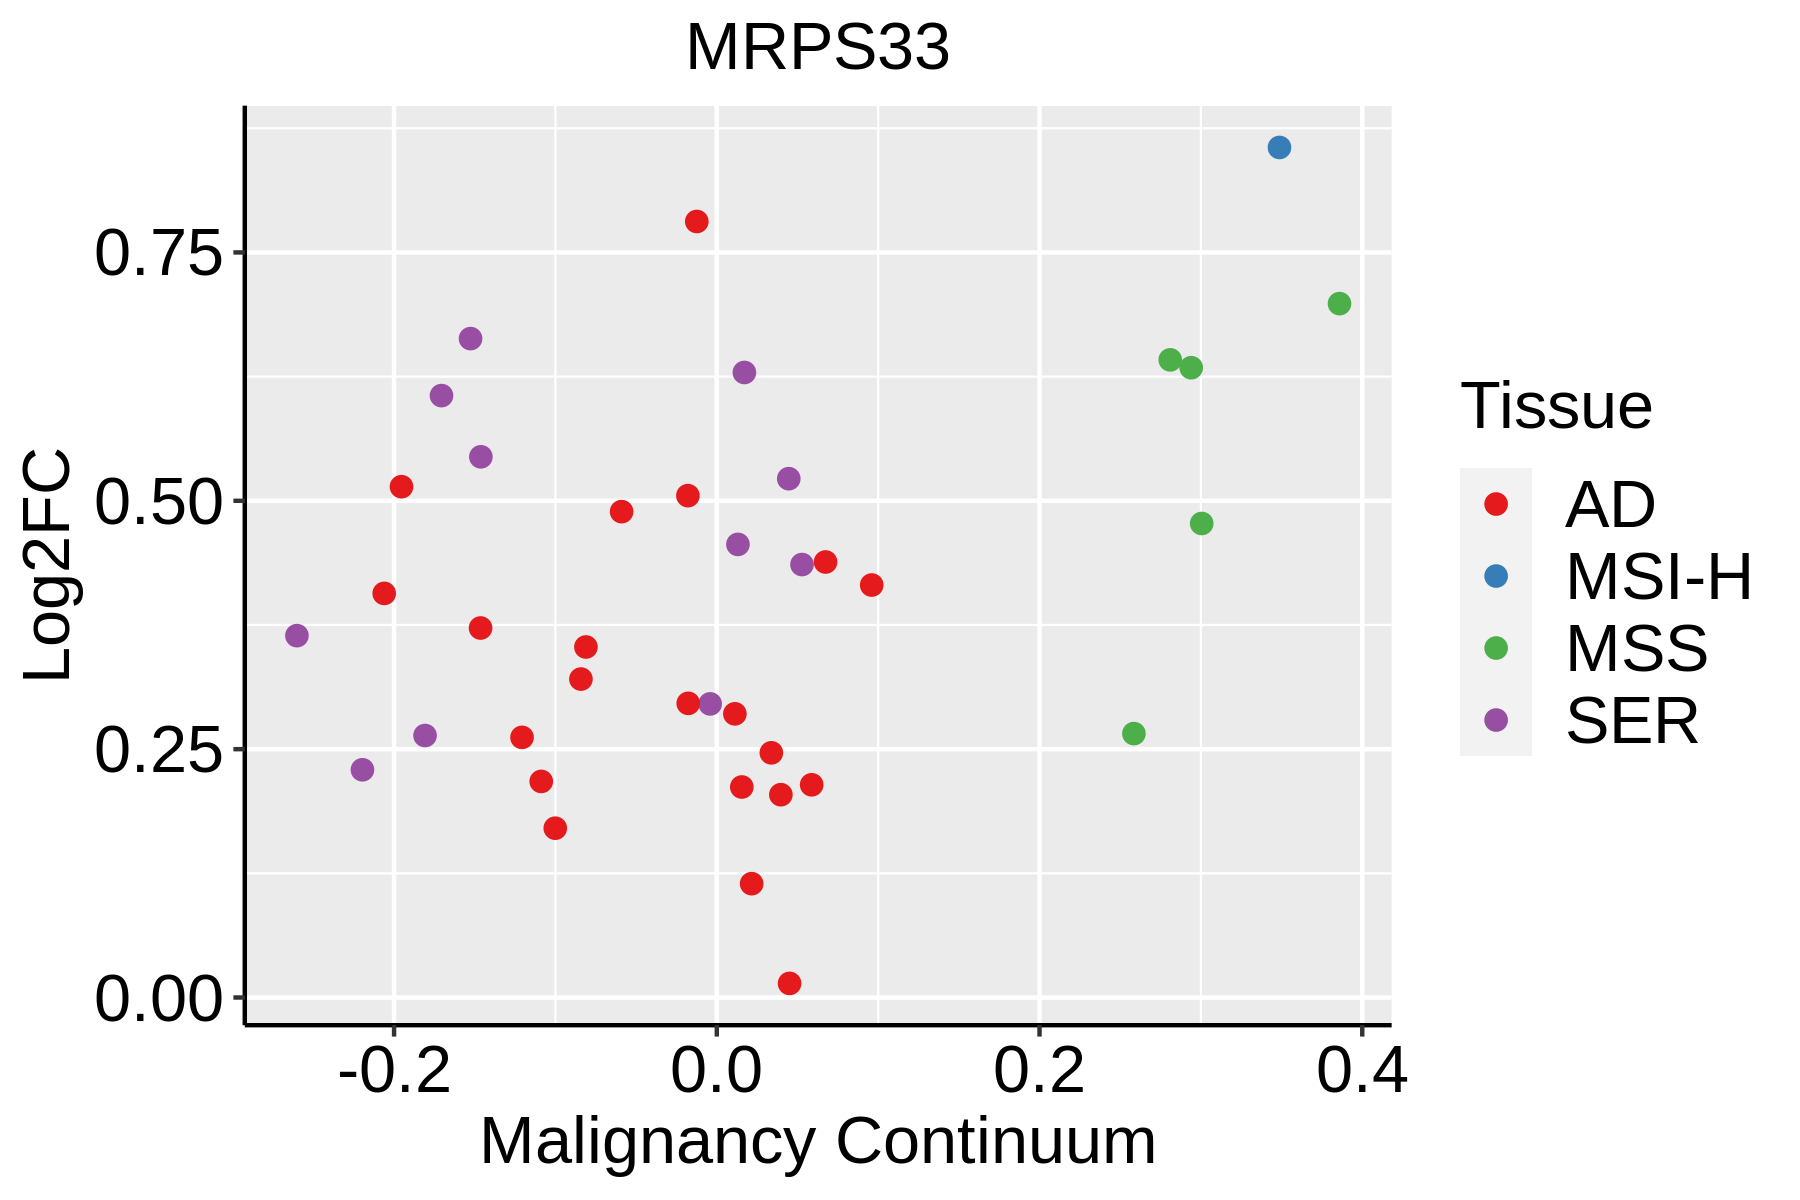 | AD: Adenomas |
| SER: Sessile serrated lesions | ||
| MSI-H: Microsatellite-high colorectal cancer | ||
| MSS: Microsatellite stable colorectal cancer | ||
| Esophagus | 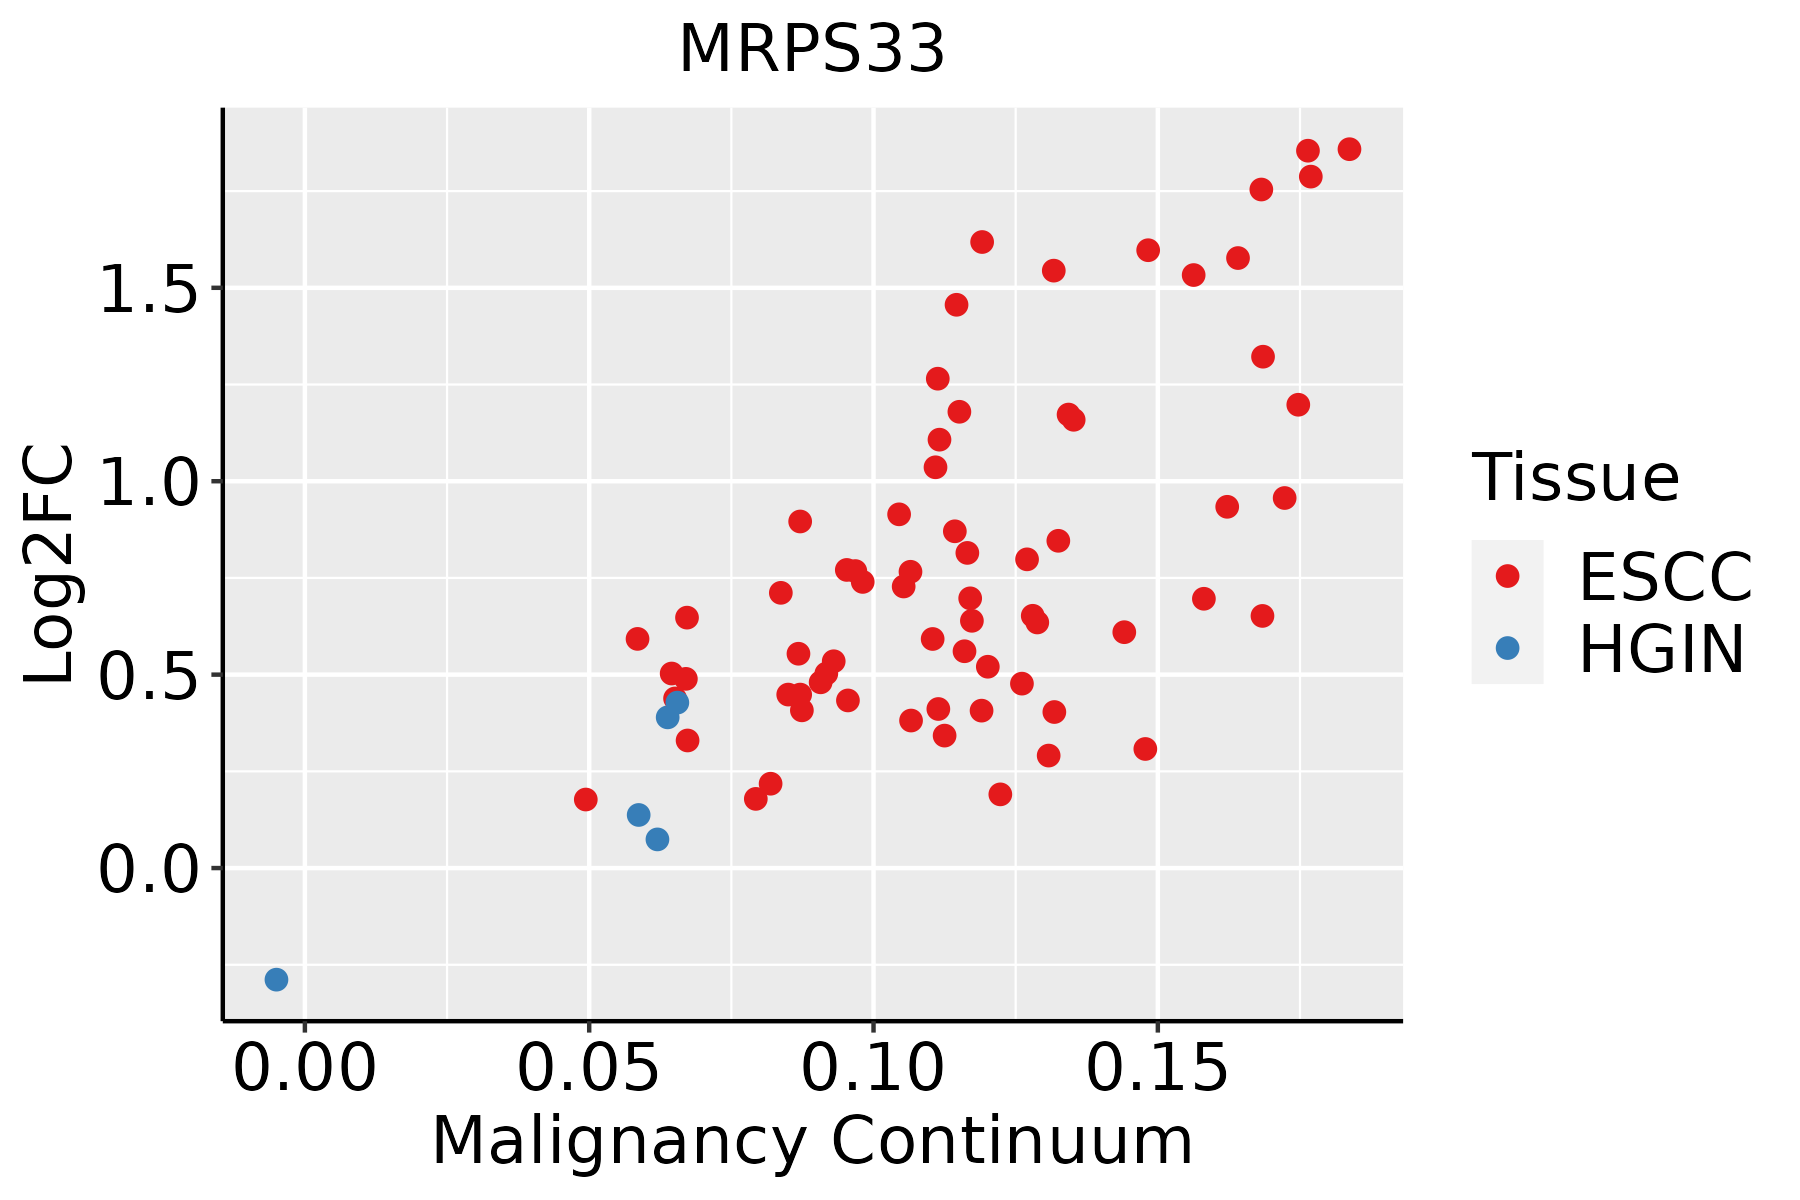 | ESCC: Esophageal squamous cell carcinoma |
| HGIN: High-grade intraepithelial neoplasias | ||
| LGIN: Low-grade intraepithelial neoplasias | ||
| Liver |  | HCC: Hepatocellular carcinoma |
| NAFLD: Non-alcoholic fatty liver disease | ||
| Oral Cavity | 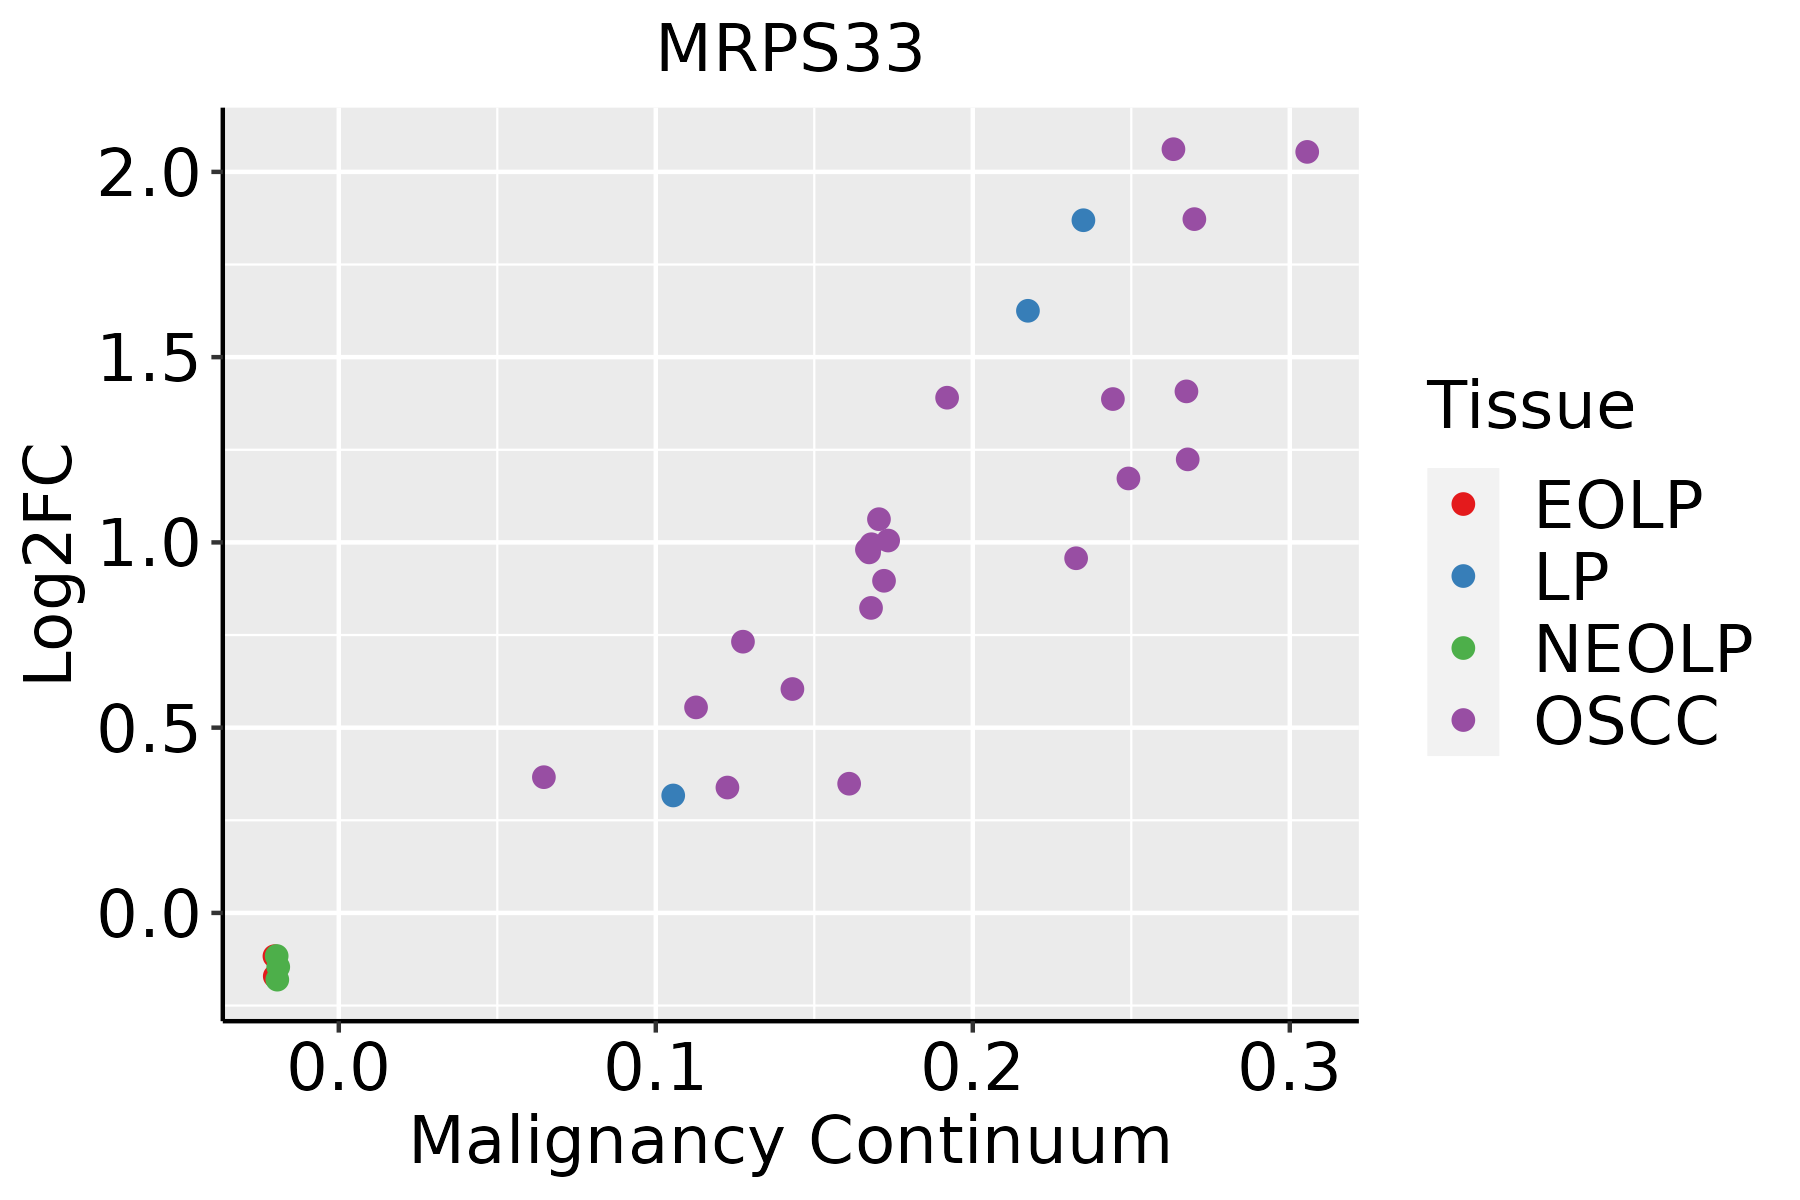 | EOLP: Erosive Oral lichen planus |
| LP: leukoplakia | ||
| NEOLP: Non-erosive oral lichen planus | ||
| OSCC: Oral squamous cell carcinoma | ||
| Prostate | 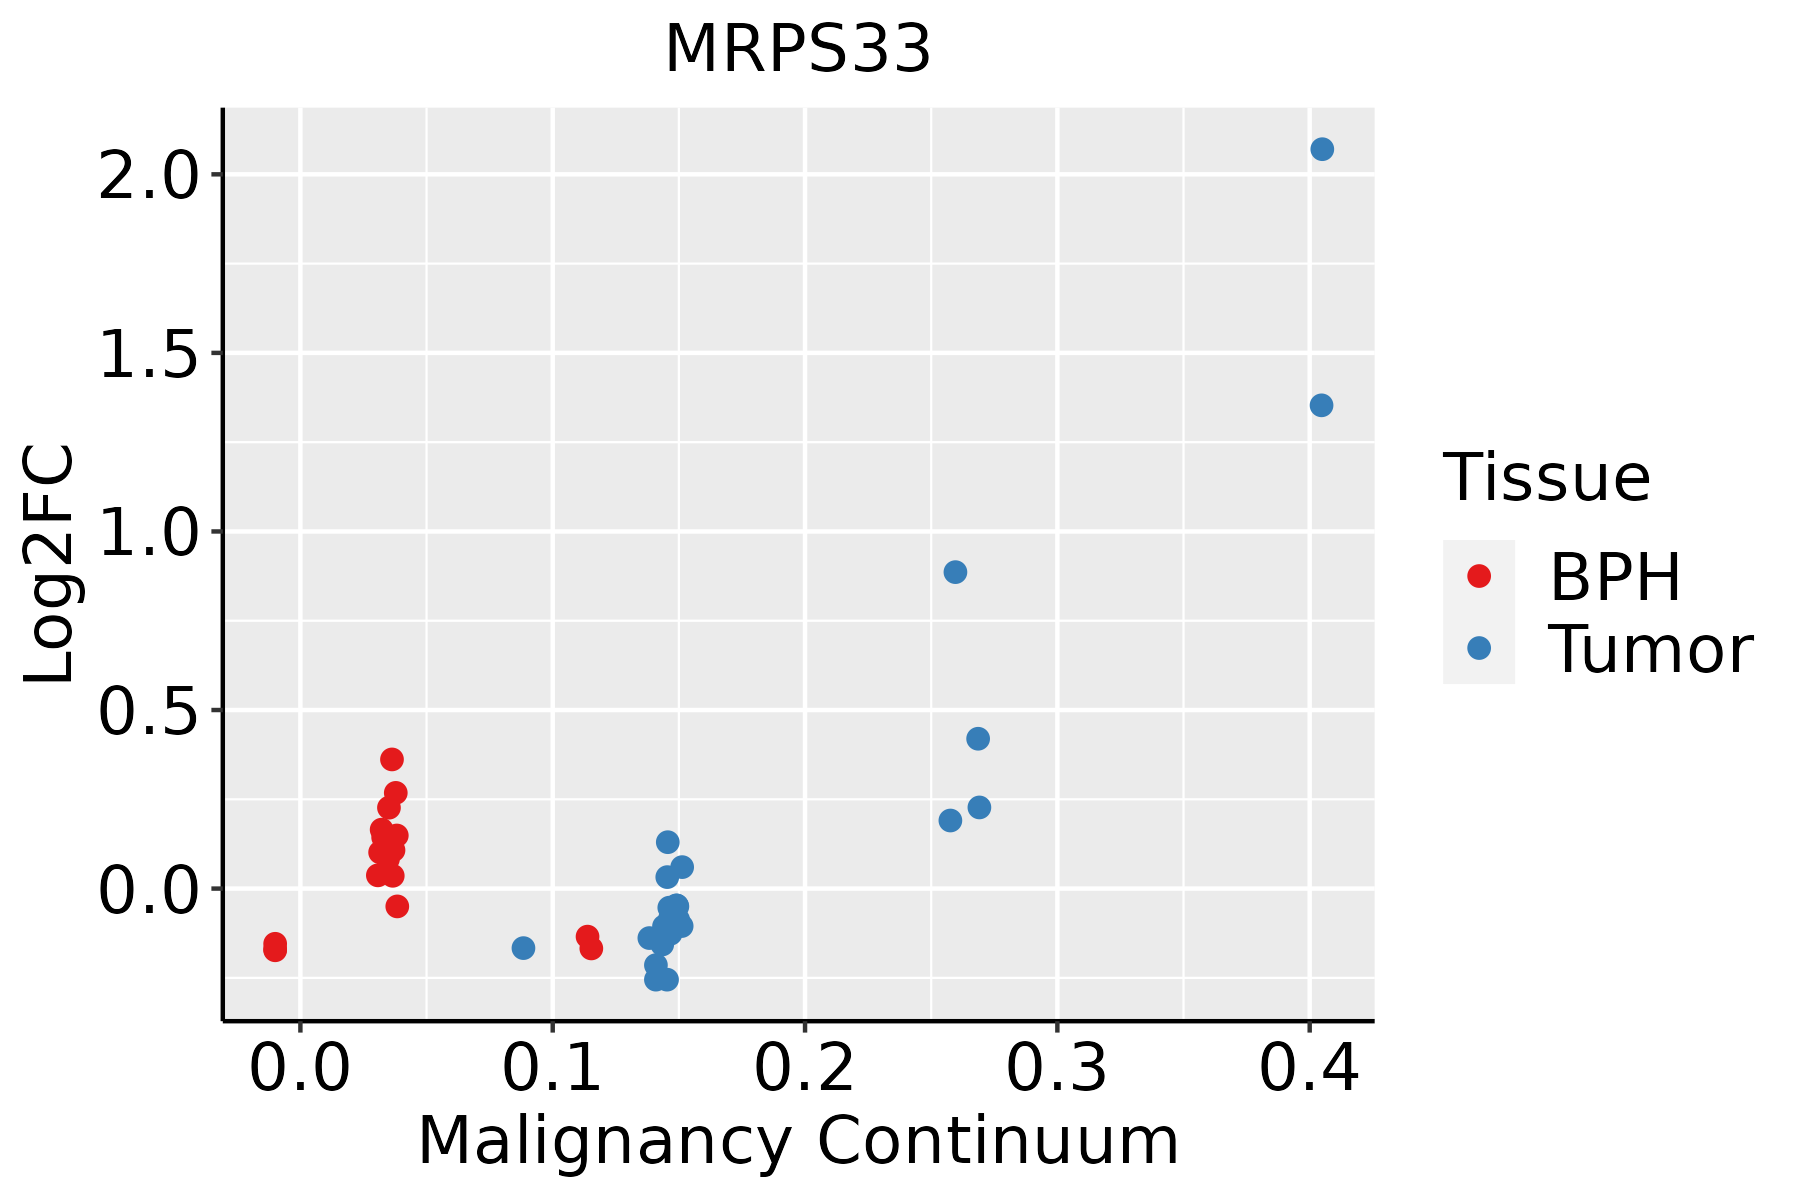 | BPH: Benign Prostatic Hyperplasia |
| Skin |  | AK: Actinic keratosis |
| cSCC: Cutaneous squamous cell carcinoma | ||
| SCCIS:squamous cell carcinoma in situ | ||
| Thyroid |  | ATC: Anaplastic thyroid cancer |
| HT: Hashimoto's thyroiditis | ||
| PTC: Papillary thyroid cancer |
| ∗log2FC in expression of this searched gene in stem-like cells from each diseased tissue sample relative to stem-like cells in normal samples in each tissue plotted against the malignancy continuum. Samples are colored based on if they are from different disease stage. |
Top |
Malignant transformation related pathway analysis |
| Find out the enriched GO biological processes and KEGG pathways involved in transition from healthy to precancer to cancer |
| Tissue | Disease Stage | Enriched GO biological Processes |
| Colorectum | AD |  |
| Colorectum | SER |  |
| Colorectum | MSS |  |
| Colorectum | MSI-H |  |
| Colorectum | FAP |  |
| ∗Top 15 enriched GO BP terms are showed in the bar plot of each disease state in each tissue. Each row represents a significant GO biological process which is colored according to the -log10(p.adjust). |
| Page: 1 2 3 4 5 6 7 8 9 |
| GO ID | Tissue | Disease Stage | Description | Gene Ratio | Bg Ratio | pvalue | p.adjust | Count |
| Page: 1 |
| Pathway ID | Tissue | Disease Stage | Description | Gene Ratio | Bg Ratio | pvalue | p.adjust | qvalue | Count |
| Page: 1 |
Top |
Cell-cell communication analysis |
| Identification of potential cell-cell interactions between two cell types and their ligand-receptor pairs for different disease states |
| Ligand | Receptor | LRpair | Pathway | Tissue | Disease Stage |
| Page: 1 |
Top |
Single-cell gene regulatory network inference analysis |
| Find out the significant the regulons (TFs) and the target genes of each regulon across cell types for different disease states |
| TF | Cell Type | Tissue | Disease Stage | Target Gene | RSS | Regulon Activity |
| ∗The dot plots of a searched regulon are shown for all cell subpopulations in each disease state of each tissue based on the regulon specific score inferred using pySCENIC and by calculating the average expression. |
| Page: 1 |
Top |
Somatic mutation of malignant transformation related genes |
| Annotation of somatic variants for genes involved in malignant transformation |
| Hugo Symbol | Variant Class | Variant Classification | dbSNP RS | HGVSc | HGVSp | HGVSp Short | SWISSPROT | BIOTYPE | SIFT | PolyPhen | Tumor Sample Barcode | Tissue | Histology | Sex | Age | Stage | Therapy Types | Drugs | Outcome |
| MRPS33 | SNV | Missense_Mutation | c.302N>C | p.Arg101Thr | p.R101T | Q9Y291 | protein_coding | deleterious(0) | probably_damaging(0.991) | TCGA-C8-A275-01 | Breast | breast invasive carcinoma | Female | <65 | I/II | Unknown | Unknown | SD | |
| MRPS33 | SNV | Missense_Mutation | rs779139791 | c.50N>A | p.Arg17Gln | p.R17Q | Q9Y291 | protein_coding | tolerated(0.12) | benign(0.173) | TCGA-C5-A3HE-01 | Cervix | cervical & endocervical cancer | Female | <65 | I/II | Unknown | Unknown | PD |
| MRPS33 | deletion | Frame_Shift_Del | c.301delA | p.Arg101GlufsTer55 | p.R101Efs*55 | Q9Y291 | protein_coding | TCGA-G4-6302-01 | Colorectum | colon adenocarcinoma | Female | >=65 | I/II | Unknown | Unknown | SD | |||
| MRPS33 | SNV | Missense_Mutation | novel | c.71G>T | p.Arg24Met | p.R24M | Q9Y291 | protein_coding | deleterious(0.03) | probably_damaging(0.945) | TCGA-A5-A0G1-01 | Endometrium | uterine corpus endometrioid carcinoma | Female | >=65 | I/II | Unknown | Unknown | SD |
| MRPS33 | SNV | Missense_Mutation | c.280N>T | p.Pro94Ser | p.P94S | Q9Y291 | protein_coding | deleterious(0.01) | probably_damaging(0.999) | TCGA-BS-A0TJ-01 | Endometrium | uterine corpus endometrioid carcinoma | Female | <65 | I/II | Unknown | Unknown | SD | |
| MRPS33 | deletion | Frame_Shift_Del | c.301delN | p.Arg101GlufsTer55 | p.R101Efs*55 | Q9Y291 | protein_coding | TCGA-D1-A17M-01 | Endometrium | uterine corpus endometrioid carcinoma | Female | <65 | I/II | Unknown | Unknown | SD | |||
| MRPS33 | deletion | Frame_Shift_Del | novel | c.223delN | p.His75IlefsTer11 | p.H75Ifs*11 | Q9Y291 | protein_coding | TCGA-EO-A22U-01 | Endometrium | uterine corpus endometrioid carcinoma | Female | >=65 | I/II | Unknown | Unknown | SD | ||
| MRPS33 | deletion | Frame_Shift_Del | novel | c.313delA | p.Arg105GlyfsTer51 | p.R105Gfs*51 | Q9Y291 | protein_coding | TCGA-EY-A1GK-01 | Endometrium | uterine corpus endometrioid carcinoma | Female | >=65 | I/II | Unknown | Unknown | SD | ||
| MRPS33 | SNV | Missense_Mutation | c.203N>C | p.Leu68Pro | p.L68P | Q9Y291 | protein_coding | deleterious(0.01) | possibly_damaging(0.892) | TCGA-DD-A1EK-01 | Liver | liver hepatocellular carcinoma | Female | <65 | I/II | Targeted Molecular therapy | sorafenib | PD | |
| MRPS33 | SNV | Missense_Mutation | rs750148841 | c.304N>T | p.Ala102Ser | p.A102S | Q9Y291 | protein_coding | tolerated(0.33) | benign(0.033) | TCGA-95-7567-01 | Lung | lung adenocarcinoma | Male | <65 | I/II | Chemotherapy | cisplatin | SD |
| Page: 1 2 |
Top |
Related drugs of malignant transformation related genes |
| Identification of chemicals and drugs interact with genes involved in malignant transfromation |
| (DGIdb 4.0) |
| Entrez ID | Symbol | Category | Interaction Types | Drug Claim Name | Drug Name | PMIDs |
| Page: 1 |

Copyright 2023-Present -The University of Texas Health Science Center at Houston |