
|
|||||
|
 | |
| |
| |
| |
| |
| |
|
Gene: MRPL50 |
Gene summary for MRPL50 |
| Gene information | Species | Human | Gene symbol | MRPL50 | Gene ID | 54534 |
| Gene name | mitochondrial ribosomal protein L50 | |
| Gene Alias | MRP-L50 | |
| Cytomap | 9q31.1 | |
| Gene Type | protein-coding | GO ID | GO:0000313 | UniProtAcc | Q8N5N7 |
Top |
Malignant transformation analysis |
| Identification of the aberrant gene expression in precancerous and cancerous lesions by comparing the gene expression of stem-like cells in diseased tissues with normal stem cells |
| Entrez ID | Symbol | Replicates | Species | Organ | Tissue | Adj P-value | Log2FC | Malignancy |
| 54534 | MRPL50 | P19T-E | Human | Esophagus | ESCC | 1.22e-08 | 6.41e-01 | 0.1662 |
| 54534 | MRPL50 | P20T-E | Human | Esophagus | ESCC | 1.05e-10 | 2.50e-01 | 0.1124 |
| 54534 | MRPL50 | P21T-E | Human | Esophagus | ESCC | 8.64e-48 | 1.06e+00 | 0.1617 |
| 54534 | MRPL50 | P22T-E | Human | Esophagus | ESCC | 1.03e-19 | 4.11e-01 | 0.1236 |
| 54534 | MRPL50 | P23T-E | Human | Esophagus | ESCC | 1.46e-23 | 3.65e-01 | 0.108 |
| 54534 | MRPL50 | P24T-E | Human | Esophagus | ESCC | 2.40e-23 | 5.98e-01 | 0.1287 |
| 54534 | MRPL50 | P26T-E | Human | Esophagus | ESCC | 1.67e-27 | 6.19e-01 | 0.1276 |
| 54534 | MRPL50 | P27T-E | Human | Esophagus | ESCC | 8.63e-25 | 3.14e-01 | 0.1055 |
| 54534 | MRPL50 | P28T-E | Human | Esophagus | ESCC | 9.20e-30 | 6.21e-01 | 0.1149 |
| 54534 | MRPL50 | P30T-E | Human | Esophagus | ESCC | 7.46e-39 | 1.04e+00 | 0.137 |
| 54534 | MRPL50 | P31T-E | Human | Esophagus | ESCC | 4.60e-27 | 7.55e-01 | 0.1251 |
| 54534 | MRPL50 | P32T-E | Human | Esophagus | ESCC | 9.19e-39 | 8.51e-01 | 0.1666 |
| 54534 | MRPL50 | P36T-E | Human | Esophagus | ESCC | 3.60e-26 | 6.81e-01 | 0.1187 |
| 54534 | MRPL50 | P37T-E | Human | Esophagus | ESCC | 6.42e-20 | 5.50e-01 | 0.1371 |
| 54534 | MRPL50 | P38T-E | Human | Esophagus | ESCC | 1.09e-07 | 2.51e-01 | 0.127 |
| 54534 | MRPL50 | P39T-E | Human | Esophagus | ESCC | 9.61e-18 | 3.50e-01 | 0.0894 |
| 54534 | MRPL50 | P40T-E | Human | Esophagus | ESCC | 1.97e-17 | 3.26e-01 | 0.109 |
| 54534 | MRPL50 | P42T-E | Human | Esophagus | ESCC | 4.41e-20 | 5.07e-01 | 0.1175 |
| 54534 | MRPL50 | P44T-E | Human | Esophagus | ESCC | 1.88e-14 | 1.40e-01 | 0.1096 |
| 54534 | MRPL50 | P47T-E | Human | Esophagus | ESCC | 1.62e-16 | 3.54e-01 | 0.1067 |
| Page: 1 2 3 4 5 6 |
| Tissue | Expression Dynamics | Abbreviation |
| Esophagus |  | ESCC: Esophageal squamous cell carcinoma |
| HGIN: High-grade intraepithelial neoplasias | ||
| LGIN: Low-grade intraepithelial neoplasias | ||
| Liver |  | HCC: Hepatocellular carcinoma |
| NAFLD: Non-alcoholic fatty liver disease | ||
| Oral Cavity |  | EOLP: Erosive Oral lichen planus |
| LP: leukoplakia | ||
| NEOLP: Non-erosive oral lichen planus | ||
| OSCC: Oral squamous cell carcinoma | ||
| Skin | 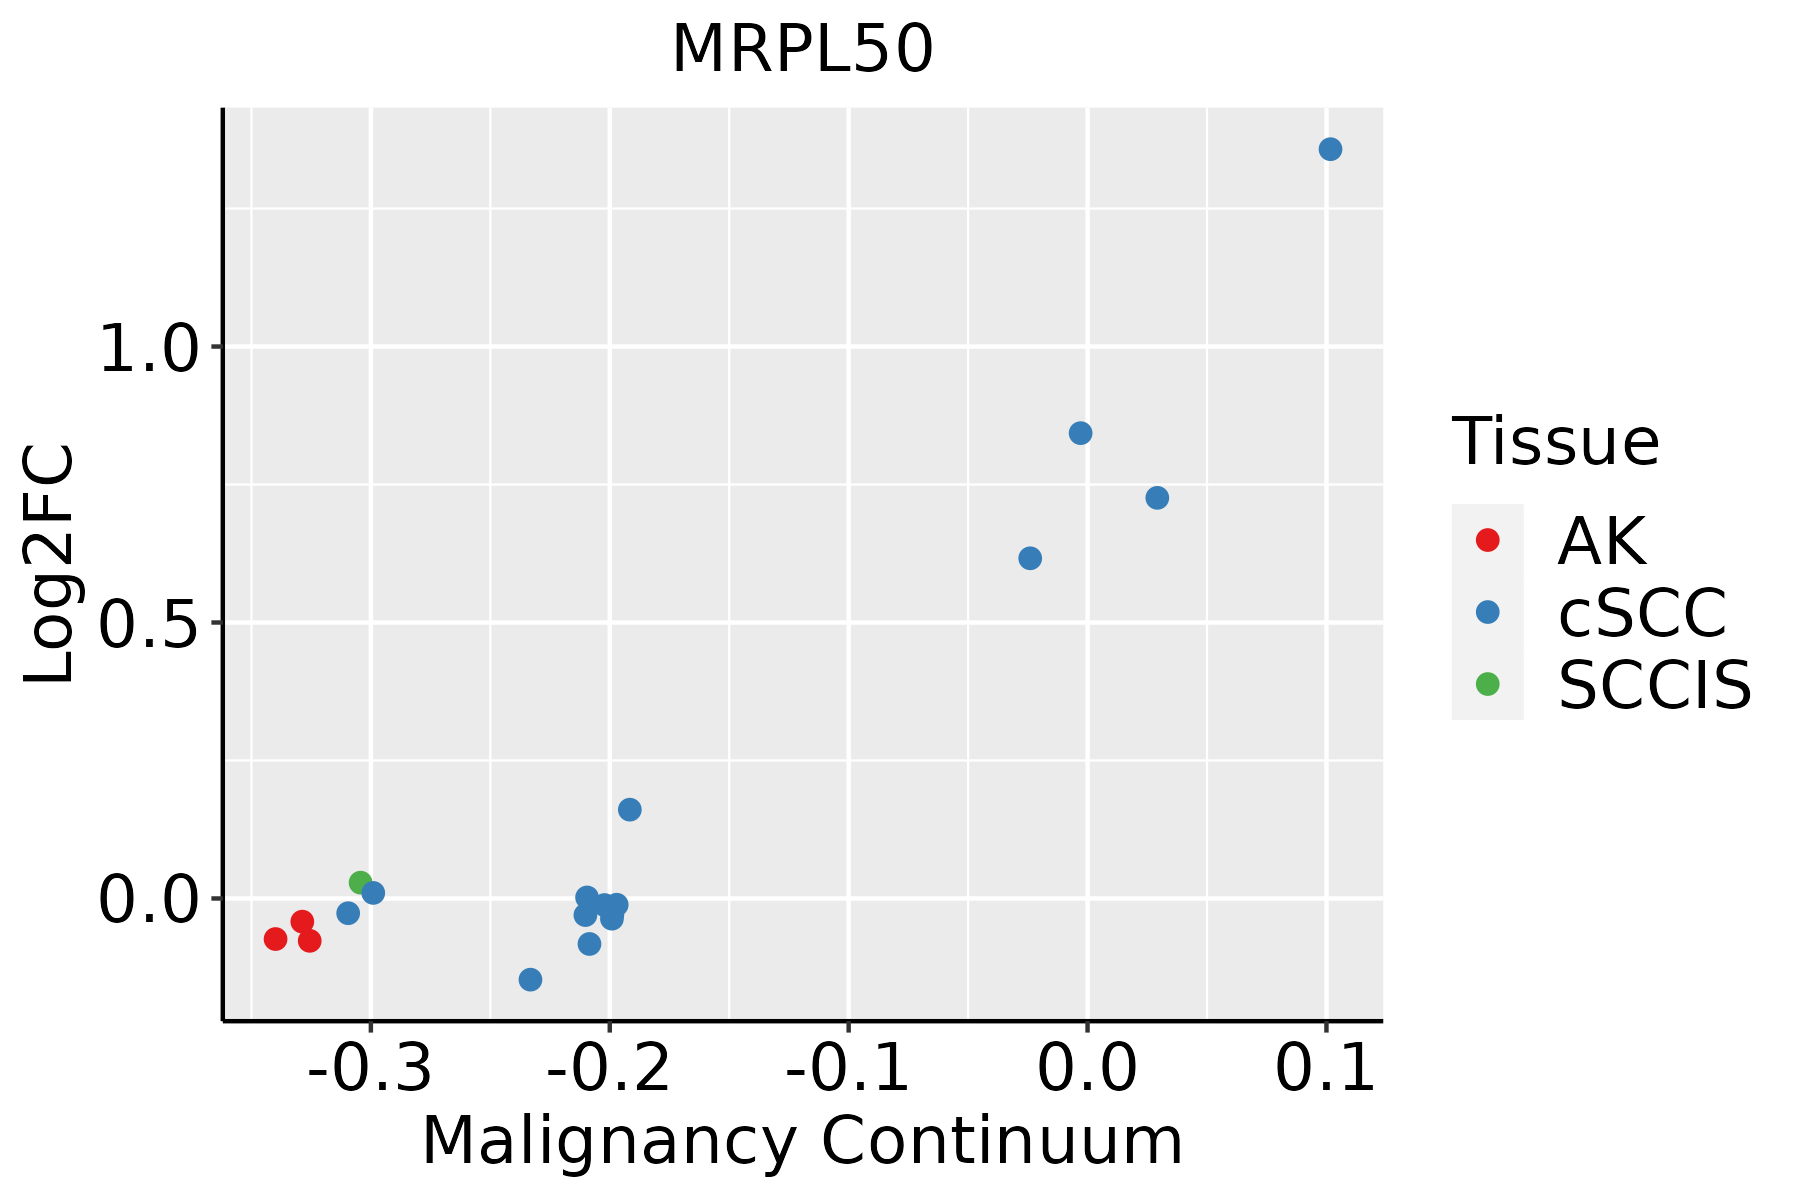 | AK: Actinic keratosis |
| cSCC: Cutaneous squamous cell carcinoma | ||
| SCCIS:squamous cell carcinoma in situ |
| ∗log2FC in expression of this searched gene in stem-like cells from each diseased tissue sample relative to stem-like cells in normal samples in each tissue plotted against the malignancy continuum. Samples are colored based on if they are from different disease stage. |
Top |
Malignant transformation related pathway analysis |
| Find out the enriched GO biological processes and KEGG pathways involved in transition from healthy to precancer to cancer |
| Tissue | Disease Stage | Enriched GO biological Processes |
| Colorectum | AD |  |
| Colorectum | SER |  |
| Colorectum | MSS |  |
| Colorectum | MSI-H |  |
| Colorectum | FAP |  |
| ∗Top 15 enriched GO BP terms are showed in the bar plot of each disease state in each tissue. Each row represents a significant GO biological process which is colored according to the -log10(p.adjust). |
| Page: 1 2 3 4 5 6 7 8 9 |
| GO ID | Tissue | Disease Stage | Description | Gene Ratio | Bg Ratio | pvalue | p.adjust | Count |
| Page: 1 |
| Pathway ID | Tissue | Disease Stage | Description | Gene Ratio | Bg Ratio | pvalue | p.adjust | qvalue | Count |
| Page: 1 |
Top |
Cell-cell communication analysis |
| Identification of potential cell-cell interactions between two cell types and their ligand-receptor pairs for different disease states |
| Ligand | Receptor | LRpair | Pathway | Tissue | Disease Stage |
| Page: 1 |
Top |
Single-cell gene regulatory network inference analysis |
| Find out the significant the regulons (TFs) and the target genes of each regulon across cell types for different disease states |
| TF | Cell Type | Tissue | Disease Stage | Target Gene | RSS | Regulon Activity |
| ∗The dot plots of a searched regulon are shown for all cell subpopulations in each disease state of each tissue based on the regulon specific score inferred using pySCENIC and by calculating the average expression. |
| Page: 1 |
Top |
Somatic mutation of malignant transformation related genes |
| Annotation of somatic variants for genes involved in malignant transformation |
| Hugo Symbol | Variant Class | Variant Classification | dbSNP RS | HGVSc | HGVSp | HGVSp Short | SWISSPROT | BIOTYPE | SIFT | PolyPhen | Tumor Sample Barcode | Tissue | Histology | Sex | Age | Stage | Therapy Types | Drugs | Outcome |
| MRPL50 | SNV | Missense_Mutation | c.365G>T | p.Arg122Met | p.R122M | Q8N5N7 | protein_coding | deleterious(0.04) | possibly_damaging(0.579) | TCGA-A8-A09Z-01 | Breast | breast invasive carcinoma | Female | >=65 | I/II | Unknown | Unknown | SD | |
| MRPL50 | SNV | Missense_Mutation | novel | c.97G>C | p.Glu33Gln | p.E33Q | Q8N5N7 | protein_coding | tolerated(0.11) | benign(0.006) | TCGA-C8-A3M7-01 | Breast | breast invasive carcinoma | Female | <65 | III/IV | Unknown | Unknown | PD |
| MRPL50 | insertion | Frame_Shift_Ins | novel | c.382_383insTAGT | p.Asp128ValfsTer5 | p.D128Vfs*5 | Q8N5N7 | protein_coding | TCGA-A7-A26I-01 | Breast | breast invasive carcinoma | Female | >=65 | I/II | Chemotherapy | cytoxan | SD | ||
| MRPL50 | SNV | Missense_Mutation | rs781375636 | c.298C>T | p.Leu100Phe | p.L100F | Q8N5N7 | protein_coding | tolerated(0.14) | benign(0.096) | TCGA-C5-A2LZ-01 | Cervix | cervical & endocervical cancer | Female | >=65 | III/IV | Unknown | Unknown | PD |
| MRPL50 | SNV | Missense_Mutation | c.392A>G | p.Asn131Ser | p.N131S | Q8N5N7 | protein_coding | tolerated(1) | benign(0.001) | TCGA-AA-A022-01 | Colorectum | colon adenocarcinoma | Female | >=65 | I/II | Unknown | Unknown | SD | |
| MRPL50 | SNV | Missense_Mutation | novel | c.299N>G | p.Leu100Arg | p.L100R | Q8N5N7 | protein_coding | deleterious(0) | probably_damaging(0.964) | TCGA-AZ-4315-01 | Colorectum | colon adenocarcinoma | Male | <65 | I/II | Unknown | Unknown | SD |
| MRPL50 | SNV | Missense_Mutation | rs143180617 | c.206N>A | p.Arg69His | p.R69H | Q8N5N7 | protein_coding | tolerated(0.32) | probably_damaging(0.938) | TCGA-A5-A0VP-01 | Endometrium | uterine corpus endometrioid carcinoma | Female | >=65 | I/II | Unknown | Unknown | SD |
| MRPL50 | SNV | Missense_Mutation | rs544635589 | c.283N>T | p.Arg95Cys | p.R95C | Q8N5N7 | protein_coding | deleterious(0.03) | possibly_damaging(0.761) | TCGA-A5-A1OF-01 | Endometrium | uterine corpus endometrioid carcinoma | Female | <65 | I/II | Unknown | Unknown | SD |
| MRPL50 | SNV | Missense_Mutation | novel | c.83N>A | p.Ser28Tyr | p.S28Y | Q8N5N7 | protein_coding | deleterious(0.01) | probably_damaging(0.993) | TCGA-AJ-A3EL-01 | Endometrium | uterine corpus endometrioid carcinoma | Female | <65 | I/II | Unknown | Unknown | SD |
| MRPL50 | SNV | Missense_Mutation | rs544635589 | c.283N>T | p.Arg95Cys | p.R95C | Q8N5N7 | protein_coding | deleterious(0.03) | possibly_damaging(0.761) | TCGA-AP-A051-01 | Endometrium | uterine corpus endometrioid carcinoma | Female | >=65 | I/II | Unknown | Unknown | SD |
| Page: 1 2 3 |
Top |
Related drugs of malignant transformation related genes |
| Identification of chemicals and drugs interact with genes involved in malignant transfromation |
| (DGIdb 4.0) |
| Entrez ID | Symbol | Category | Interaction Types | Drug Claim Name | Drug Name | PMIDs |
| Page: 1 |

Copyright 2023-Present -The University of Texas Health Science Center at Houston |