
|
|||||
|
 | |
| |
| |
| |
| |
| |
|
Gene: MRFAP1L1 |
Gene summary for MRFAP1L1 |
| Gene information | Species | Human | Gene symbol | MRFAP1L1 | Gene ID | 114932 |
| Gene name | Morf4 family associated protein 1 like 1 | |
| Gene Alias | PP784 | |
| Cytomap | 4p16.1 | |
| Gene Type | protein-coding | GO ID | GO:0003674 | UniProtAcc | A0A075DDR2 |
Top |
Malignant transformation analysis |
| Identification of the aberrant gene expression in precancerous and cancerous lesions by comparing the gene expression of stem-like cells in diseased tissues with normal stem cells |
| Entrez ID | Symbol | Replicates | Species | Organ | Tissue | Adj P-value | Log2FC | Malignancy |
| 114932 | MRFAP1L1 | P16T-E | Human | Esophagus | ESCC | 1.15e-35 | 7.39e-01 | 0.1153 |
| 114932 | MRFAP1L1 | P17T-E | Human | Esophagus | ESCC | 8.71e-11 | 4.81e-01 | 0.1278 |
| 114932 | MRFAP1L1 | P19T-E | Human | Esophagus | ESCC | 1.89e-03 | 3.38e-01 | 0.1662 |
| 114932 | MRFAP1L1 | P20T-E | Human | Esophagus | ESCC | 1.42e-23 | 3.88e-01 | 0.1124 |
| 114932 | MRFAP1L1 | P21T-E | Human | Esophagus | ESCC | 1.01e-17 | 2.96e-01 | 0.1617 |
| 114932 | MRFAP1L1 | P22T-E | Human | Esophagus | ESCC | 1.01e-27 | 4.28e-01 | 0.1236 |
| 114932 | MRFAP1L1 | P23T-E | Human | Esophagus | ESCC | 8.07e-20 | 5.29e-01 | 0.108 |
| 114932 | MRFAP1L1 | P24T-E | Human | Esophagus | ESCC | 7.52e-13 | 2.37e-01 | 0.1287 |
| 114932 | MRFAP1L1 | P26T-E | Human | Esophagus | ESCC | 2.31e-21 | 2.83e-01 | 0.1276 |
| 114932 | MRFAP1L1 | P27T-E | Human | Esophagus | ESCC | 2.13e-17 | 3.52e-01 | 0.1055 |
| 114932 | MRFAP1L1 | P28T-E | Human | Esophagus | ESCC | 1.27e-17 | 2.03e-01 | 0.1149 |
| 114932 | MRFAP1L1 | P30T-E | Human | Esophagus | ESCC | 2.49e-22 | 8.12e-01 | 0.137 |
| 114932 | MRFAP1L1 | P31T-E | Human | Esophagus | ESCC | 2.42e-26 | 5.55e-01 | 0.1251 |
| 114932 | MRFAP1L1 | P32T-E | Human | Esophagus | ESCC | 1.74e-26 | 5.65e-01 | 0.1666 |
| 114932 | MRFAP1L1 | P36T-E | Human | Esophagus | ESCC | 1.52e-12 | 5.10e-01 | 0.1187 |
| 114932 | MRFAP1L1 | P37T-E | Human | Esophagus | ESCC | 9.96e-21 | 3.46e-01 | 0.1371 |
| 114932 | MRFAP1L1 | P38T-E | Human | Esophagus | ESCC | 7.69e-08 | 5.74e-02 | 0.127 |
| 114932 | MRFAP1L1 | P39T-E | Human | Esophagus | ESCC | 5.23e-14 | 2.14e-01 | 0.0894 |
| 114932 | MRFAP1L1 | P40T-E | Human | Esophagus | ESCC | 1.78e-17 | 2.73e-01 | 0.109 |
| 114932 | MRFAP1L1 | P42T-E | Human | Esophagus | ESCC | 3.11e-16 | 3.48e-01 | 0.1175 |
| Page: 1 2 3 4 5 6 |
| Tissue | Expression Dynamics | Abbreviation |
| Esophagus | 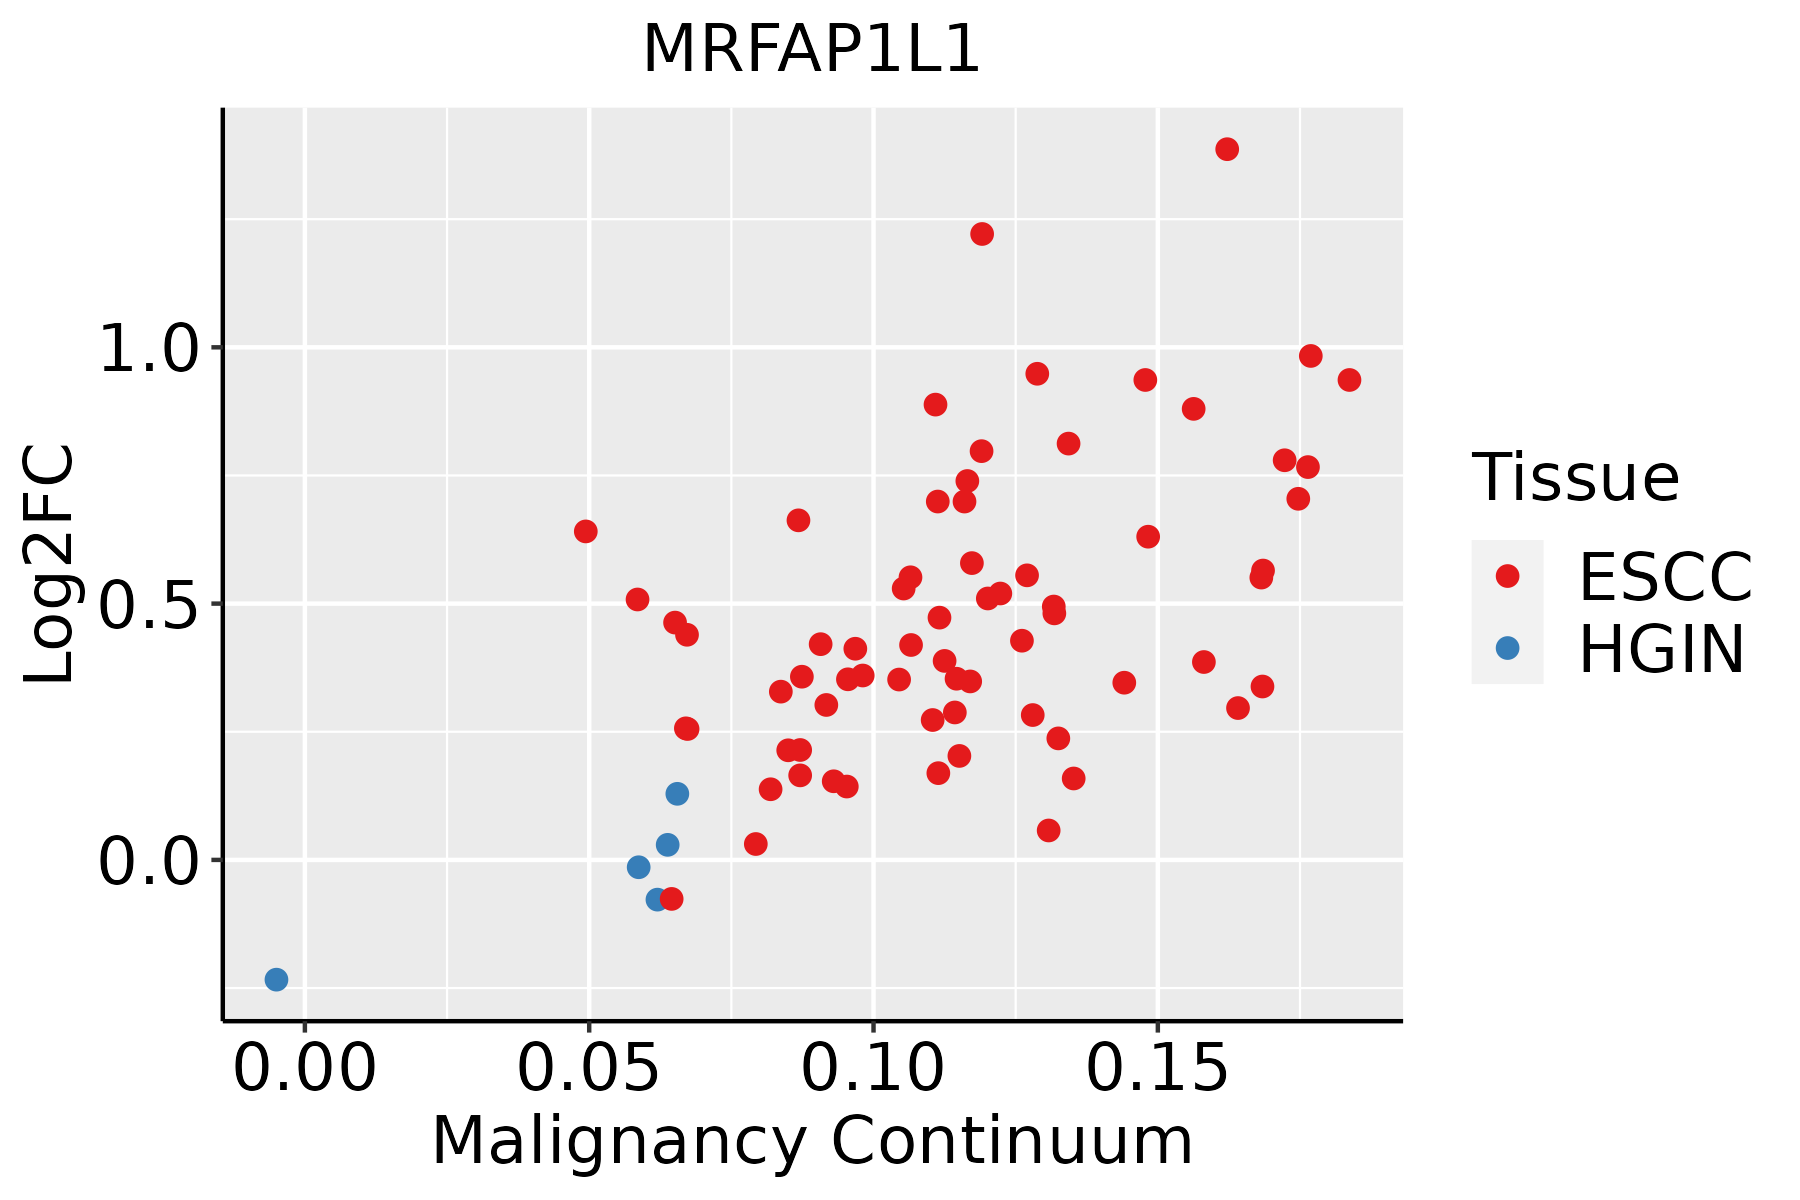 | ESCC: Esophageal squamous cell carcinoma |
| HGIN: High-grade intraepithelial neoplasias | ||
| LGIN: Low-grade intraepithelial neoplasias | ||
| Liver | 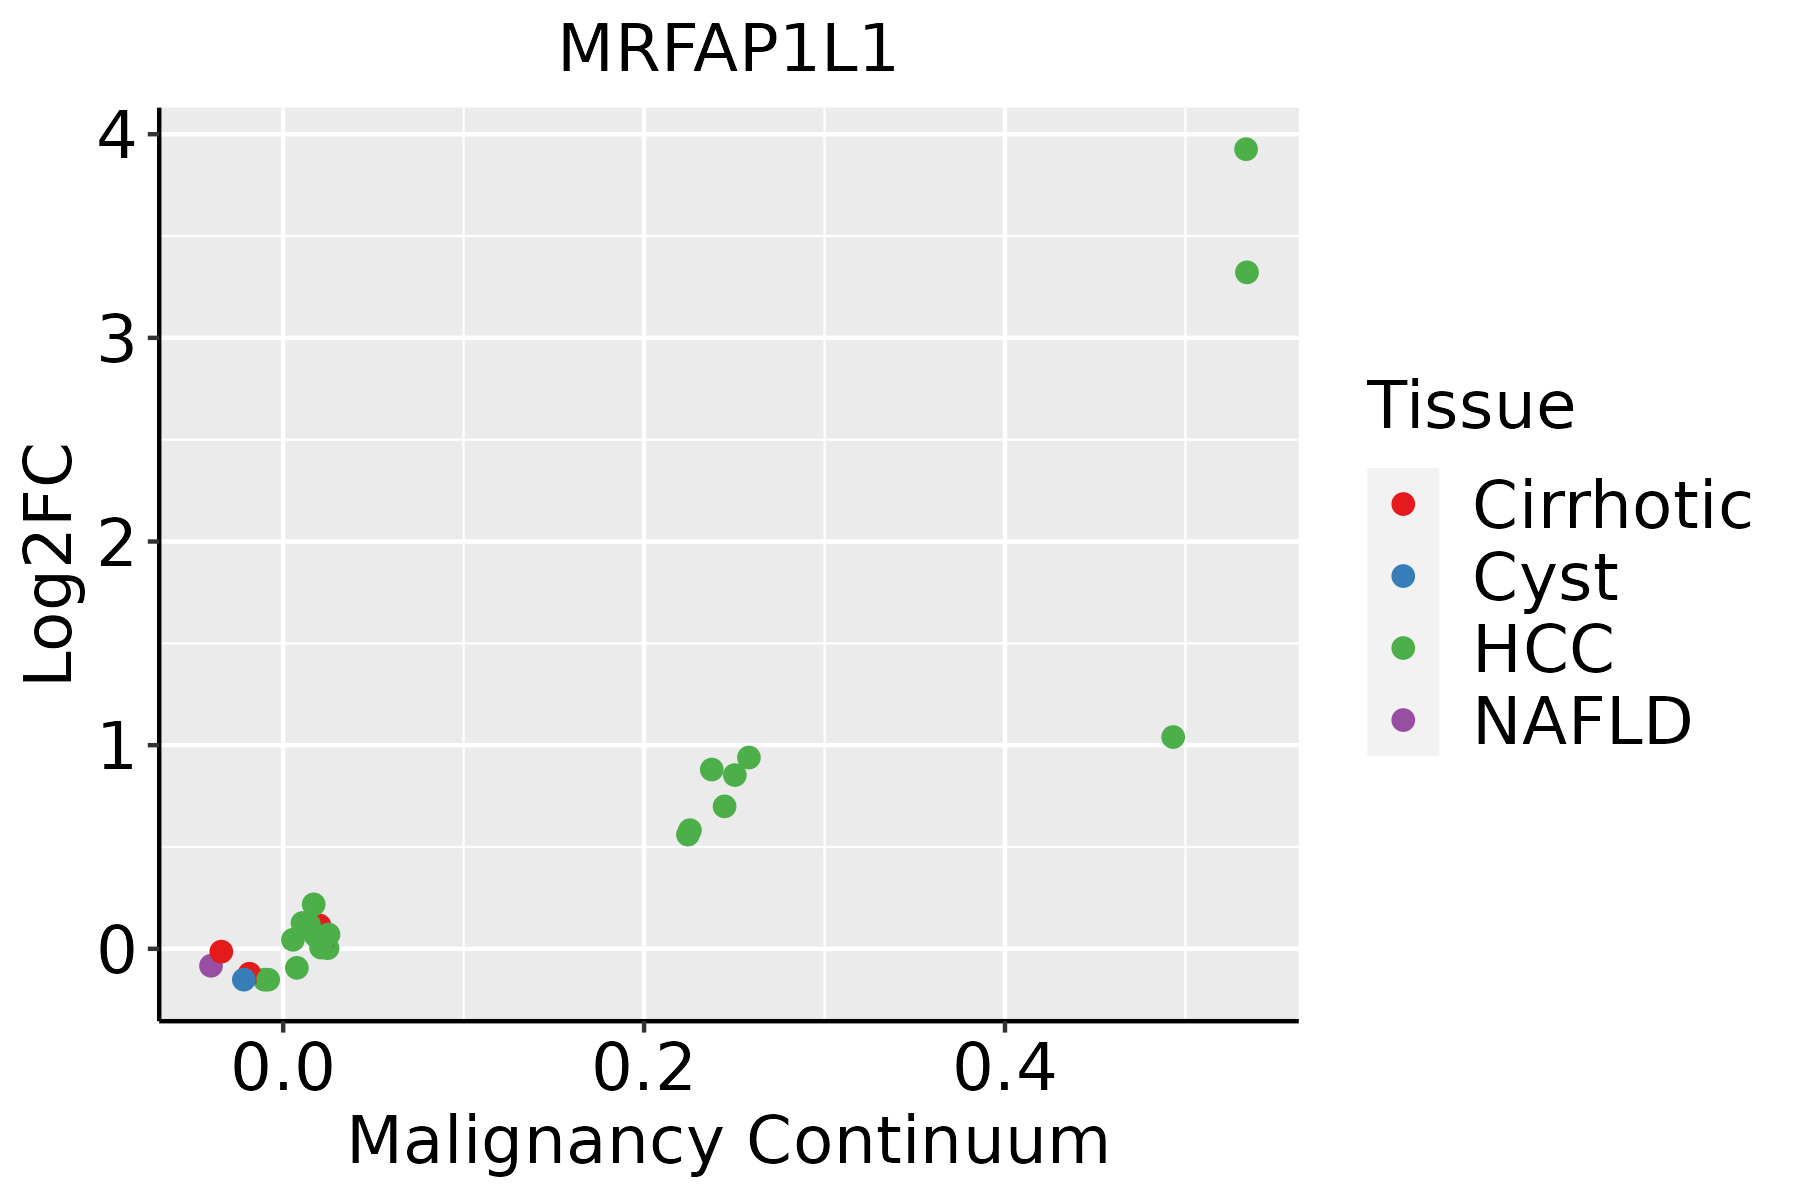 | HCC: Hepatocellular carcinoma |
| NAFLD: Non-alcoholic fatty liver disease | ||
| Oral Cavity | 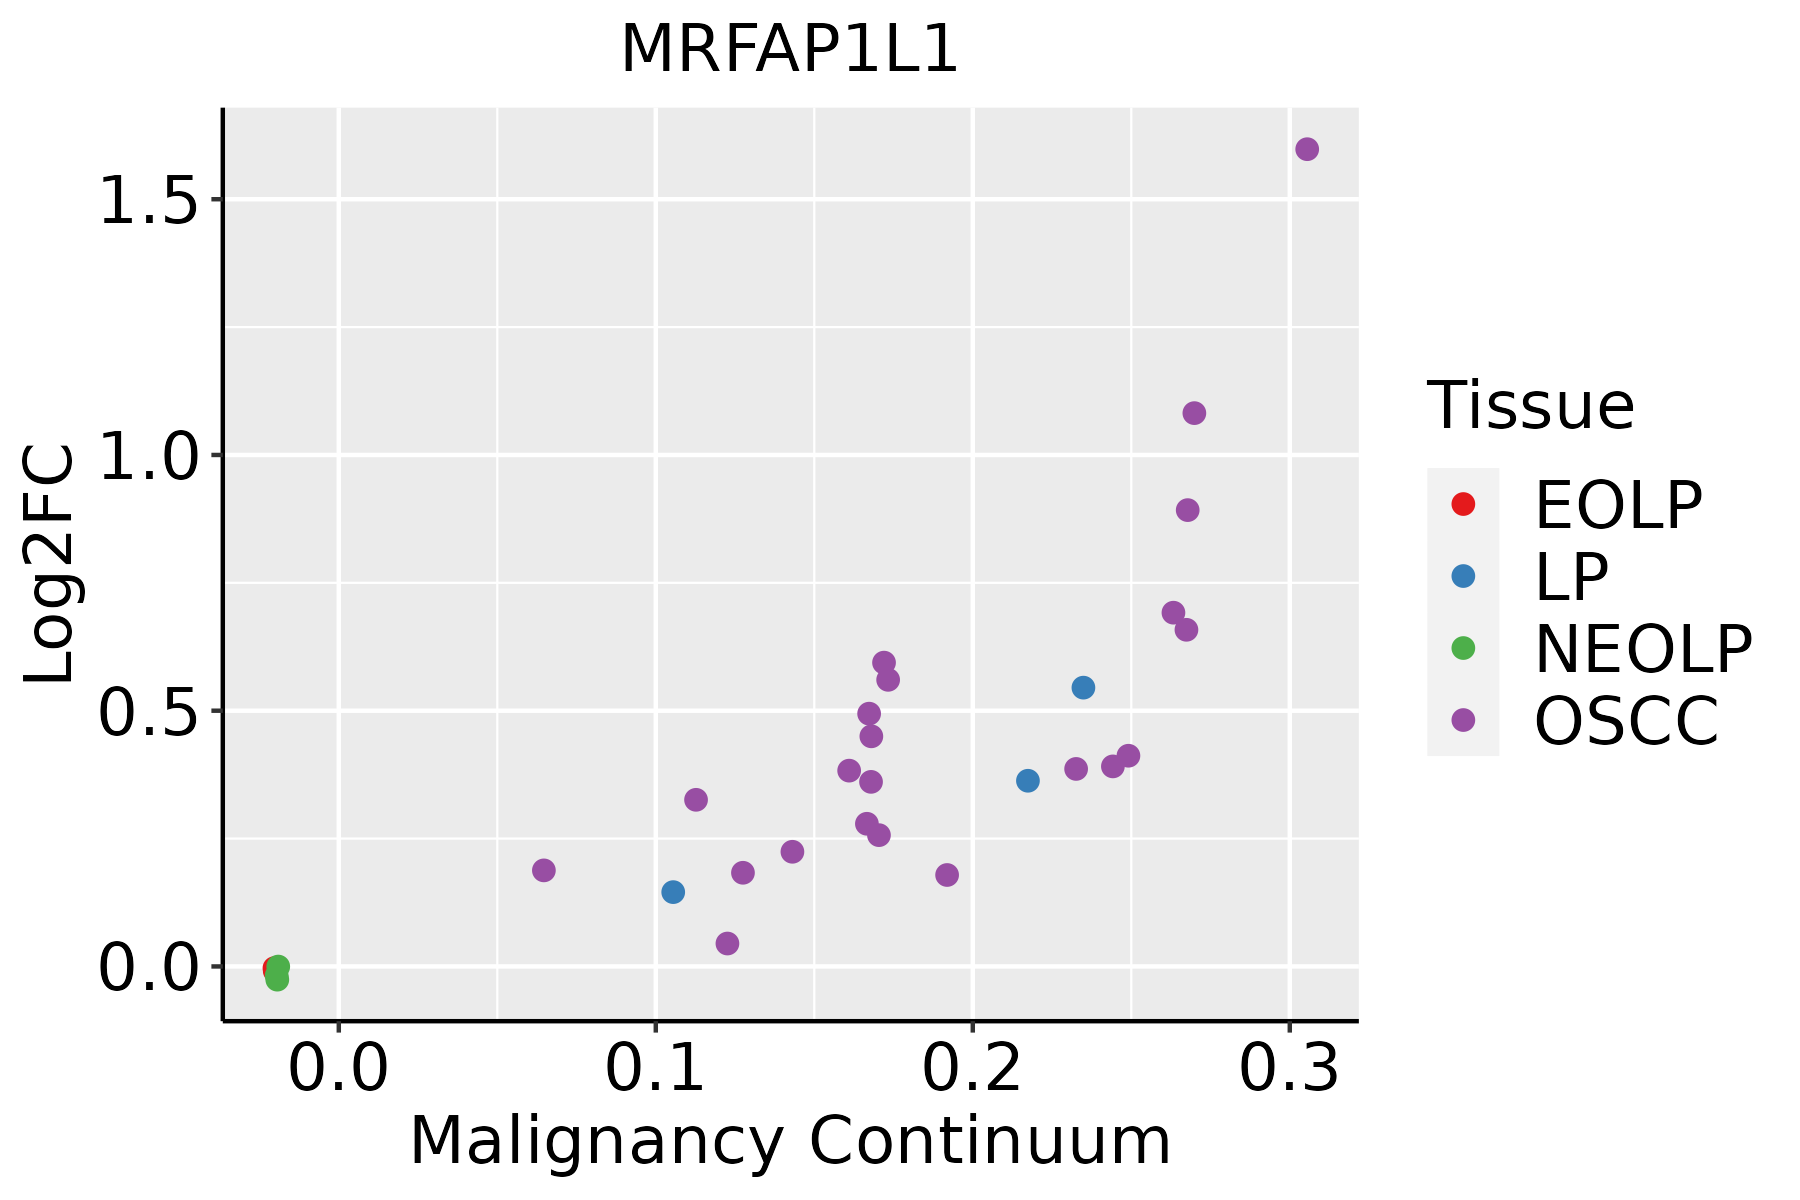 | EOLP: Erosive Oral lichen planus |
| LP: leukoplakia | ||
| NEOLP: Non-erosive oral lichen planus | ||
| OSCC: Oral squamous cell carcinoma | ||
| Prostate |  | BPH: Benign Prostatic Hyperplasia |
| Skin |  | AK: Actinic keratosis |
| cSCC: Cutaneous squamous cell carcinoma | ||
| SCCIS:squamous cell carcinoma in situ |
| ∗log2FC in expression of this searched gene in stem-like cells from each diseased tissue sample relative to stem-like cells in normal samples in each tissue plotted against the malignancy continuum. Samples are colored based on if they are from different disease stage. |
Top |
Malignant transformation related pathway analysis |
| Find out the enriched GO biological processes and KEGG pathways involved in transition from healthy to precancer to cancer |
| Tissue | Disease Stage | Enriched GO biological Processes |
| Colorectum | AD |  |
| Colorectum | SER |  |
| Colorectum | MSS |  |
| Colorectum | MSI-H |  |
| Colorectum | FAP |  |
| ∗Top 15 enriched GO BP terms are showed in the bar plot of each disease state in each tissue. Each row represents a significant GO biological process which is colored according to the -log10(p.adjust). |
| Page: 1 2 3 4 5 6 7 8 9 |
| GO ID | Tissue | Disease Stage | Description | Gene Ratio | Bg Ratio | pvalue | p.adjust | Count |
| Page: 1 |
| Pathway ID | Tissue | Disease Stage | Description | Gene Ratio | Bg Ratio | pvalue | p.adjust | qvalue | Count |
| Page: 1 |
Top |
Cell-cell communication analysis |
| Identification of potential cell-cell interactions between two cell types and their ligand-receptor pairs for different disease states |
| Ligand | Receptor | LRpair | Pathway | Tissue | Disease Stage |
| Page: 1 |
Top |
Single-cell gene regulatory network inference analysis |
| Find out the significant the regulons (TFs) and the target genes of each regulon across cell types for different disease states |
| TF | Cell Type | Tissue | Disease Stage | Target Gene | RSS | Regulon Activity |
| ∗The dot plots of a searched regulon are shown for all cell subpopulations in each disease state of each tissue based on the regulon specific score inferred using pySCENIC and by calculating the average expression. |
| Page: 1 |
Top |
Somatic mutation of malignant transformation related genes |
| Annotation of somatic variants for genes involved in malignant transformation |
| Hugo Symbol | Variant Class | Variant Classification | dbSNP RS | HGVSc | HGVSp | HGVSp Short | SWISSPROT | BIOTYPE | SIFT | PolyPhen | Tumor Sample Barcode | Tissue | Histology | Sex | Age | Stage | Therapy Types | Drugs | Outcome |
| MRFAP1L1 | SNV | Missense_Mutation | c.133N>A | p.Glu45Lys | p.E45K | Q96HT8 | protein_coding | tolerated(0.13) | benign(0.026) | TCGA-A2-A0CP-01 | Breast | breast invasive carcinoma | Female | <65 | I/II | Chemotherapy | cytoxan | SD | |
| MRFAP1L1 | insertion | Frame_Shift_Ins | novel | c.85_86insAG | p.Leu29GlnfsTer94 | p.L29Qfs*94 | Q96HT8 | protein_coding | TCGA-A8-A09Z-01 | Breast | breast invasive carcinoma | Female | >=65 | I/II | Unknown | Unknown | SD | ||
| MRFAP1L1 | insertion | Nonsense_Mutation | novel | c.84_85insTCTTCATGGTAAATTTCTCCCAATTGTGCTTTAGGTTCA | p.Leu28_Leu29insSerSerTrpTerIleSerProAsnCysAlaLeuGlySer | p.L28_L29insSSW*ISPNCALGS | Q96HT8 | protein_coding | TCGA-A8-A09Z-01 | Breast | breast invasive carcinoma | Female | >=65 | I/II | Unknown | Unknown | SD | ||
| MRFAP1L1 | SNV | Missense_Mutation | rs778160804 | c.4N>T | p.Arg2Trp | p.R2W | Q96HT8 | protein_coding | tolerated(0.1) | possibly_damaging(0.861) | TCGA-CK-4951-01 | Colorectum | colon adenocarcinoma | Female | >=65 | I/II | Unknown | Unknown | PD |
| MRFAP1L1 | SNV | Missense_Mutation | rs759990042 | c.289T>C | p.Cys97Arg | p.C97R | Q96HT8 | protein_coding | deleterious(0.01) | benign(0.196) | TCGA-DM-A1D6-01 | Colorectum | colon adenocarcinoma | Male | >=65 | I/II | Unknown | Unknown | SD |
| MRFAP1L1 | SNV | Missense_Mutation | c.81N>A | p.Phe27Leu | p.F27L | Q96HT8 | protein_coding | tolerated(0.31) | possibly_damaging(0.453) | TCGA-AJ-A3EK-01 | Endometrium | uterine corpus endometrioid carcinoma | Female | <65 | I/II | Chemotherapy | carboplatin | CR | |
| MRFAP1L1 | SNV | Missense_Mutation | novel | c.124N>A | p.Leu42Ile | p.L42I | Q96HT8 | protein_coding | deleterious(0.05) | possibly_damaging(0.616) | TCGA-AP-A0LS-01 | Endometrium | uterine corpus endometrioid carcinoma | Female | <65 | I/II | Unknown | Unknown | SD |
| MRFAP1L1 | SNV | Missense_Mutation | c.164G>T | p.Ser55Ile | p.S55I | Q96HT8 | protein_coding | tolerated(0.09) | possibly_damaging(0.625) | TCGA-BS-A0TC-01 | Endometrium | uterine corpus endometrioid carcinoma | Female | >=65 | I/II | Unknown | Unknown | SD | |
| MRFAP1L1 | SNV | Missense_Mutation | novel | c.348N>T | p.Glu116Asp | p.E116D | Q96HT8 | protein_coding | deleterious(0.04) | benign(0.081) | TCGA-FI-A2D5-01 | Endometrium | uterine corpus endometrioid carcinoma | Female | <65 | III/IV | Chemotherapy | carboplatinum | PD |
| MRFAP1L1 | SNV | Missense_Mutation | novel | c.34N>T | p.Pro12Ser | p.P12S | Q96HT8 | protein_coding | tolerated(0.09) | probably_damaging(0.996) | TCGA-FI-A2D5-01 | Endometrium | uterine corpus endometrioid carcinoma | Female | <65 | III/IV | Chemotherapy | carboplatinum | PD |
| Page: 1 2 |
Top |
Related drugs of malignant transformation related genes |
| Identification of chemicals and drugs interact with genes involved in malignant transfromation |
| (DGIdb 4.0) |
| Entrez ID | Symbol | Category | Interaction Types | Drug Claim Name | Drug Name | PMIDs |
| Page: 1 |

Copyright 2023-Present -The University of Texas Health Science Center at Houston |