
|
|||||
|
 | |
| |
| |
| |
| |
| |
|
Gene: MORC4 |
Gene summary for MORC4 |
| Gene information | Species | Human | Gene symbol | MORC4 | Gene ID | 79710 |
| Gene name | MORC family CW-type zinc finger 4 | |
| Gene Alias | ZCW4 | |
| Cytomap | Xq22.3 | |
| Gene Type | protein-coding | GO ID | GO:0005575 | UniProtAcc | B4DTP6 |
Top |
Malignant transformation analysis |
| Identification of the aberrant gene expression in precancerous and cancerous lesions by comparing the gene expression of stem-like cells in diseased tissues with normal stem cells |
| Entrez ID | Symbol | Replicates | Species | Organ | Tissue | Adj P-value | Log2FC | Malignancy |
| 79710 | MORC4 | P32T-E | Human | Esophagus | ESCC | 3.65e-05 | 6.80e-02 | 0.1666 |
| 79710 | MORC4 | P37T-E | Human | Esophagus | ESCC | 1.09e-02 | 1.18e-01 | 0.1371 |
| 79710 | MORC4 | P39T-E | Human | Esophagus | ESCC | 1.72e-04 | 8.21e-02 | 0.0894 |
| 79710 | MORC4 | P42T-E | Human | Esophagus | ESCC | 1.77e-03 | 1.99e-01 | 0.1175 |
| 79710 | MORC4 | P44T-E | Human | Esophagus | ESCC | 3.78e-04 | 1.22e-01 | 0.1096 |
| 79710 | MORC4 | P47T-E | Human | Esophagus | ESCC | 3.51e-13 | 2.07e-01 | 0.1067 |
| 79710 | MORC4 | P48T-E | Human | Esophagus | ESCC | 8.11e-09 | 1.08e-01 | 0.0959 |
| 79710 | MORC4 | P49T-E | Human | Esophagus | ESCC | 9.94e-05 | 3.83e-01 | 0.1768 |
| 79710 | MORC4 | P52T-E | Human | Esophagus | ESCC | 7.16e-12 | 2.30e-01 | 0.1555 |
| 79710 | MORC4 | P54T-E | Human | Esophagus | ESCC | 7.53e-05 | 1.06e-01 | 0.0975 |
| 79710 | MORC4 | P57T-E | Human | Esophagus | ESCC | 2.08e-03 | 6.79e-02 | 0.0926 |
| 79710 | MORC4 | P61T-E | Human | Esophagus | ESCC | 3.02e-07 | 1.98e-01 | 0.099 |
| 79710 | MORC4 | P62T-E | Human | Esophagus | ESCC | 9.78e-04 | 7.73e-02 | 0.1302 |
| 79710 | MORC4 | P65T-E | Human | Esophagus | ESCC | 1.64e-04 | 1.57e-01 | 0.0978 |
| 79710 | MORC4 | P74T-E | Human | Esophagus | ESCC | 4.01e-02 | 9.86e-02 | 0.1479 |
| 79710 | MORC4 | P75T-E | Human | Esophagus | ESCC | 1.57e-03 | 1.03e-01 | 0.1125 |
| 79710 | MORC4 | P76T-E | Human | Esophagus | ESCC | 5.57e-08 | 6.15e-02 | 0.1207 |
| 79710 | MORC4 | P79T-E | Human | Esophagus | ESCC | 7.36e-05 | 7.19e-02 | 0.1154 |
| 79710 | MORC4 | P80T-E | Human | Esophagus | ESCC | 4.18e-10 | 3.29e-01 | 0.155 |
| 79710 | MORC4 | P83T-E | Human | Esophagus | ESCC | 4.14e-13 | 3.91e-01 | 0.1738 |
| Page: 1 2 3 4 |
| Tissue | Expression Dynamics | Abbreviation |
| Esophagus | 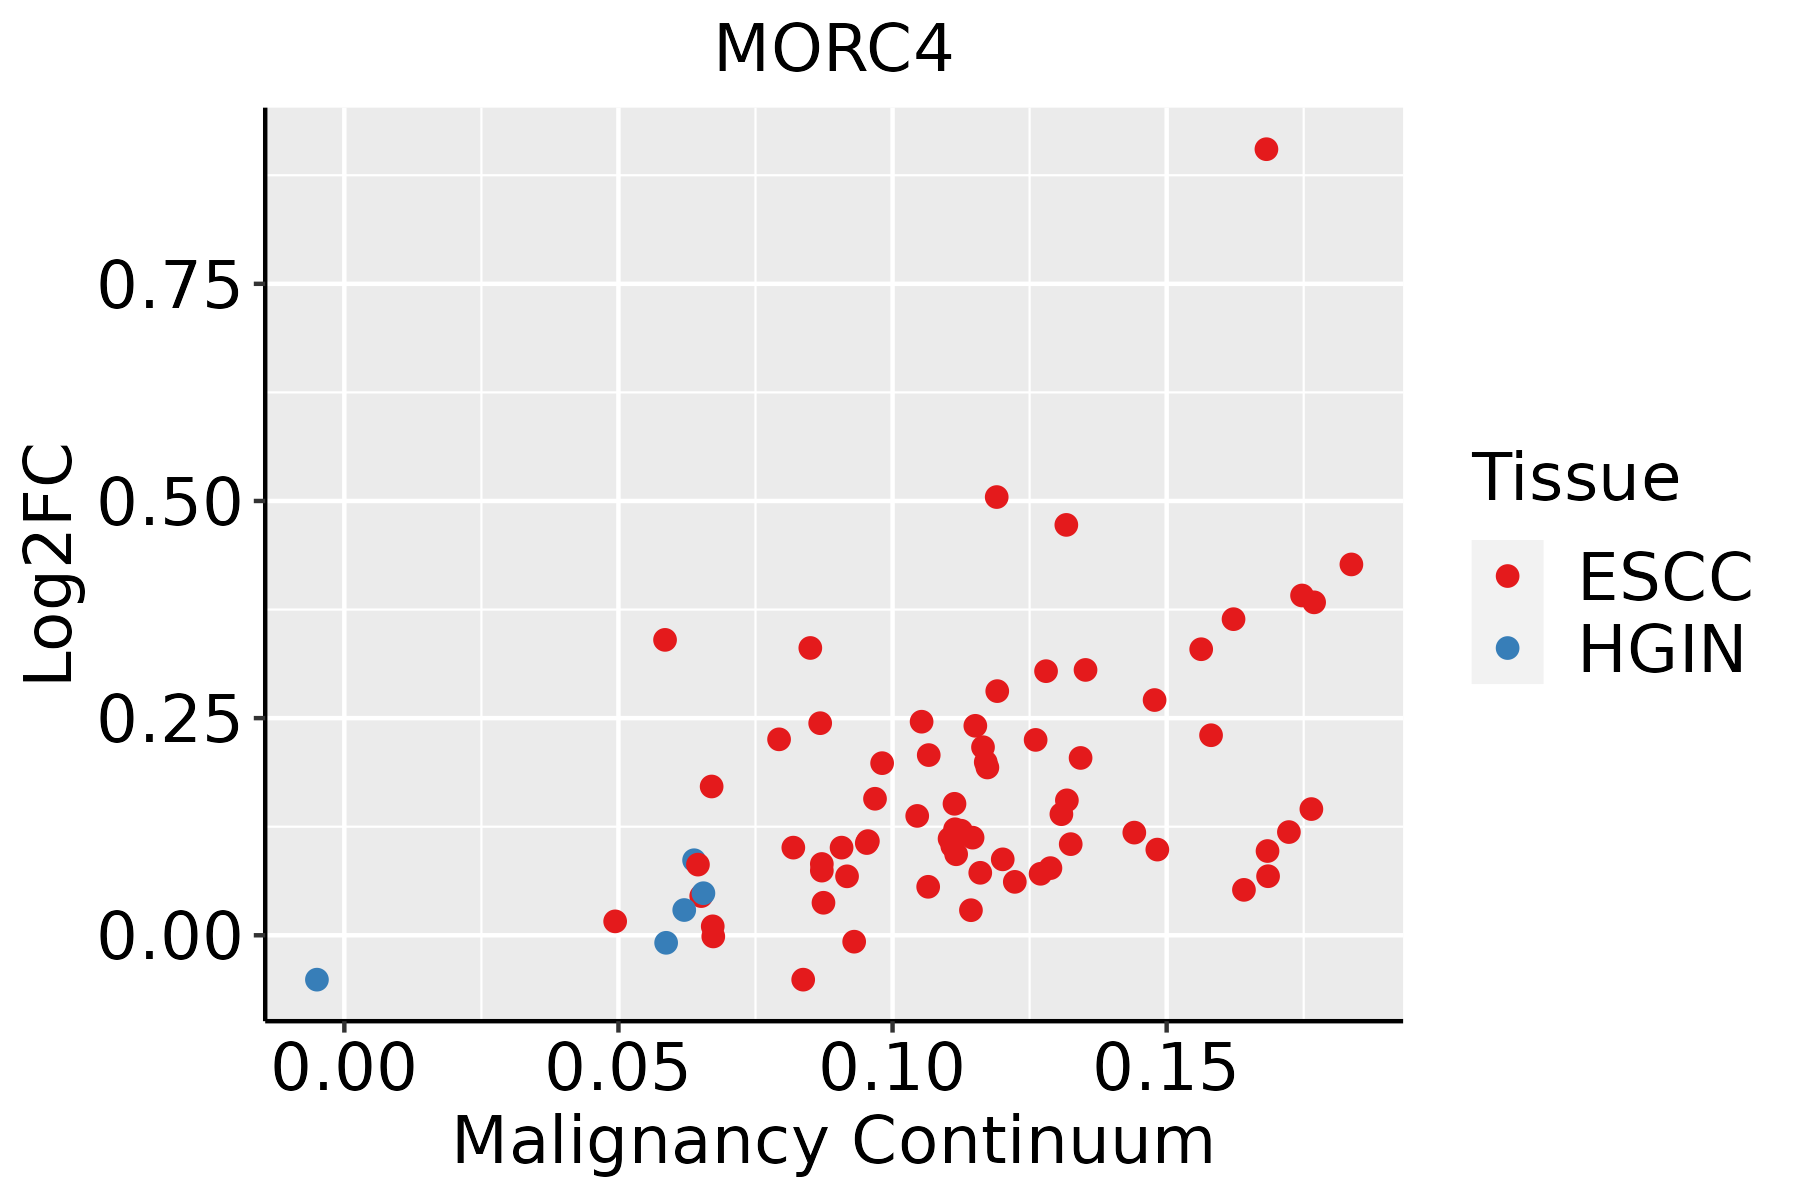 | ESCC: Esophageal squamous cell carcinoma |
| HGIN: High-grade intraepithelial neoplasias | ||
| LGIN: Low-grade intraepithelial neoplasias | ||
| Liver | 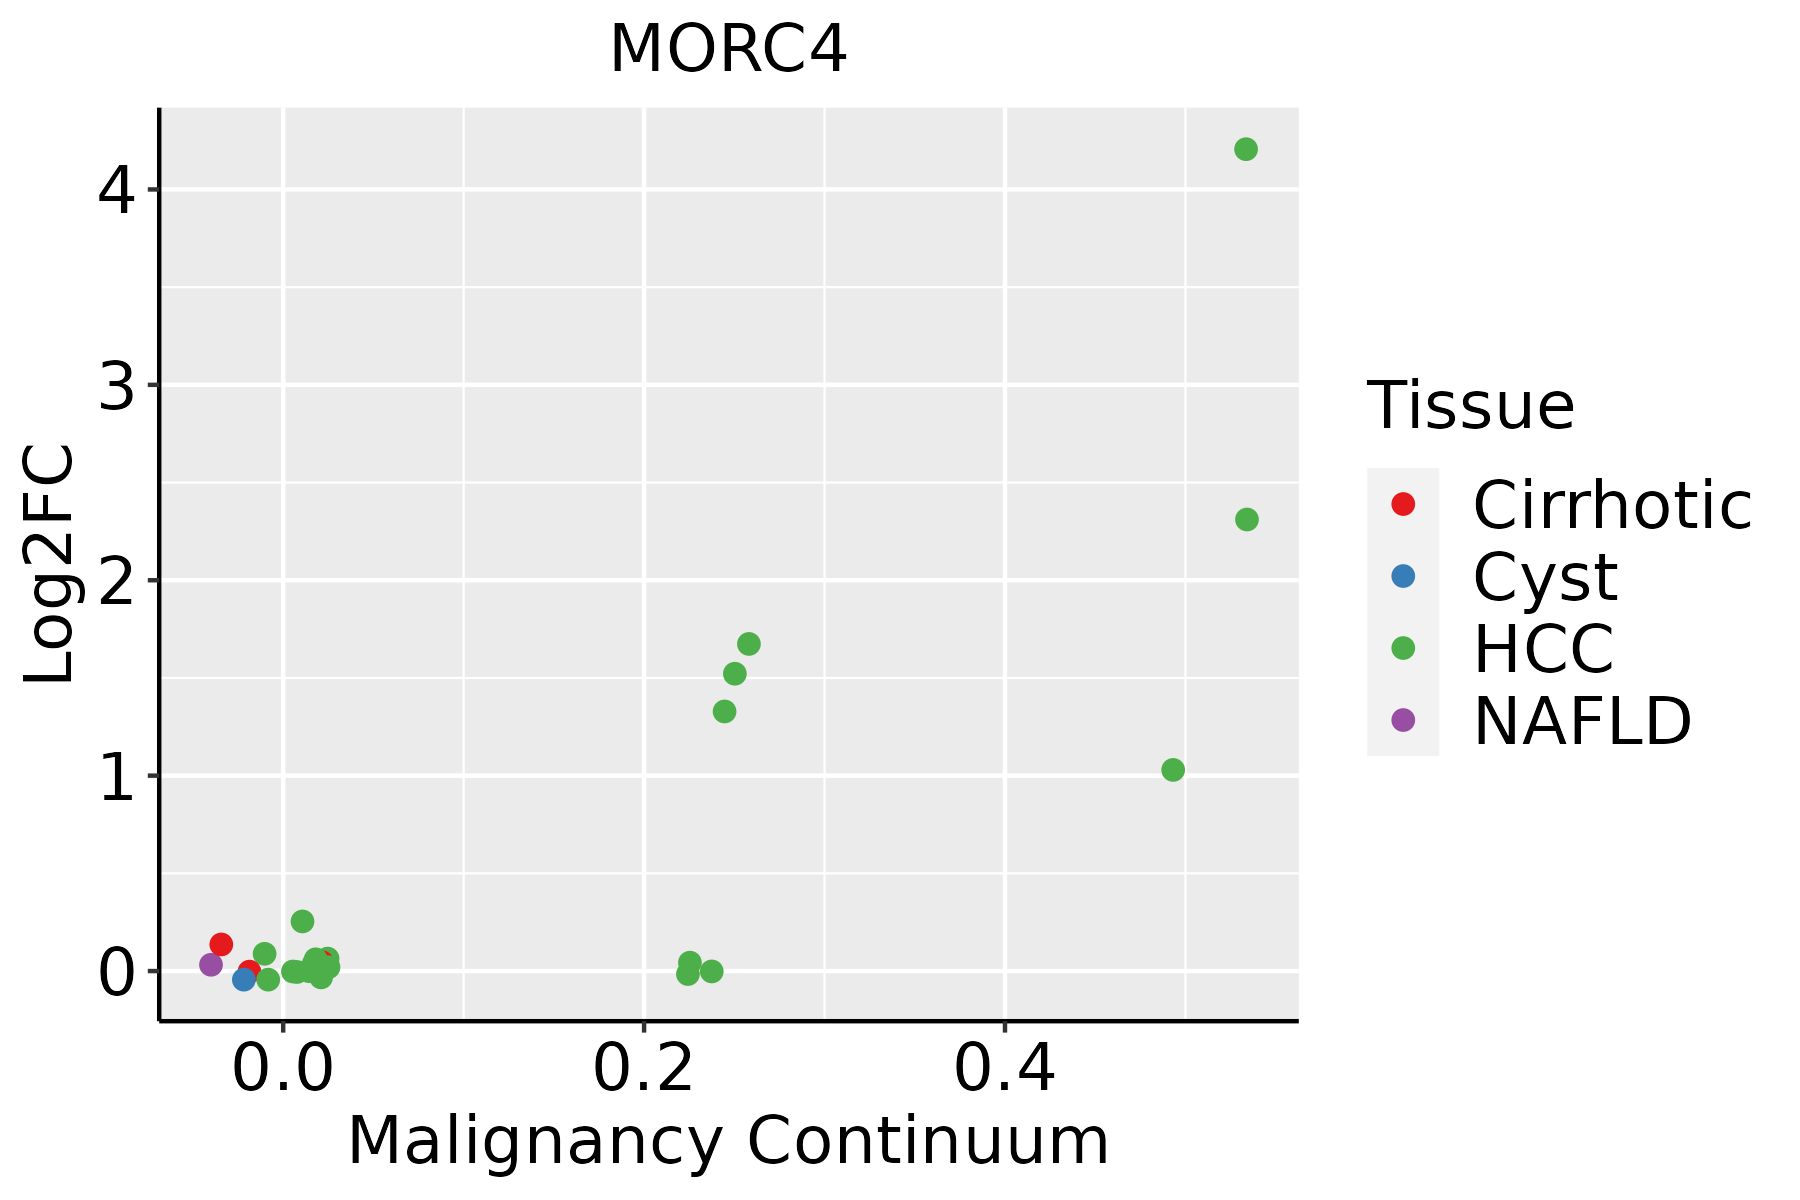 | HCC: Hepatocellular carcinoma |
| NAFLD: Non-alcoholic fatty liver disease | ||
| Oral Cavity | 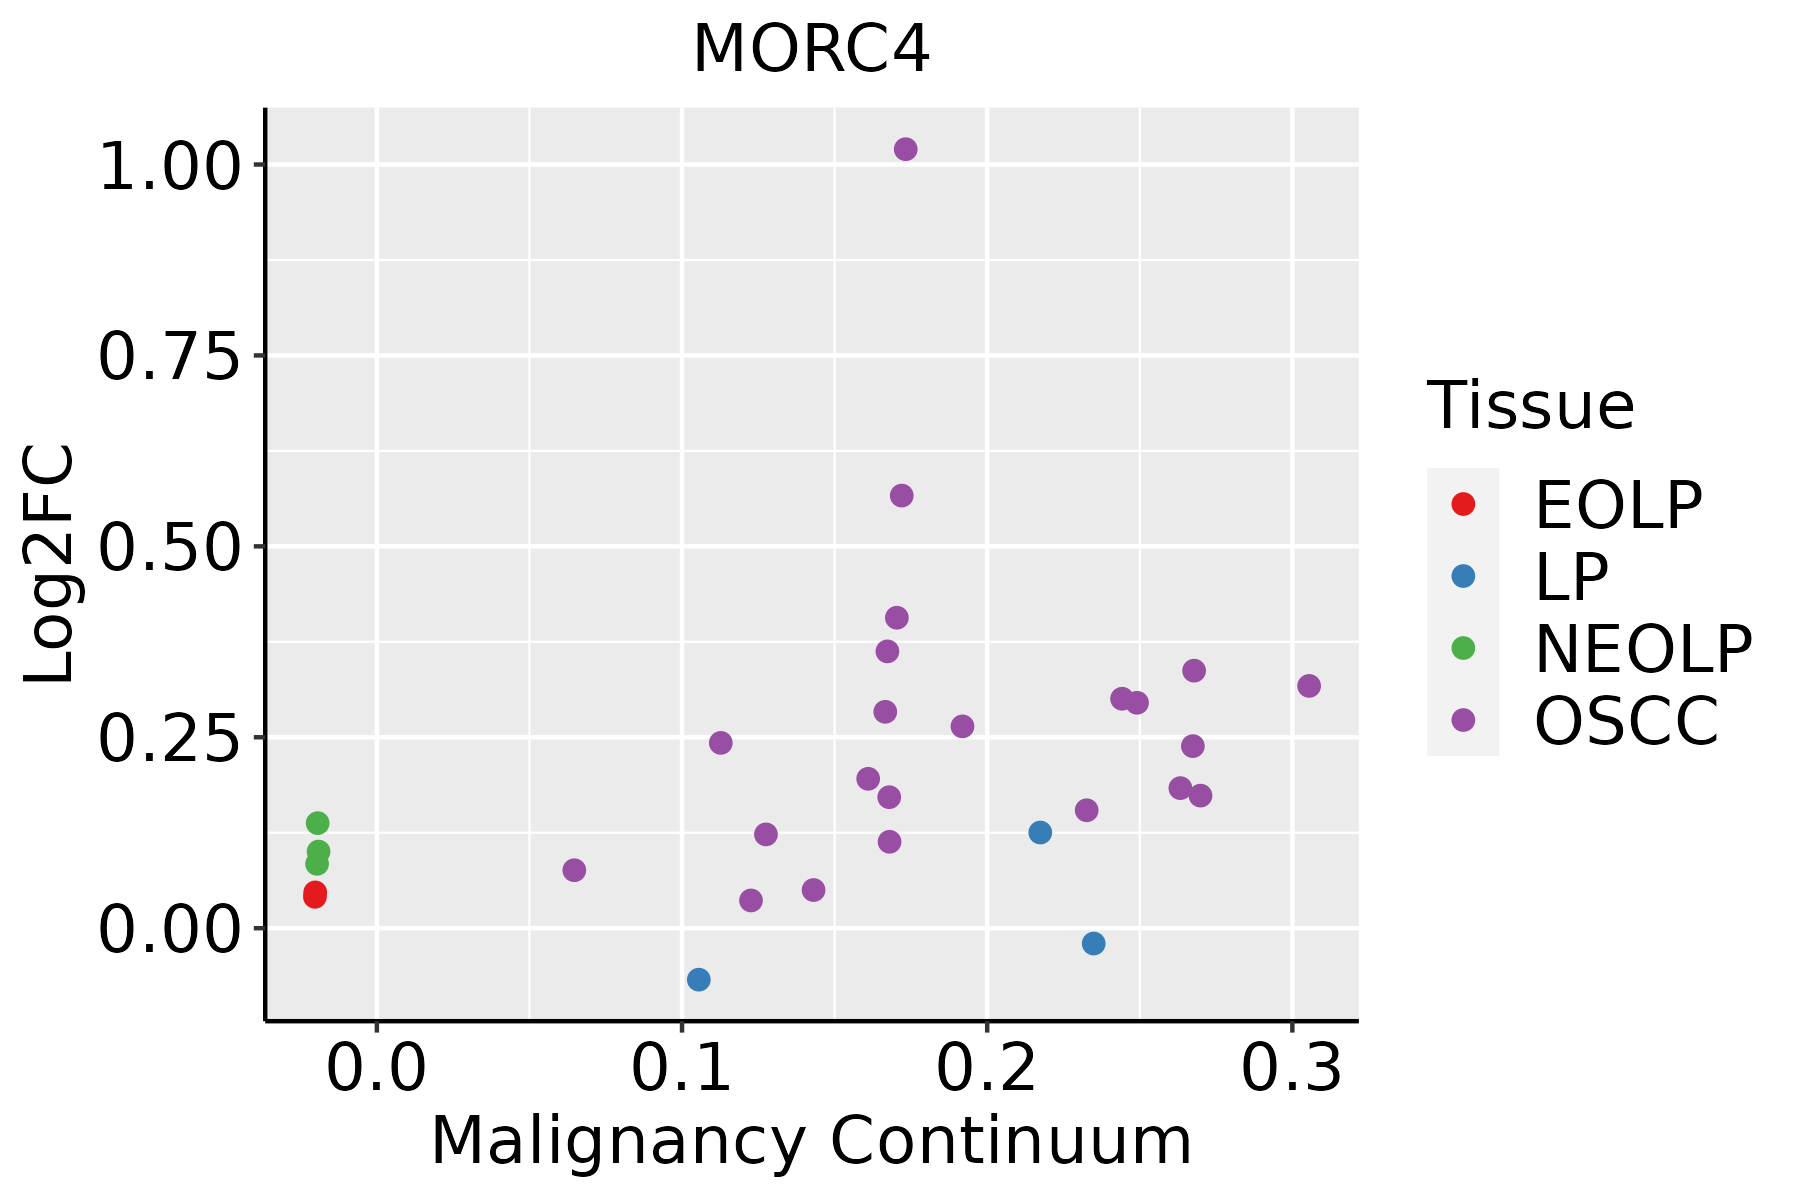 | EOLP: Erosive Oral lichen planus |
| LP: leukoplakia | ||
| NEOLP: Non-erosive oral lichen planus | ||
| OSCC: Oral squamous cell carcinoma | ||
| Thyroid |  | ATC: Anaplastic thyroid cancer |
| HT: Hashimoto's thyroiditis | ||
| PTC: Papillary thyroid cancer |
| ∗log2FC in expression of this searched gene in stem-like cells from each diseased tissue sample relative to stem-like cells in normal samples in each tissue plotted against the malignancy continuum. Samples are colored based on if they are from different disease stage. |
Top |
Malignant transformation related pathway analysis |
| Find out the enriched GO biological processes and KEGG pathways involved in transition from healthy to precancer to cancer |
| Tissue | Disease Stage | Enriched GO biological Processes |
| Colorectum | AD |  |
| Colorectum | SER |  |
| Colorectum | MSS |  |
| Colorectum | MSI-H |  |
| Colorectum | FAP |  |
| ∗Top 15 enriched GO BP terms are showed in the bar plot of each disease state in each tissue. Each row represents a significant GO biological process which is colored according to the -log10(p.adjust). |
| Page: 1 2 3 4 5 6 7 8 9 |
| GO ID | Tissue | Disease Stage | Description | Gene Ratio | Bg Ratio | pvalue | p.adjust | Count |
| Page: 1 |
| Pathway ID | Tissue | Disease Stage | Description | Gene Ratio | Bg Ratio | pvalue | p.adjust | qvalue | Count |
| Page: 1 |
Top |
Cell-cell communication analysis |
| Identification of potential cell-cell interactions between two cell types and their ligand-receptor pairs for different disease states |
| Ligand | Receptor | LRpair | Pathway | Tissue | Disease Stage |
| Page: 1 |
Top |
Single-cell gene regulatory network inference analysis |
| Find out the significant the regulons (TFs) and the target genes of each regulon across cell types for different disease states |
| TF | Cell Type | Tissue | Disease Stage | Target Gene | RSS | Regulon Activity |
| ∗The dot plots of a searched regulon are shown for all cell subpopulations in each disease state of each tissue based on the regulon specific score inferred using pySCENIC and by calculating the average expression. |
| Page: 1 |
Top |
Somatic mutation of malignant transformation related genes |
| Annotation of somatic variants for genes involved in malignant transformation |
| Hugo Symbol | Variant Class | Variant Classification | dbSNP RS | HGVSc | HGVSp | HGVSp Short | SWISSPROT | BIOTYPE | SIFT | PolyPhen | Tumor Sample Barcode | Tissue | Histology | Sex | Age | Stage | Therapy Types | Drugs | Outcome |
| MORC4 | SNV | Missense_Mutation | rs777953821 | c.1772N>G | p.Ser591Cys | p.S591C | Q8TE76 | protein_coding | deleterious(0) | probably_damaging(0.993) | TCGA-AC-A23H-01 | Breast | breast invasive carcinoma | Female | >=65 | I/II | Unknown | Unknown | PD |
| MORC4 | SNV | Missense_Mutation | c.386N>A | p.Ser129Tyr | p.S129Y | Q8TE76 | protein_coding | deleterious(0) | probably_damaging(0.998) | TCGA-AO-A0JA-01 | Breast | breast invasive carcinoma | Female | <65 | III/IV | Hormone Therapy | leuprolide | SD | |
| MORC4 | SNV | Missense_Mutation | c.1014N>A | p.Asn338Lys | p.N338K | Q8TE76 | protein_coding | deleterious(0) | benign(0.272) | TCGA-BH-A204-01 | Breast | breast invasive carcinoma | Female | >=65 | I/II | Unknown | Unknown | SD | |
| MORC4 | insertion | Frame_Shift_Ins | novel | c.1390_1391insCACCTCTCTGCTCTCCCAGTTCTTTATTC | p.Cys464SerfsTer26 | p.C464Sfs*26 | Q8TE76 | protein_coding | TCGA-AO-A0JB-01 | Breast | breast invasive carcinoma | Female | <65 | III/IV | Chemotherapy | cyclophosphamide | SD | ||
| MORC4 | insertion | Nonsense_Mutation | novel | c.872_873insCCATTTGTTATAGGGTTTTGATGCAAGTAGCTTGTCTTT | p.Thr291_Thr292insHisLeuLeuTerGlyPheAspAlaSerSerLeuSerPhe | p.T291_T292insHLL*GFDASSLSF | Q8TE76 | protein_coding | TCGA-B6-A0I6-01 | Breast | breast invasive carcinoma | Female | <65 | I/II | Unknown | Unknown | PD | ||
| MORC4 | deletion | Frame_Shift_Del | c.1492delG | p.Glu498LysfsTer23 | p.E498Kfs*23 | Q8TE76 | protein_coding | TCGA-D8-A27V-01 | Breast | breast invasive carcinoma | Female | <65 | I/II | Hormone Therapy | tamoxiphen | SD | |||
| MORC4 | SNV | Missense_Mutation | novel | c.423N>T | p.Lys141Asn | p.K141N | Q8TE76 | protein_coding | deleterious(0) | probably_damaging(0.999) | TCGA-2W-A8YY-01 | Cervix | cervical & endocervical cancer | Female | <65 | I/II | Chemotherapy | cisplatin | CR |
| MORC4 | SNV | Missense_Mutation | novel | c.2647N>A | p.Asp883Asn | p.D883N | Q8TE76 | protein_coding | tolerated(0.09) | possibly_damaging(0.604) | TCGA-C5-A1MP-01 | Cervix | cervical & endocervical cancer | Female | <65 | I/II | Unknown | Unknown | SD |
| MORC4 | SNV | Missense_Mutation | novel | c.854N>G | p.Leu285Arg | p.L285R | Q8TE76 | protein_coding | deleterious(0) | probably_damaging(0.997) | TCGA-C5-A8ZZ-01 | Cervix | cervical & endocervical cancer | Female | <65 | I/II | Unspecific | Cisplatin | SD |
| MORC4 | SNV | Missense_Mutation | novel | c.1052T>G | p.Val351Gly | p.V351G | Q8TE76 | protein_coding | tolerated(0.05) | possibly_damaging(0.47) | TCGA-EK-A2RM-01 | Cervix | cervical & endocervical cancer | Female | <65 | I/II | Unknown | Unknown | SD |
| Page: 1 2 3 4 5 6 7 8 9 10 11 12 13 14 |
Top |
Related drugs of malignant transformation related genes |
| Identification of chemicals and drugs interact with genes involved in malignant transfromation |
| (DGIdb 4.0) |
| Entrez ID | Symbol | Category | Interaction Types | Drug Claim Name | Drug Name | PMIDs |
| Page: 1 |

Copyright 2023-Present -The University of Texas Health Science Center at Houston |