
|
|||||
|
 | |
| |
| |
| |
| |
| |
|
Gene: MLLT4 |
Gene summary for MLLT4 |
| Gene information | Species | Human | Gene symbol | MLLT4 | Gene ID | 4301 |
| Gene name | afadin, adherens junction formation factor | |
| Gene Alias | AF6 | |
| Cytomap | 6q27 | |
| Gene Type | protein-coding | GO ID | GO:0001885 | UniProtAcc | P55196 |
Top |
Malignant transformation analysis |
| Identification of the aberrant gene expression in precancerous and cancerous lesions by comparing the gene expression of stem-like cells in diseased tissues with normal stem cells |
| Entrez ID | Symbol | Replicates | Species | Organ | Tissue | Adj P-value | Log2FC | Malignancy |
| 4301 | MLLT4 | P22T-E | Human | Esophagus | ESCC | 3.60e-13 | 2.61e-01 | 0.1236 |
| 4301 | MLLT4 | P23T-E | Human | Esophagus | ESCC | 4.96e-26 | 6.20e-01 | 0.108 |
| 4301 | MLLT4 | P24T-E | Human | Esophagus | ESCC | 1.85e-18 | 4.68e-01 | 0.1287 |
| 4301 | MLLT4 | P26T-E | Human | Esophagus | ESCC | 6.89e-44 | 7.24e-01 | 0.1276 |
| 4301 | MLLT4 | P27T-E | Human | Esophagus | ESCC | 1.85e-18 | 3.76e-01 | 0.1055 |
| 4301 | MLLT4 | P28T-E | Human | Esophagus | ESCC | 1.72e-54 | 9.61e-01 | 0.1149 |
| 4301 | MLLT4 | P30T-E | Human | Esophagus | ESCC | 4.37e-20 | 5.05e-01 | 0.137 |
| 4301 | MLLT4 | P31T-E | Human | Esophagus | ESCC | 1.97e-10 | 2.23e-01 | 0.1251 |
| 4301 | MLLT4 | P32T-E | Human | Esophagus | ESCC | 1.13e-16 | 2.93e-01 | 0.1666 |
| 4301 | MLLT4 | P36T-E | Human | Esophagus | ESCC | 1.14e-17 | 5.12e-01 | 0.1187 |
| 4301 | MLLT4 | P37T-E | Human | Esophagus | ESCC | 9.95e-30 | 5.37e-01 | 0.1371 |
| 4301 | MLLT4 | P38T-E | Human | Esophagus | ESCC | 4.54e-11 | 3.85e-01 | 0.127 |
| 4301 | MLLT4 | P39T-E | Human | Esophagus | ESCC | 8.96e-45 | 8.08e-01 | 0.0894 |
| 4301 | MLLT4 | P40T-E | Human | Esophagus | ESCC | 1.39e-20 | 4.74e-01 | 0.109 |
| 4301 | MLLT4 | P42T-E | Human | Esophagus | ESCC | 3.60e-12 | 2.82e-01 | 0.1175 |
| 4301 | MLLT4 | P44T-E | Human | Esophagus | ESCC | 2.31e-16 | 4.39e-01 | 0.1096 |
| 4301 | MLLT4 | P47T-E | Human | Esophagus | ESCC | 1.62e-13 | 2.36e-01 | 0.1067 |
| 4301 | MLLT4 | P48T-E | Human | Esophagus | ESCC | 5.95e-29 | 4.88e-01 | 0.0959 |
| 4301 | MLLT4 | P49T-E | Human | Esophagus | ESCC | 3.28e-15 | 9.80e-01 | 0.1768 |
| 4301 | MLLT4 | P52T-E | Human | Esophagus | ESCC | 1.49e-39 | 6.16e-01 | 0.1555 |
| Page: 1 2 3 4 5 6 |
| Tissue | Expression Dynamics | Abbreviation |
| Colorectum (GSE201348) |  | FAP: Familial adenomatous polyposis |
| CRC: Colorectal cancer | ||
| Colorectum (HTA11) |  | AD: Adenomas |
| SER: Sessile serrated lesions | ||
| MSI-H: Microsatellite-high colorectal cancer | ||
| MSS: Microsatellite stable colorectal cancer | ||
| Esophagus | 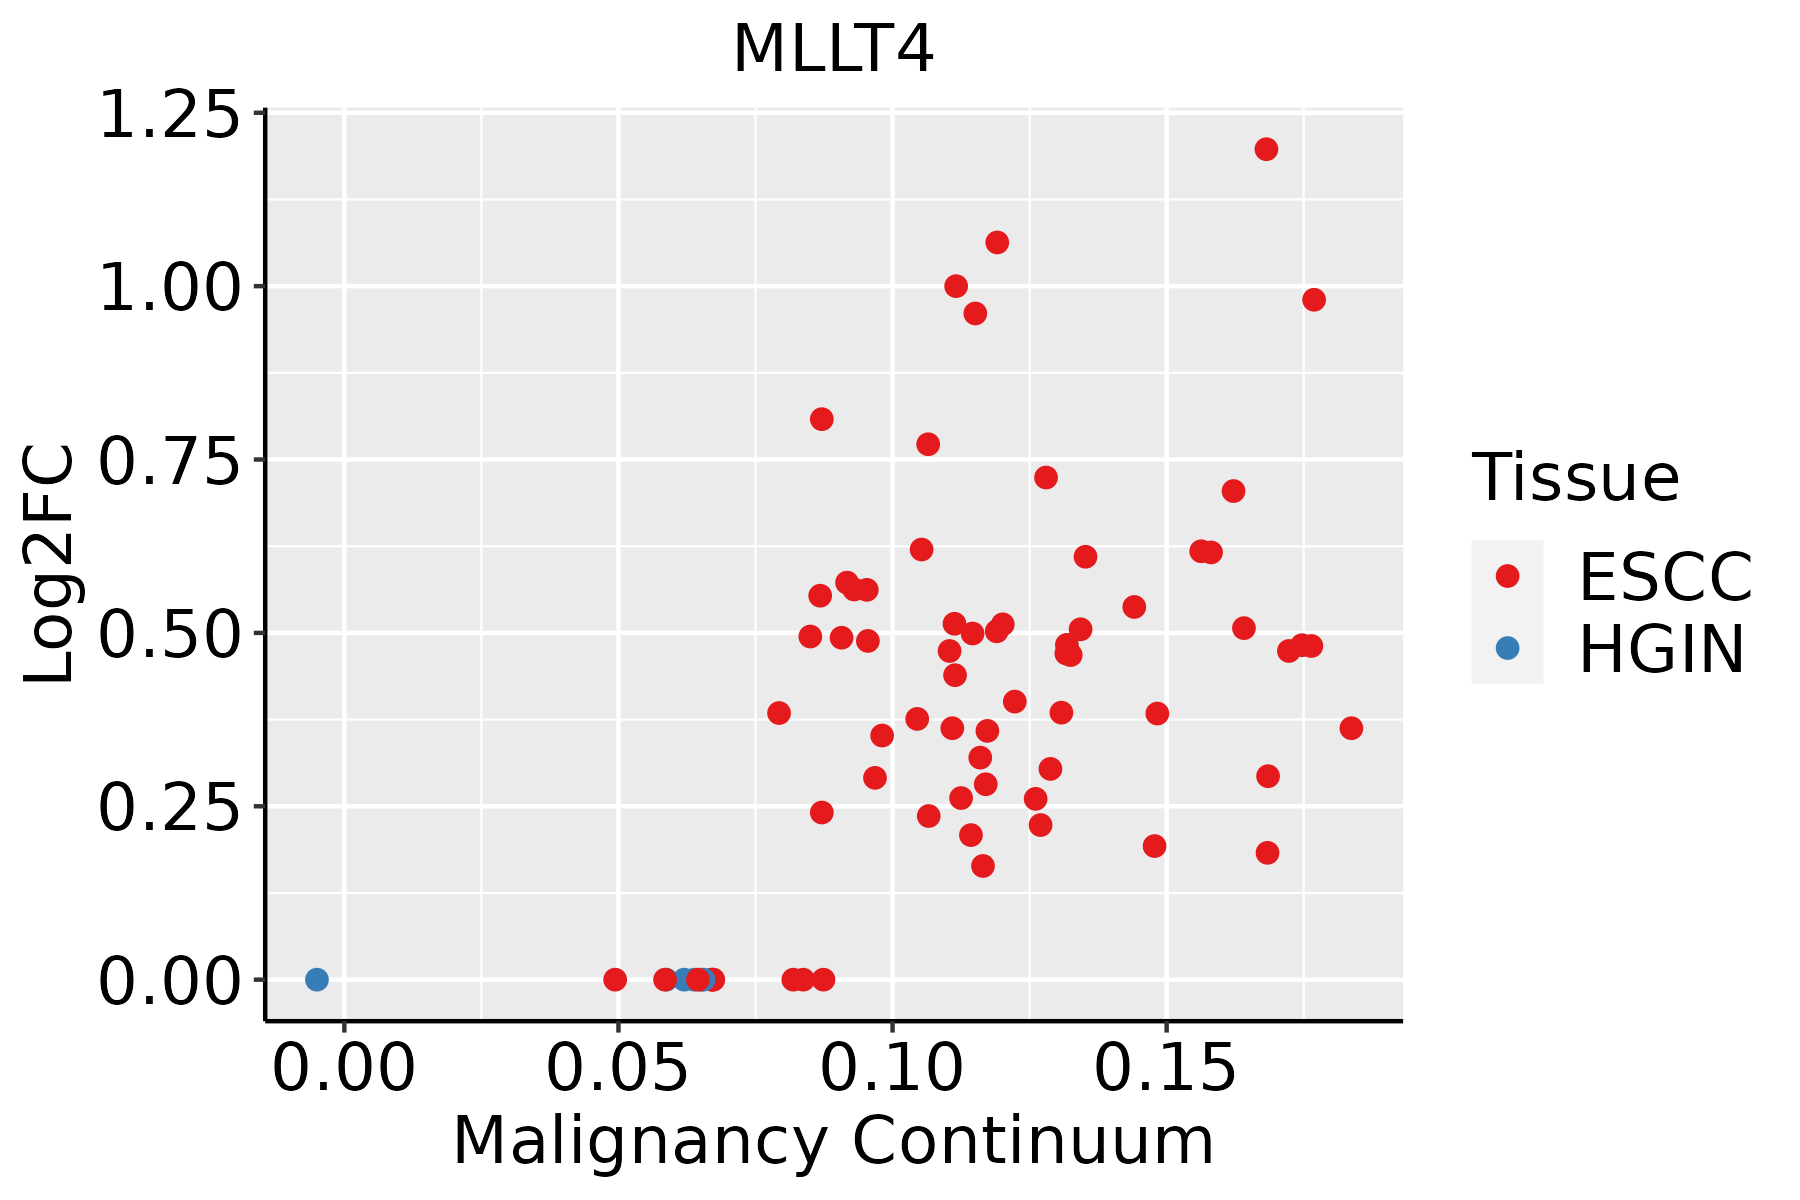 | ESCC: Esophageal squamous cell carcinoma |
| HGIN: High-grade intraepithelial neoplasias | ||
| LGIN: Low-grade intraepithelial neoplasias | ||
| Oral Cavity | 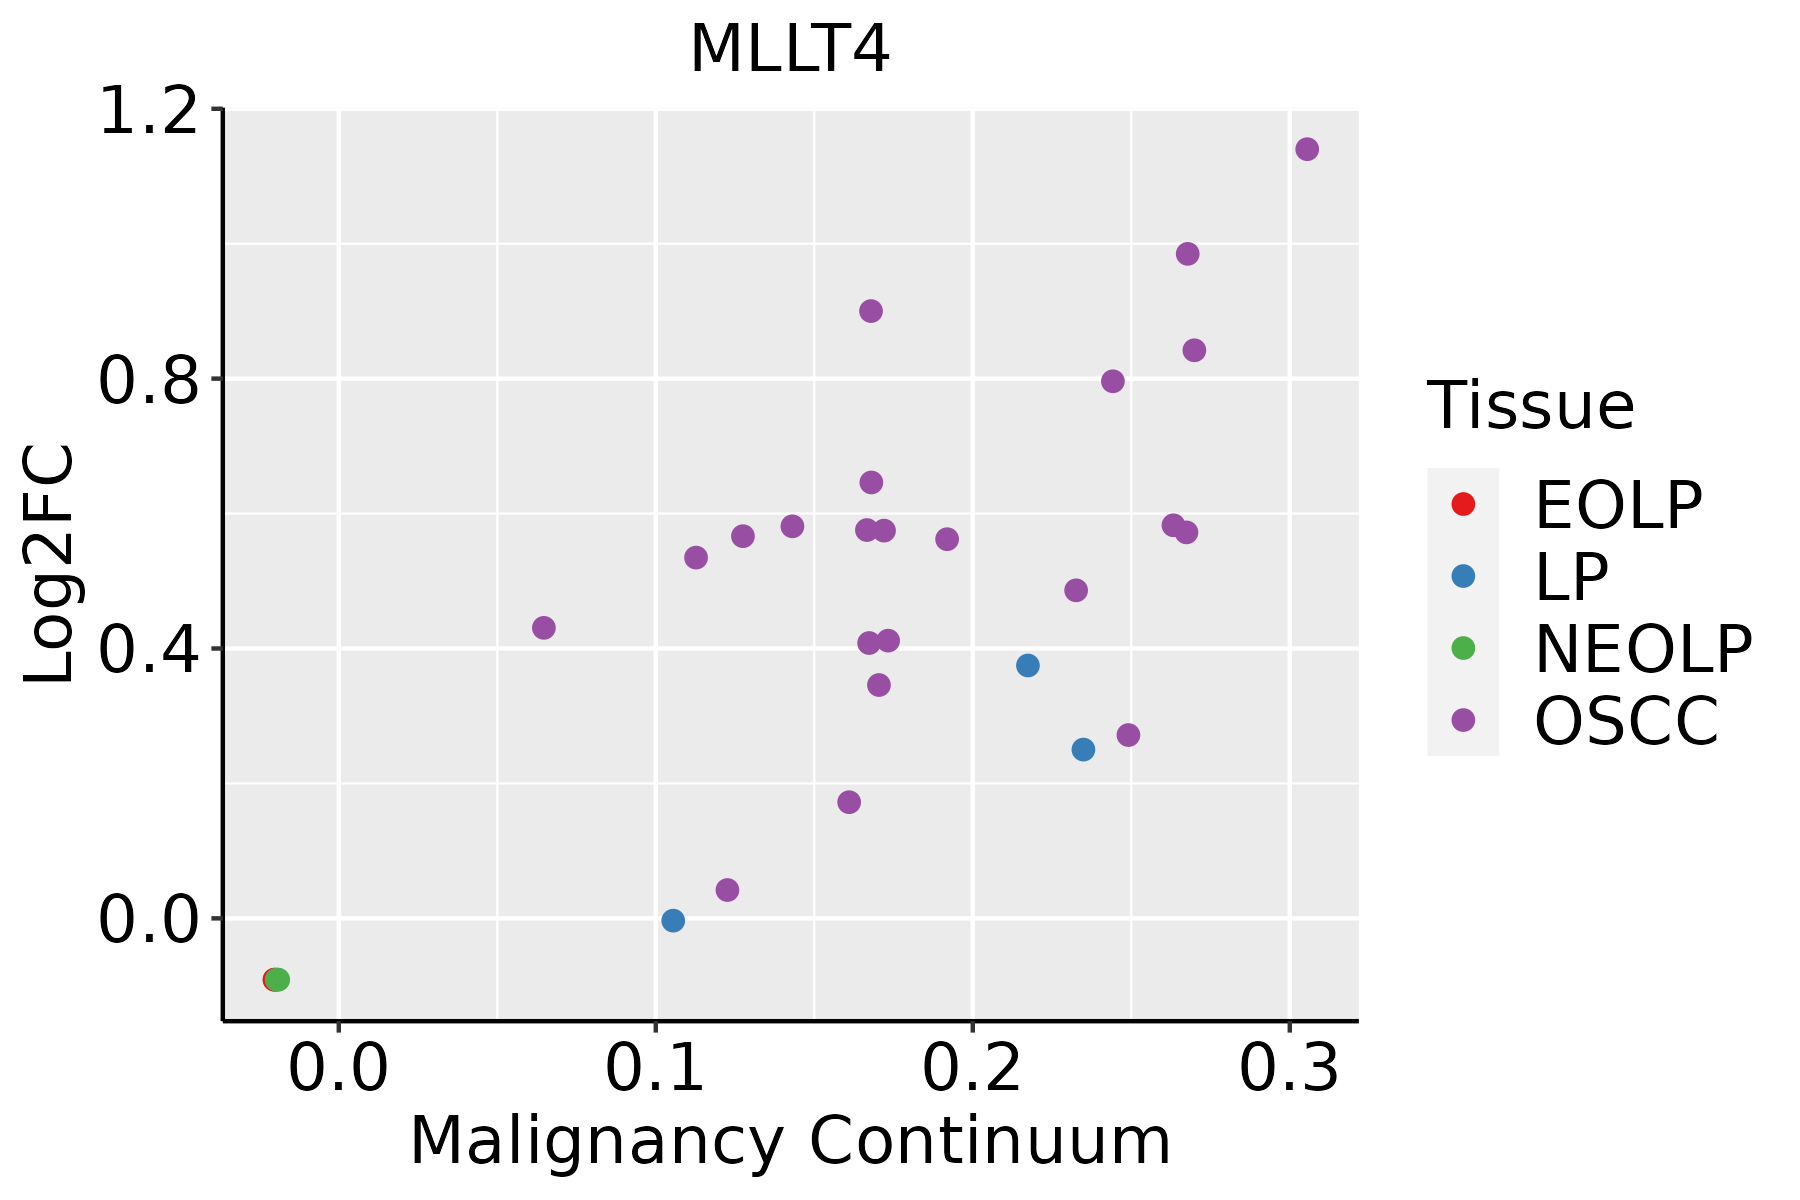 | EOLP: Erosive Oral lichen planus |
| LP: leukoplakia | ||
| NEOLP: Non-erosive oral lichen planus | ||
| OSCC: Oral squamous cell carcinoma | ||
| Prostate |  | BPH: Benign Prostatic Hyperplasia |
| Skin |  | AK: Actinic keratosis |
| cSCC: Cutaneous squamous cell carcinoma | ||
| SCCIS:squamous cell carcinoma in situ |
| ∗log2FC in expression of this searched gene in stem-like cells from each diseased tissue sample relative to stem-like cells in normal samples in each tissue plotted against the malignancy continuum. Samples are colored based on if they are from different disease stage. |
Top |
Malignant transformation related pathway analysis |
| Find out the enriched GO biological processes and KEGG pathways involved in transition from healthy to precancer to cancer |
| Tissue | Disease Stage | Enriched GO biological Processes |
| Colorectum | AD |  |
| Colorectum | SER |  |
| Colorectum | MSS |  |
| Colorectum | MSI-H |  |
| Colorectum | FAP |  |
| ∗Top 15 enriched GO BP terms are showed in the bar plot of each disease state in each tissue. Each row represents a significant GO biological process which is colored according to the -log10(p.adjust). |
| Page: 1 2 3 4 5 6 7 8 9 |
| GO ID | Tissue | Disease Stage | Description | Gene Ratio | Bg Ratio | pvalue | p.adjust | Count |
| Page: 1 |
| Pathway ID | Tissue | Disease Stage | Description | Gene Ratio | Bg Ratio | pvalue | p.adjust | qvalue | Count |
| hsa0452020 | Cervix | CC | Adherens junction | 33/1267 | 93/8465 | 6.99e-07 | 7.31e-06 | 4.32e-06 | 33 |
| hsa0453020 | Cervix | CC | Tight junction | 49/1267 | 169/8465 | 1.87e-06 | 1.78e-05 | 1.05e-05 | 49 |
| hsa0467020 | Cervix | CC | Leukocyte transendothelial migration | 36/1267 | 114/8465 | 5.22e-06 | 4.83e-05 | 2.86e-05 | 36 |
| hsa0401512 | Cervix | CC | Rap1 signaling pathway | 56/1267 | 210/8465 | 6.23e-06 | 5.61e-05 | 3.32e-05 | 56 |
| hsa040142 | Cervix | CC | Ras signaling pathway | 51/1267 | 236/8465 | 3.55e-03 | 1.34e-02 | 7.91e-03 | 51 |
| hsa04520110 | Cervix | CC | Adherens junction | 33/1267 | 93/8465 | 6.99e-07 | 7.31e-06 | 4.32e-06 | 33 |
| hsa04530110 | Cervix | CC | Tight junction | 49/1267 | 169/8465 | 1.87e-06 | 1.78e-05 | 1.05e-05 | 49 |
| hsa04670110 | Cervix | CC | Leukocyte transendothelial migration | 36/1267 | 114/8465 | 5.22e-06 | 4.83e-05 | 2.86e-05 | 36 |
| hsa0401513 | Cervix | CC | Rap1 signaling pathway | 56/1267 | 210/8465 | 6.23e-06 | 5.61e-05 | 3.32e-05 | 56 |
| hsa0401411 | Cervix | CC | Ras signaling pathway | 51/1267 | 236/8465 | 3.55e-03 | 1.34e-02 | 7.91e-03 | 51 |
| hsa0467025 | Cervix | HSIL_HPV | Leukocyte transendothelial migration | 16/459 | 114/8465 | 4.04e-04 | 3.49e-03 | 2.82e-03 | 16 |
| hsa0467035 | Cervix | HSIL_HPV | Leukocyte transendothelial migration | 16/459 | 114/8465 | 4.04e-04 | 3.49e-03 | 2.82e-03 | 16 |
| hsa04520 | Colorectum | AD | Adherens junction | 50/2092 | 93/8465 | 1.52e-09 | 2.83e-08 | 1.81e-08 | 50 |
| hsa04530 | Colorectum | AD | Tight junction | 76/2092 | 169/8465 | 5.49e-09 | 9.69e-08 | 6.18e-08 | 76 |
| hsa04015 | Colorectum | AD | Rap1 signaling pathway | 71/2092 | 210/8465 | 1.72e-03 | 9.68e-03 | 6.18e-03 | 71 |
| hsa04670 | Colorectum | AD | Leukocyte transendothelial migration | 41/2092 | 114/8465 | 4.60e-03 | 2.20e-02 | 1.40e-02 | 41 |
| hsa045201 | Colorectum | AD | Adherens junction | 50/2092 | 93/8465 | 1.52e-09 | 2.83e-08 | 1.81e-08 | 50 |
| hsa045301 | Colorectum | AD | Tight junction | 76/2092 | 169/8465 | 5.49e-09 | 9.69e-08 | 6.18e-08 | 76 |
| hsa040151 | Colorectum | AD | Rap1 signaling pathway | 71/2092 | 210/8465 | 1.72e-03 | 9.68e-03 | 6.18e-03 | 71 |
| hsa046701 | Colorectum | AD | Leukocyte transendothelial migration | 41/2092 | 114/8465 | 4.60e-03 | 2.20e-02 | 1.40e-02 | 41 |
| Page: 1 2 3 4 5 6 7 8 9 |
Top |
Cell-cell communication analysis |
| Identification of potential cell-cell interactions between two cell types and their ligand-receptor pairs for different disease states |
| Ligand | Receptor | LRpair | Pathway | Tissue | Disease Stage |
| Page: 1 |
Top |
Single-cell gene regulatory network inference analysis |
| Find out the significant the regulons (TFs) and the target genes of each regulon across cell types for different disease states |
| TF | Cell Type | Tissue | Disease Stage | Target Gene | RSS | Regulon Activity |
| ∗The dot plots of a searched regulon are shown for all cell subpopulations in each disease state of each tissue based on the regulon specific score inferred using pySCENIC and by calculating the average expression. |
| Page: 1 |
Top |
Somatic mutation of malignant transformation related genes |
| Annotation of somatic variants for genes involved in malignant transformation |
| Hugo Symbol | Variant Class | Variant Classification | dbSNP RS | HGVSc | HGVSp | HGVSp Short | SWISSPROT | BIOTYPE | SIFT | PolyPhen | Tumor Sample Barcode | Tissue | Histology | Sex | Age | Stage | Therapy Types | Drugs | Outcome |
| Page: 1 |
Top |
Related drugs of malignant transformation related genes |
| Identification of chemicals and drugs interact with genes involved in malignant transfromation |
| (DGIdb 4.0) |
| Entrez ID | Symbol | Category | Interaction Types | Drug Claim Name | Drug Name | PMIDs |
| Page: 1 |

Copyright 2023-Present -The University of Texas Health Science Center at Houston |