
|
|||||
|
 | |
| |
| |
| |
| |
| |
|
Gene: METTL23 |
Gene summary for METTL23 |
| Gene information | Species | Human | Gene symbol | METTL23 | Gene ID | 124512 |
| Gene name | methyltransferase like 23 | |
| Gene Alias | C17orf95 | |
| Cytomap | 17q25.1 | |
| Gene Type | protein-coding | GO ID | GO:0003008 | UniProtAcc | A0A024R8M5 |
Top |
Malignant transformation analysis |
| Identification of the aberrant gene expression in precancerous and cancerous lesions by comparing the gene expression of stem-like cells in diseased tissues with normal stem cells |
| Entrez ID | Symbol | Replicates | Species | Organ | Tissue | Adj P-value | Log2FC | Malignancy |
| 124512 | METTL23 | P19T-E | Human | Esophagus | ESCC | 3.19e-09 | 5.80e-01 | 0.1662 |
| 124512 | METTL23 | P20T-E | Human | Esophagus | ESCC | 7.79e-70 | 1.69e+00 | 0.1124 |
| 124512 | METTL23 | P21T-E | Human | Esophagus | ESCC | 4.13e-42 | 8.60e-01 | 0.1617 |
| 124512 | METTL23 | P22T-E | Human | Esophagus | ESCC | 1.14e-53 | 9.54e-01 | 0.1236 |
| 124512 | METTL23 | P23T-E | Human | Esophagus | ESCC | 2.01e-23 | 5.97e-01 | 0.108 |
| 124512 | METTL23 | P24T-E | Human | Esophagus | ESCC | 4.98e-25 | 6.61e-01 | 0.1287 |
| 124512 | METTL23 | P26T-E | Human | Esophagus | ESCC | 6.97e-35 | 7.36e-01 | 0.1276 |
| 124512 | METTL23 | P27T-E | Human | Esophagus | ESCC | 2.47e-26 | 4.04e-01 | 0.1055 |
| 124512 | METTL23 | P28T-E | Human | Esophagus | ESCC | 1.02e-34 | 6.75e-01 | 0.1149 |
| 124512 | METTL23 | P30T-E | Human | Esophagus | ESCC | 1.58e-18 | 7.12e-01 | 0.137 |
| 124512 | METTL23 | P31T-E | Human | Esophagus | ESCC | 3.31e-57 | 8.98e-01 | 0.1251 |
| 124512 | METTL23 | P32T-E | Human | Esophagus | ESCC | 8.81e-57 | 1.34e+00 | 0.1666 |
| 124512 | METTL23 | P36T-E | Human | Esophagus | ESCC | 2.07e-18 | 7.48e-01 | 0.1187 |
| 124512 | METTL23 | P37T-E | Human | Esophagus | ESCC | 1.86e-28 | 6.21e-01 | 0.1371 |
| 124512 | METTL23 | P38T-E | Human | Esophagus | ESCC | 1.16e-09 | 3.07e-01 | 0.127 |
| 124512 | METTL23 | P39T-E | Human | Esophagus | ESCC | 1.42e-18 | 2.80e-01 | 0.0894 |
| 124512 | METTL23 | P40T-E | Human | Esophagus | ESCC | 9.03e-16 | 4.36e-01 | 0.109 |
| 124512 | METTL23 | P42T-E | Human | Esophagus | ESCC | 1.30e-17 | 4.84e-01 | 0.1175 |
| 124512 | METTL23 | P44T-E | Human | Esophagus | ESCC | 4.93e-11 | 2.98e-01 | 0.1096 |
| 124512 | METTL23 | P47T-E | Human | Esophagus | ESCC | 7.09e-17 | 3.23e-01 | 0.1067 |
| Page: 1 2 3 4 5 6 7 |
| Tissue | Expression Dynamics | Abbreviation |
| Esophagus | 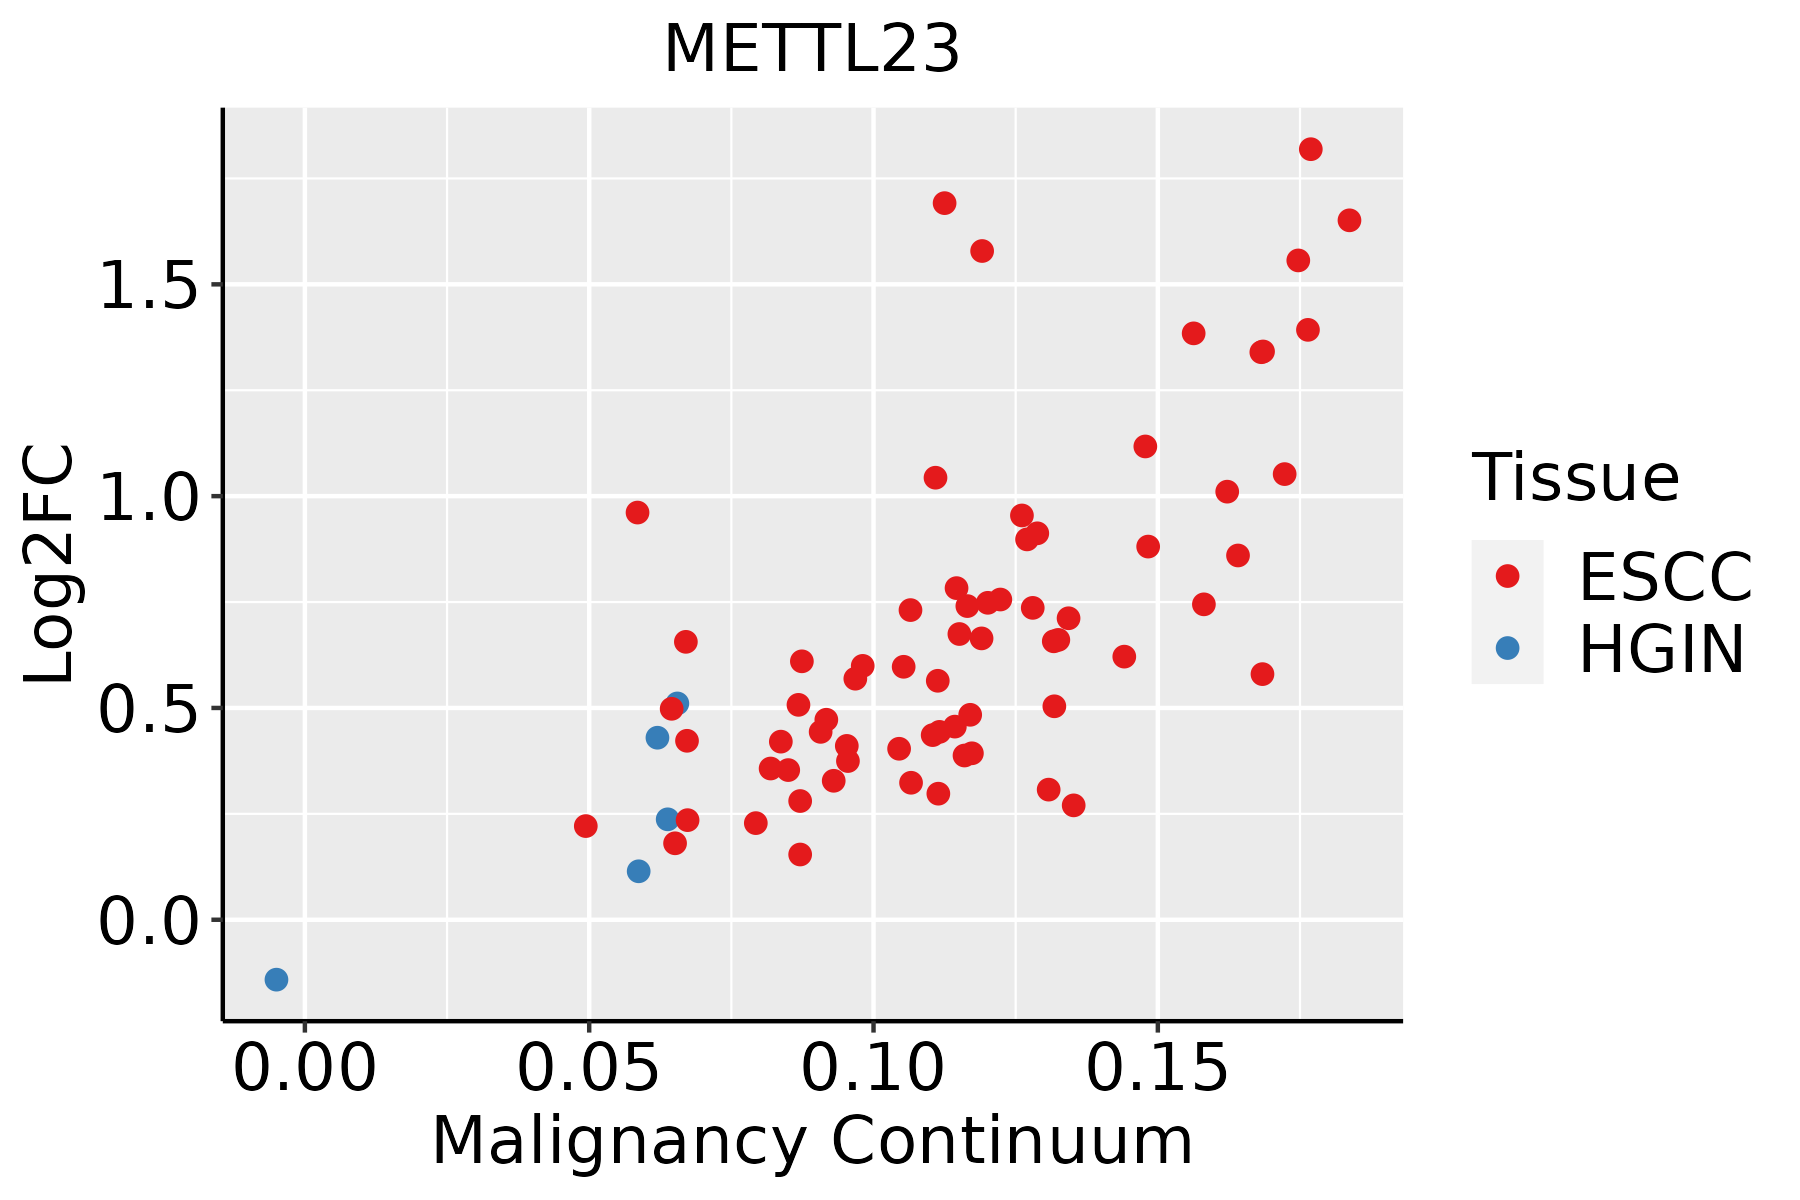 | ESCC: Esophageal squamous cell carcinoma |
| HGIN: High-grade intraepithelial neoplasias | ||
| LGIN: Low-grade intraepithelial neoplasias | ||
| Liver |  | HCC: Hepatocellular carcinoma |
| NAFLD: Non-alcoholic fatty liver disease | ||
| Oral Cavity |  | EOLP: Erosive Oral lichen planus |
| LP: leukoplakia | ||
| NEOLP: Non-erosive oral lichen planus | ||
| OSCC: Oral squamous cell carcinoma | ||
| Skin |  | AK: Actinic keratosis |
| cSCC: Cutaneous squamous cell carcinoma | ||
| SCCIS:squamous cell carcinoma in situ | ||
| Thyroid |  | ATC: Anaplastic thyroid cancer |
| HT: Hashimoto's thyroiditis | ||
| PTC: Papillary thyroid cancer |
| ∗log2FC in expression of this searched gene in stem-like cells from each diseased tissue sample relative to stem-like cells in normal samples in each tissue plotted against the malignancy continuum. Samples are colored based on if they are from different disease stage. |
Top |
Malignant transformation related pathway analysis |
| Find out the enriched GO biological processes and KEGG pathways involved in transition from healthy to precancer to cancer |
| Tissue | Disease Stage | Enriched GO biological Processes |
| Colorectum | AD |  |
| Colorectum | SER |  |
| Colorectum | MSS |  |
| Colorectum | MSI-H |  |
| Colorectum | FAP |  |
| ∗Top 15 enriched GO BP terms are showed in the bar plot of each disease state in each tissue. Each row represents a significant GO biological process which is colored according to the -log10(p.adjust). |
| Page: 1 2 3 4 5 6 7 8 9 |
| GO ID | Tissue | Disease Stage | Description | Gene Ratio | Bg Ratio | pvalue | p.adjust | Count |
| GO:00322592 | Esophagus | ESCC | methylation | 222/8552 | 364/18723 | 2.26e-09 | 5.09e-08 | 222 |
| GO:0032259 | Liver | HCC | methylation | 206/7958 | 364/18723 | 3.35e-08 | 7.53e-07 | 206 |
| GO:00322591 | Oral cavity | OSCC | methylation | 168/7305 | 364/18723 | 3.03e-03 | 1.31e-02 | 168 |
| GO:00322593 | Skin | cSCC | methylation | 120/4864 | 364/18723 | 1.61e-03 | 9.93e-03 | 120 |
| GO:00322594 | Thyroid | PTC | methylation | 146/5968 | 364/18723 | 4.99e-04 | 3.26e-03 | 146 |
| GO:003225911 | Thyroid | ATC | methylation | 148/6293 | 364/18723 | 2.69e-03 | 1.23e-02 | 148 |
| Page: 1 |
| Pathway ID | Tissue | Disease Stage | Description | Gene Ratio | Bg Ratio | pvalue | p.adjust | qvalue | Count |
| Page: 1 |
Top |
Cell-cell communication analysis |
| Identification of potential cell-cell interactions between two cell types and their ligand-receptor pairs for different disease states |
| Ligand | Receptor | LRpair | Pathway | Tissue | Disease Stage |
| Page: 1 |
Top |
Single-cell gene regulatory network inference analysis |
| Find out the significant the regulons (TFs) and the target genes of each regulon across cell types for different disease states |
| TF | Cell Type | Tissue | Disease Stage | Target Gene | RSS | Regulon Activity |
| ∗The dot plots of a searched regulon are shown for all cell subpopulations in each disease state of each tissue based on the regulon specific score inferred using pySCENIC and by calculating the average expression. |
| Page: 1 |
Top |
Somatic mutation of malignant transformation related genes |
| Annotation of somatic variants for genes involved in malignant transformation |
| Hugo Symbol | Variant Class | Variant Classification | dbSNP RS | HGVSc | HGVSp | HGVSp Short | SWISSPROT | BIOTYPE | SIFT | PolyPhen | Tumor Sample Barcode | Tissue | Histology | Sex | Age | Stage | Therapy Types | Drugs | Outcome |
| METTL23 | SNV | Missense_Mutation | c.535G>C | p.Glu179Gln | p.E179Q | Q86XA0 | protein_coding | tolerated(0.35) | benign(0.018) | TCGA-A2-A0SY-01 | Breast | breast invasive carcinoma | Female | <65 | III/IV | Hormone Therapy | arimidex | SD | |
| METTL23 | SNV | Missense_Mutation | c.509N>G | p.Ser170Cys | p.S170C | Q86XA0 | protein_coding | deleterious(0) | probably_damaging(0.985) | TCGA-A8-A08R-01 | Breast | breast invasive carcinoma | Female | <65 | I/II | Unknown | Unknown | SD | |
| METTL23 | SNV | Missense_Mutation | c.299N>G | p.Ser100Cys | p.S100C | Q86XA0 | protein_coding | deleterious(0) | probably_damaging(0.954) | TCGA-AC-A23H-01 | Breast | breast invasive carcinoma | Female | >=65 | I/II | Unknown | Unknown | PD | |
| METTL23 | SNV | Missense_Mutation | rs749476487 | c.209N>C | p.Asn70Thr | p.N70T | Q86XA0 | protein_coding | tolerated(0.06) | benign(0.345) | TCGA-B6-A1KF-01 | Breast | breast invasive carcinoma | Female | >=65 | I/II | Unknown | Unknown | SD |
| METTL23 | SNV | Missense_Mutation | rs749476487 | c.209A>C | p.Asn70Thr | p.N70T | Q86XA0 | protein_coding | tolerated(0.06) | benign(0.345) | TCGA-C8-A27B-01 | Breast | breast invasive carcinoma | Female | <65 | I/II | Chemotherapy | 5-fluorouracil | CR |
| METTL23 | insertion | In_Frame_Ins | novel | c.139_140insTAA | p.Ile48dup | p.I48dup | Q86XA0 | protein_coding | TCGA-PL-A8LZ-01 | Breast | breast invasive carcinoma | Female | <65 | III/IV | Chemotherapy | paclitaxel | SD | ||
| METTL23 | SNV | Missense_Mutation | novel | c.49C>T | p.His17Tyr | p.H17Y | Q86XA0 | protein_coding | tolerated(0.12) | possibly_damaging(0.583) | TCGA-ZJ-AAXU-01 | Cervix | cervical & endocervical cancer | Female | <65 | I/II | Unknown | Unknown | SD |
| METTL23 | SNV | Missense_Mutation | c.493N>A | p.Glu165Lys | p.E165K | Q86XA0 | protein_coding | tolerated(0.48) | benign(0.396) | TCGA-AA-A00N-01 | Colorectum | colon adenocarcinoma | Male | >=65 | I/II | Unknown | Unknown | PD | |
| METTL23 | SNV | Missense_Mutation | c.340N>A | p.Ala114Thr | p.A114T | Q86XA0 | protein_coding | tolerated(0.53) | benign(0.001) | TCGA-EI-6507-01 | Colorectum | rectum adenocarcinoma | Male | <65 | I/II | Unknown | Unknown | SD | |
| METTL23 | SNV | Missense_Mutation | novel | c.491N>G | p.Lys164Arg | p.K164R | Q86XA0 | protein_coding | tolerated(0.27) | benign(0.001) | TCGA-EY-A1GI-01 | Endometrium | uterine corpus endometrioid carcinoma | Female | <65 | I/II | Unknown | Unknown | SD |
| Page: 1 2 |
Top |
Related drugs of malignant transformation related genes |
| Identification of chemicals and drugs interact with genes involved in malignant transfromation |
| (DGIdb 4.0) |
| Entrez ID | Symbol | Category | Interaction Types | Drug Claim Name | Drug Name | PMIDs |
| Page: 1 |

Copyright 2023-Present -The University of Texas Health Science Center at Houston |