
|
|||||
|
 | |
| |
| |
| |
| |
| |
|
Gene: MCF2L2 |
Gene summary for MCF2L2 |
| Gene information | Species | Human | Gene symbol | MCF2L2 | Gene ID | 23101 |
| Gene name | MCF.2 cell line derived transforming sequence-like 2 | |
| Gene Alias | ARHGEF22 | |
| Cytomap | 3q27.1 | |
| Gene Type | protein-coding | GO ID | GO:0008150 | UniProtAcc | Q86YR7 |
Top |
Malignant transformation analysis |
| Identification of the aberrant gene expression in precancerous and cancerous lesions by comparing the gene expression of stem-like cells in diseased tissues with normal stem cells |
| Entrez ID | Symbol | Replicates | Species | Organ | Tissue | Adj P-value | Log2FC | Malignancy |
| 23101 | MCF2L2 | P49T-E | Human | Esophagus | ESCC | 2.45e-03 | 6.14e-01 | 0.1768 |
| 23101 | MCF2L2 | P52T-E | Human | Esophagus | ESCC | 4.31e-06 | 1.43e-01 | 0.1555 |
| 23101 | MCF2L2 | P54T-E | Human | Esophagus | ESCC | 2.03e-05 | 8.53e-02 | 0.0975 |
| 23101 | MCF2L2 | P62T-E | Human | Esophagus | ESCC | 1.18e-10 | 1.19e-01 | 0.1302 |
| 23101 | MCF2L2 | P127T-E | Human | Esophagus | ESCC | 2.17e-16 | 1.63e-01 | 0.0826 |
| 23101 | MCF2L2 | P128T-E | Human | Esophagus | ESCC | 1.02e-03 | 1.02e-01 | 0.1241 |
| 23101 | MCF2L2 | RNA-P17T-P17T-2 | Human | Lung | IAC | 4.70e-13 | 8.88e-01 | 0.3371 |
| 23101 | MCF2L2 | RNA-P17T-P17T-4 | Human | Lung | IAC | 1.13e-06 | 7.19e-01 | 0.343 |
| 23101 | MCF2L2 | RNA-P17T-P17T-6 | Human | Lung | IAC | 2.66e-08 | 7.48e-01 | 0.3385 |
| 23101 | MCF2L2 | RNA-P17T-P17T-8 | Human | Lung | IAC | 1.41e-10 | 8.87e-01 | 0.3329 |
| 23101 | MCF2L2 | RNA-P18T-P18T-2 | Human | Lung | IAC | 1.16e-02 | 7.57e-01 | 0.1129 |
| 23101 | MCF2L2 | HTA12-23-1 | Human | Pancreas | PDAC | 1.44e-05 | 5.28e-01 | 0.3405 |
| 23101 | MCF2L2 | HTA12-25-1 | Human | Pancreas | PDAC | 3.52e-06 | 5.25e-01 | 0.313 |
| 23101 | MCF2L2 | HTA12-26-1 | Human | Pancreas | PDAC | 1.02e-15 | 6.45e-01 | 0.3728 |
| 23101 | MCF2L2 | HTA12-29-1 | Human | Pancreas | PDAC | 2.60e-36 | 7.12e-01 | 0.3722 |
| 23101 | MCF2L2 | Pat01-B | Human | Stomach | GC | 1.33e-41 | 7.66e-01 | 0.5754 |
| 23101 | MCF2L2 | Pat02-B | Human | Stomach | GC | 6.05e-20 | 3.43e-01 | 0.0368 |
| 23101 | MCF2L2 | Pat03-B | Human | Stomach | GC | 8.66e-31 | 6.14e-01 | 0.3693 |
| 23101 | MCF2L2 | Pat04-B | Human | Stomach | GC | 4.62e-19 | 5.55e-01 | -0.1483 |
| 23101 | MCF2L2 | Pat05-B | Human | Stomach | GC | 1.73e-12 | 3.58e-01 | -0.0353 |
| Page: 1 2 3 |
| Tissue | Expression Dynamics | Abbreviation |
| Cervix | 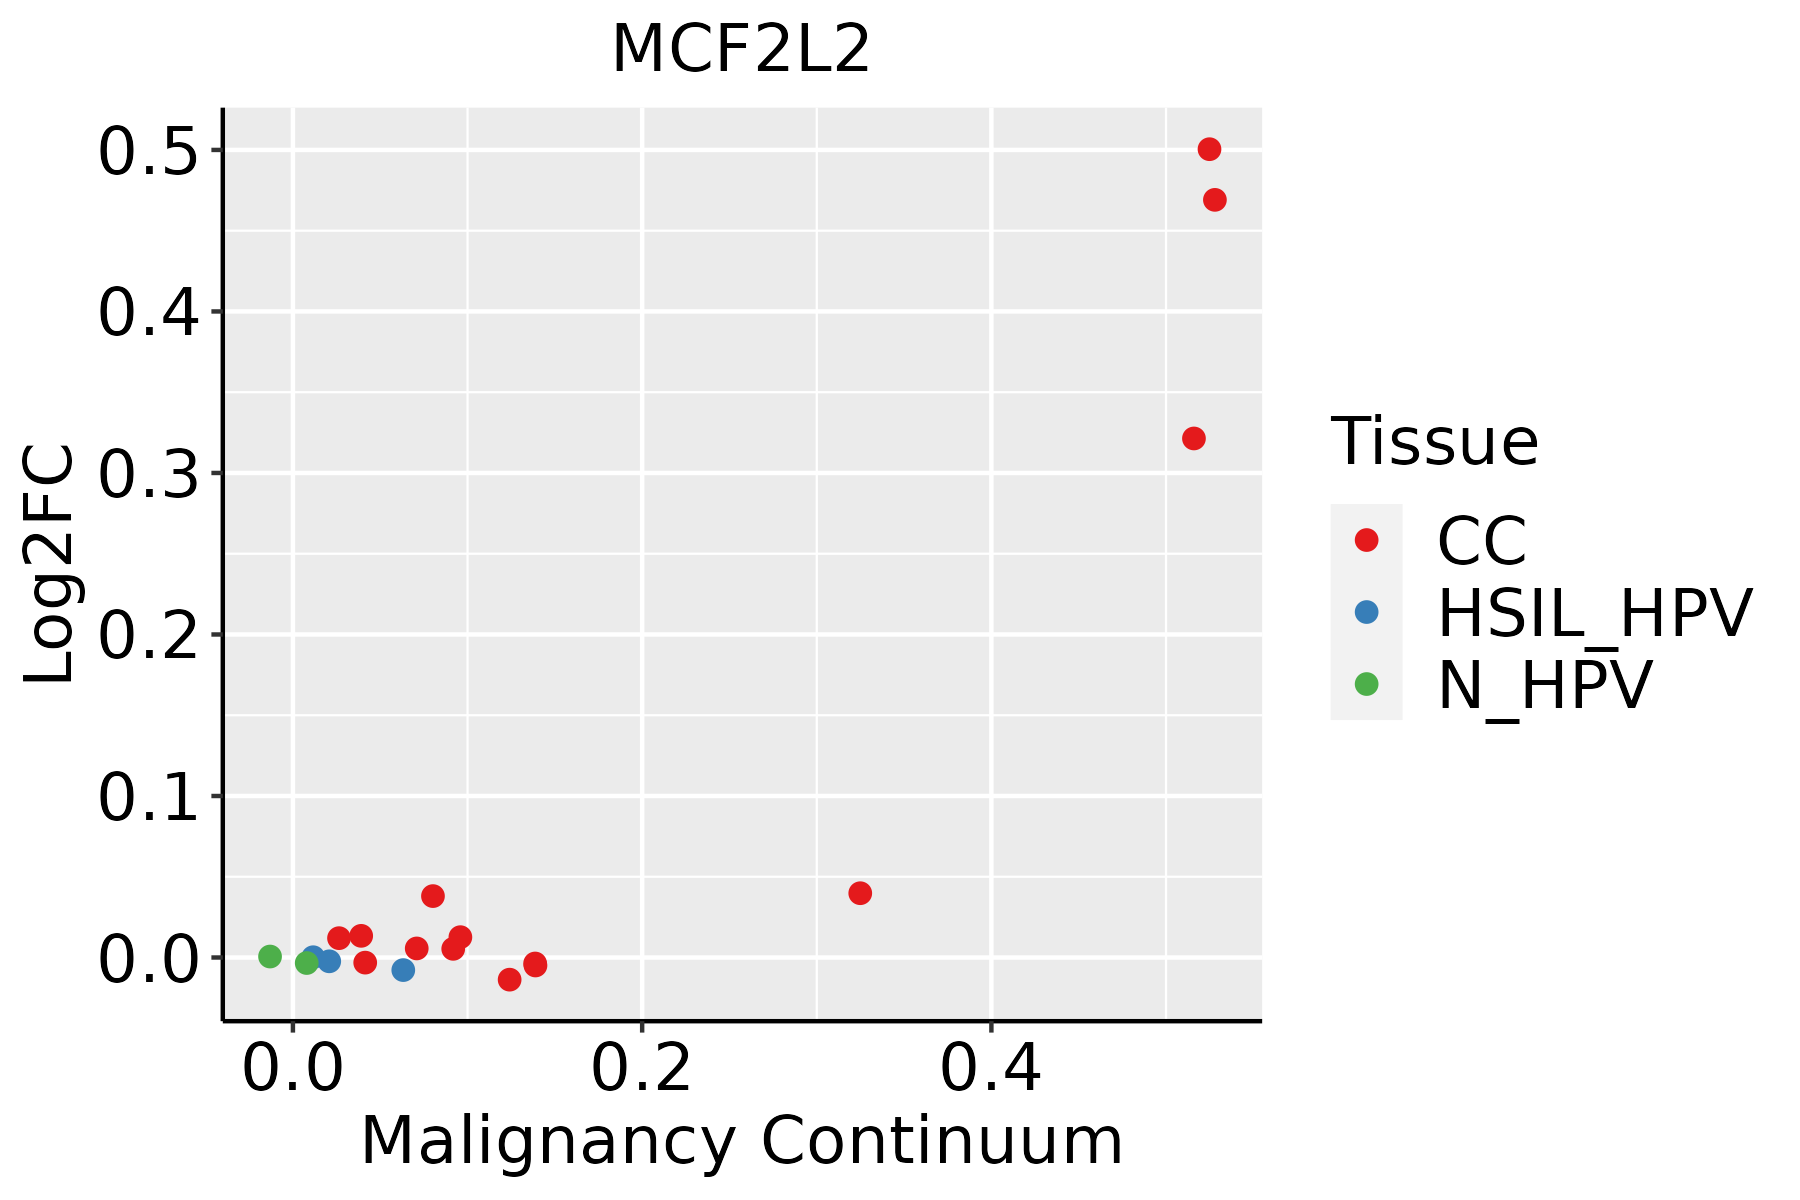 | CC: Cervix cancer |
| HSIL_HPV: HPV-infected high-grade squamous intraepithelial lesions | ||
| N_HPV: HPV-infected normal cervix | ||
| Esophagus |  | ESCC: Esophageal squamous cell carcinoma |
| HGIN: High-grade intraepithelial neoplasias | ||
| LGIN: Low-grade intraepithelial neoplasias | ||
| GC | 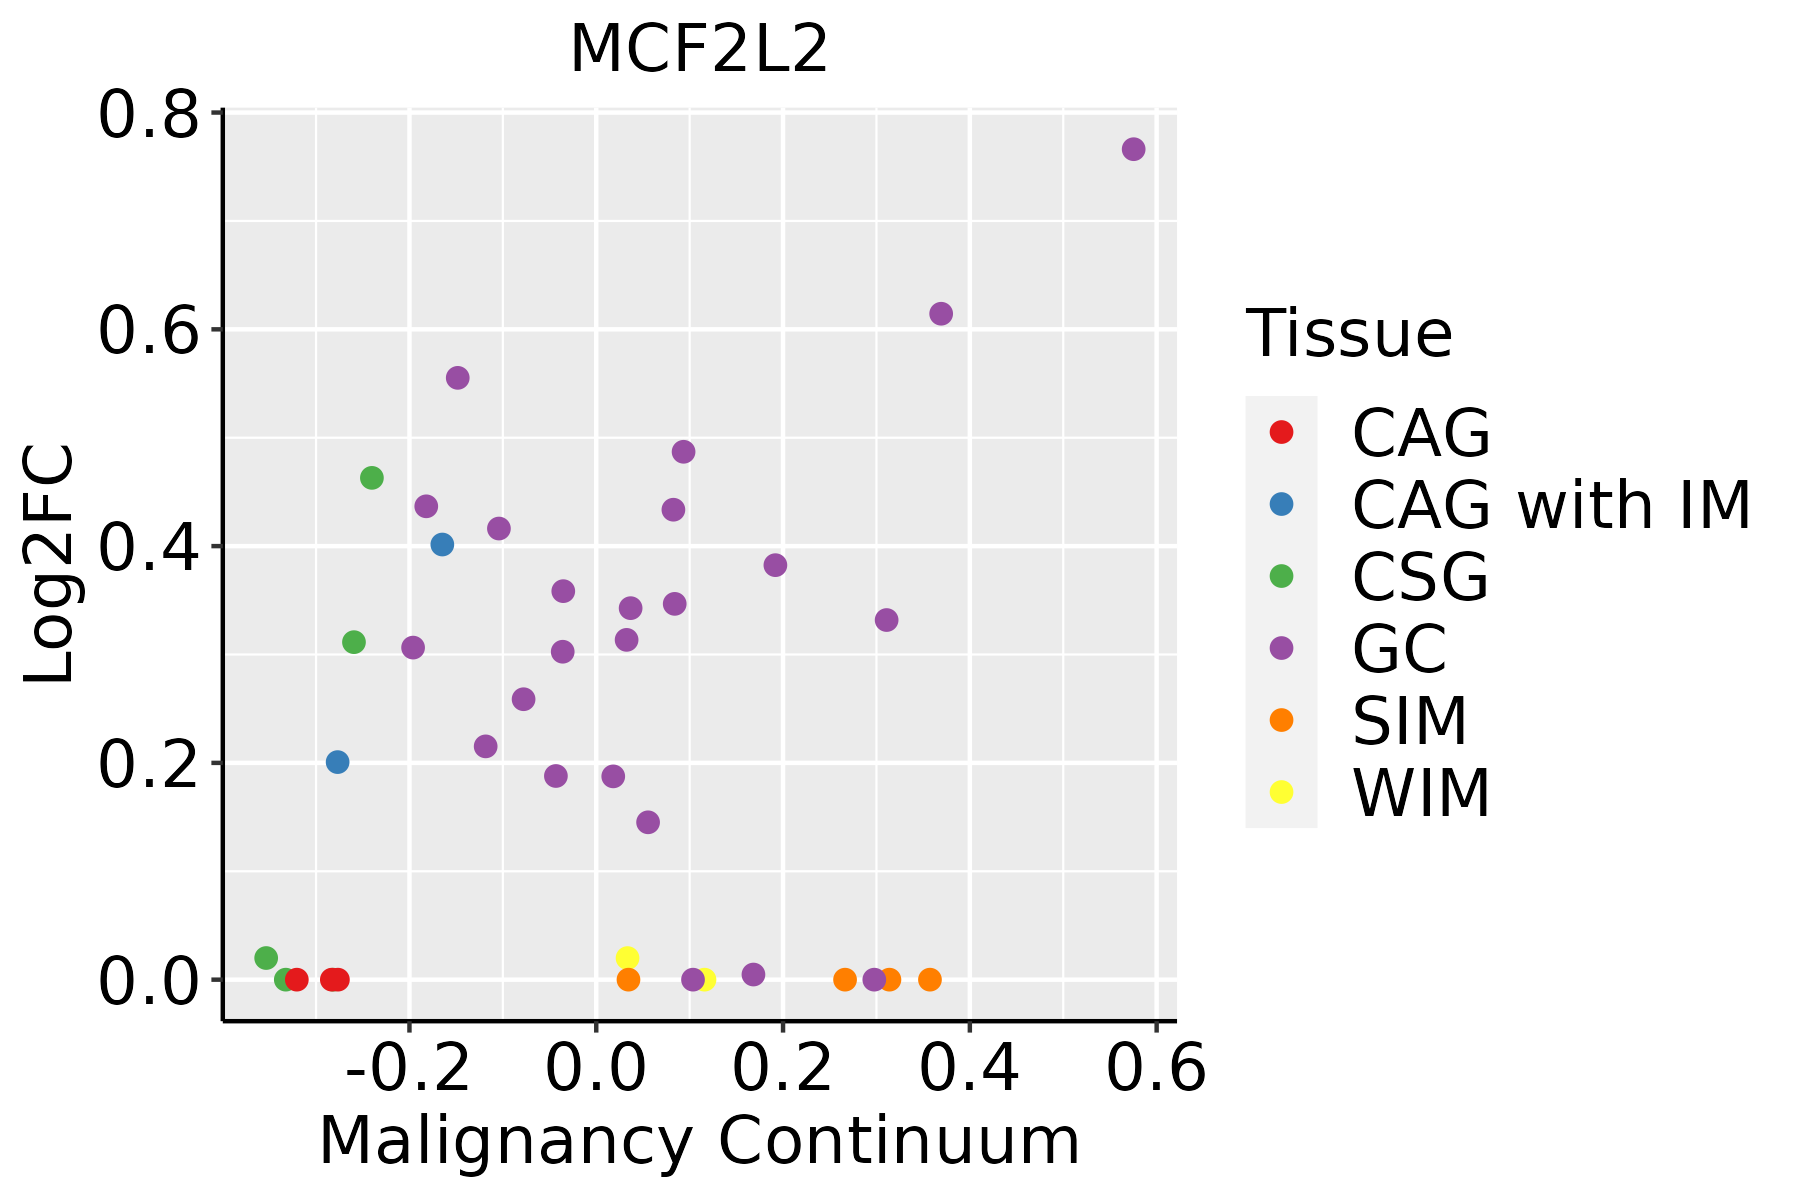 | CAG: Chronic atrophic gastritis |
| CAG with IM: Chronic atrophic gastritis with intestinal metaplasia | ||
| CSG: Chronic superficial gastritis | ||
| GC: Gastric cancer | ||
| SIM: Severe intestinal metaplasia | ||
| WIM: Wild intestinal metaplasia | ||
| Lung |  | AAH: Atypical adenomatous hyperplasia |
| AIS: Adenocarcinoma in situ | ||
| IAC: Invasive lung adenocarcinoma | ||
| MIA: Minimally invasive adenocarcinoma |
| ∗log2FC in expression of this searched gene in stem-like cells from each diseased tissue sample relative to stem-like cells in normal samples in each tissue plotted against the malignancy continuum. Samples are colored based on if they are from different disease stage. |
Top |
Malignant transformation related pathway analysis |
| Find out the enriched GO biological processes and KEGG pathways involved in transition from healthy to precancer to cancer |
| Tissue | Disease Stage | Enriched GO biological Processes |
| Colorectum | AD |  |
| Colorectum | SER |  |
| Colorectum | MSS |  |
| Colorectum | MSI-H |  |
| Colorectum | FAP |  |
| ∗Top 15 enriched GO BP terms are showed in the bar plot of each disease state in each tissue. Each row represents a significant GO biological process which is colored according to the -log10(p.adjust). |
| Page: 1 2 3 4 5 6 7 8 9 |
| GO ID | Tissue | Disease Stage | Description | Gene Ratio | Bg Ratio | pvalue | p.adjust | Count |
| Page: 1 |
| Pathway ID | Tissue | Disease Stage | Description | Gene Ratio | Bg Ratio | pvalue | p.adjust | qvalue | Count |
| Page: 1 |
Top |
Cell-cell communication analysis |
| Identification of potential cell-cell interactions between two cell types and their ligand-receptor pairs for different disease states |
| Ligand | Receptor | LRpair | Pathway | Tissue | Disease Stage |
| Page: 1 |
Top |
Single-cell gene regulatory network inference analysis |
| Find out the significant the regulons (TFs) and the target genes of each regulon across cell types for different disease states |
| TF | Cell Type | Tissue | Disease Stage | Target Gene | RSS | Regulon Activity |
| ∗The dot plots of a searched regulon are shown for all cell subpopulations in each disease state of each tissue based on the regulon specific score inferred using pySCENIC and by calculating the average expression. |
| Page: 1 |
Top |
Somatic mutation of malignant transformation related genes |
| Annotation of somatic variants for genes involved in malignant transformation |
| Hugo Symbol | Variant Class | Variant Classification | dbSNP RS | HGVSc | HGVSp | HGVSp Short | SWISSPROT | BIOTYPE | SIFT | PolyPhen | Tumor Sample Barcode | Tissue | Histology | Sex | Age | Stage | Therapy Types | Drugs | Outcome |
| MCF2L2 | SNV | Missense_Mutation | rs775278339 | c.574N>T | p.Arg192Cys | p.R192C | Q86YR7 | protein_coding | tolerated(1) | benign(0.013) | TCGA-A2-A0SY-01 | Breast | breast invasive carcinoma | Female | <65 | III/IV | Hormone Therapy | arimidex | SD |
| MCF2L2 | SNV | Missense_Mutation | novel | c.2686N>T | p.His896Tyr | p.H896Y | Q86YR7 | protein_coding | deleterious(0.01) | benign(0.139) | TCGA-A7-A6VX-01 | Breast | breast invasive carcinoma | Female | >=65 | I/II | Chemotherapy | docetaxel | CR |
| MCF2L2 | SNV | Missense_Mutation | c.2723T>A | p.Leu908His | p.L908H | Q86YR7 | protein_coding | deleterious(0) | possibly_damaging(0.754) | TCGA-A8-A07W-01 | Breast | breast invasive carcinoma | Female | >=65 | III/IV | Hormone Therapy | exemestane | SD | |
| MCF2L2 | SNV | Missense_Mutation | c.2321N>G | p.Ser774Cys | p.S774C | Q86YR7 | protein_coding | deleterious(0) | possibly_damaging(0.819) | TCGA-A8-A0A7-01 | Breast | breast invasive carcinoma | Female | <65 | I/II | Unknown | Unknown | SD | |
| MCF2L2 | SNV | Missense_Mutation | c.2032N>A | p.Glu678Lys | p.E678K | Q86YR7 | protein_coding | deleterious(0.02) | probably_damaging(0.913) | TCGA-AC-A62X-01 | Breast | breast invasive carcinoma | Female | >=65 | I/II | Unknown | Unknown | SD | |
| MCF2L2 | SNV | Missense_Mutation | novel | c.2736N>C | p.Gln912His | p.Q912H | Q86YR7 | protein_coding | deleterious(0.02) | benign(0.005) | TCGA-AN-A046-01 | Breast | breast invasive carcinoma | Female | >=65 | I/II | Unknown | Unknown | SD |
| MCF2L2 | SNV | Missense_Mutation | c.3090G>T | p.Glu1030Asp | p.E1030D | Q86YR7 | protein_coding | tolerated(0.43) | benign(0.005) | TCGA-D8-A1X5-01 | Breast | breast invasive carcinoma | Female | >=65 | III/IV | Hormone Therapy | tamoxiphen | SD | |
| MCF2L2 | SNV | Missense_Mutation | c.2939N>G | p.Ser980Cys | p.S980C | Q86YR7 | protein_coding | tolerated(0.19) | benign(0) | TCGA-GI-A2C9-01 | Breast | breast invasive carcinoma | Female | <65 | I/II | Unspecific | SD | ||
| MCF2L2 | deletion | Frame_Shift_Del | novel | c.2763delN | p.Phe921LeufsTer29 | p.F921Lfs*29 | Q86YR7 | protein_coding | TCGA-EW-A2FV-01 | Breast | breast invasive carcinoma | Female | <65 | III/IV | Chemotherapy | docetaxel | SD | ||
| MCF2L2 | deletion | Frame_Shift_Del | rs748576542 | c.1095delN | p.Lys365AsnfsTer59 | p.K365Nfs*59 | Q86YR7 | protein_coding | TCGA-EW-A2FV-01 | Breast | breast invasive carcinoma | Female | <65 | III/IV | Chemotherapy | docetaxel | SD |
| Page: 1 2 3 4 5 6 7 8 9 10 11 12 13 14 15 16 17 18 |
Top |
Related drugs of malignant transformation related genes |
| Identification of chemicals and drugs interact with genes involved in malignant transfromation |
| (DGIdb 4.0) |
| Entrez ID | Symbol | Category | Interaction Types | Drug Claim Name | Drug Name | PMIDs |
| Page: 1 |

Copyright 2023-Present -The University of Texas Health Science Center at Houston |