
|
|||||
|
 | |
| |
| |
| |
| |
| |
|
Gene: MAPK13 |
Gene summary for MAPK13 |
| Gene information | Species | Human | Gene symbol | MAPK13 | Gene ID | 5603 |
| Gene name | mitogen-activated protein kinase 13 | |
| Gene Alias | MAPK 13 | |
| Cytomap | 6p21.31 | |
| Gene Type | protein-coding | GO ID | GO:0000165 | UniProtAcc | A0A024RD04 |
Top |
Malignant transformation analysis |
| Identification of the aberrant gene expression in precancerous and cancerous lesions by comparing the gene expression of stem-like cells in diseased tissues with normal stem cells |
| Entrez ID | Symbol | Replicates | Species | Organ | Tissue | Adj P-value | Log2FC | Malignancy |
| 5603 | MAPK13 | HTA11_10623_2000001011 | Human | Colorectum | AD | 5.78e-04 | 4.73e-01 | -0.0177 |
| 5603 | MAPK13 | HTA11_6801_2000001011 | Human | Colorectum | SER | 1.97e-08 | 1.14e+00 | 0.0171 |
| 5603 | MAPK13 | HTA11_10711_2000001011 | Human | Colorectum | AD | 2.27e-03 | 4.18e-01 | 0.0338 |
| 5603 | MAPK13 | HTA11_7696_3000711011 | Human | Colorectum | AD | 7.38e-12 | 6.04e-01 | 0.0674 |
| 5603 | MAPK13 | HTA11_7469_2000001011 | Human | Colorectum | AD | 5.80e-07 | 9.15e-01 | -0.0124 |
| 5603 | MAPK13 | HTA11_6818_2000001021 | Human | Colorectum | AD | 1.57e-04 | 4.40e-01 | 0.0588 |
| 5603 | MAPK13 | HTA11_99999970781_79442 | Human | Colorectum | MSS | 3.96e-10 | 5.16e-01 | 0.294 |
| 5603 | MAPK13 | HTA11_99999965104_69814 | Human | Colorectum | MSS | 5.31e-22 | 9.88e-01 | 0.281 |
| 5603 | MAPK13 | HTA11_99999971662_82457 | Human | Colorectum | MSS | 9.73e-22 | 8.27e-01 | 0.3859 |
| 5603 | MAPK13 | HTA11_99999973899_84307 | Human | Colorectum | MSS | 2.21e-12 | 1.04e+00 | 0.2585 |
| 5603 | MAPK13 | HTA11_99999974143_84620 | Human | Colorectum | MSS | 2.38e-09 | 5.34e-01 | 0.3005 |
| 5603 | MAPK13 | A015-C-203 | Human | Colorectum | FAP | 1.06e-02 | -1.04e-01 | -0.1294 |
| 5603 | MAPK13 | A002-C-205 | Human | Colorectum | FAP | 2.15e-02 | -1.33e-01 | -0.1236 |
| 5603 | MAPK13 | A015-C-104 | Human | Colorectum | FAP | 6.26e-03 | -1.05e-01 | -0.1899 |
| 5603 | MAPK13 | A002-C-116 | Human | Colorectum | FAP | 1.02e-04 | -1.31e-01 | -0.0452 |
| 5603 | MAPK13 | LZE4T | Human | Esophagus | ESCC | 1.07e-17 | 3.91e-01 | 0.0811 |
| 5603 | MAPK13 | LZE5T | Human | Esophagus | ESCC | 2.17e-02 | 2.91e-01 | 0.0514 |
| 5603 | MAPK13 | LZE7T | Human | Esophagus | ESCC | 1.10e-04 | 5.62e-01 | 0.0667 |
| 5603 | MAPK13 | LZE8T | Human | Esophagus | ESCC | 3.70e-03 | 2.13e-01 | 0.067 |
| 5603 | MAPK13 | LZE20T | Human | Esophagus | ESCC | 8.62e-06 | 4.61e-01 | 0.0662 |
| Page: 1 2 3 4 5 6 7 8 |
| Tissue | Expression Dynamics | Abbreviation |
| Colorectum (GSE201348) |  | FAP: Familial adenomatous polyposis |
| CRC: Colorectal cancer | ||
| Colorectum (HTA11) | 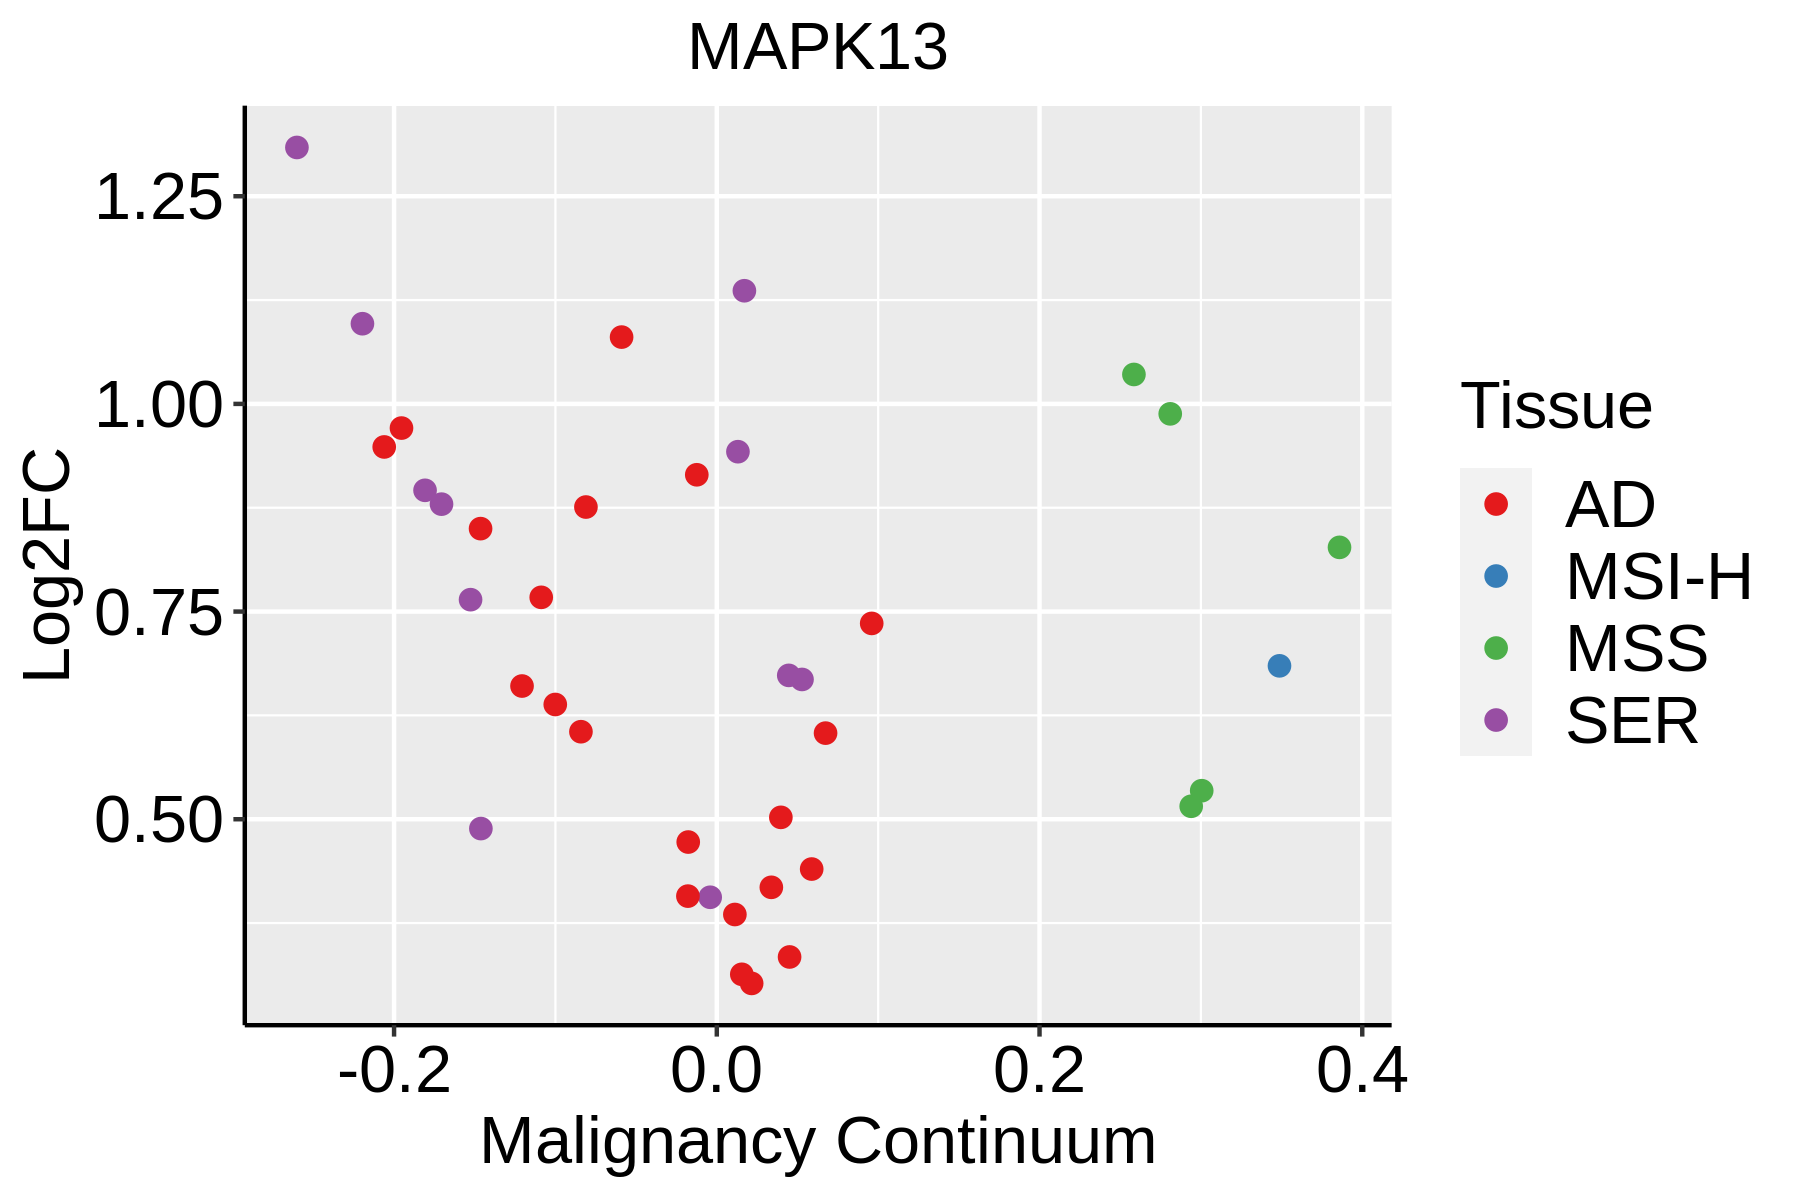 | AD: Adenomas |
| SER: Sessile serrated lesions | ||
| MSI-H: Microsatellite-high colorectal cancer | ||
| MSS: Microsatellite stable colorectal cancer | ||
| Esophagus | 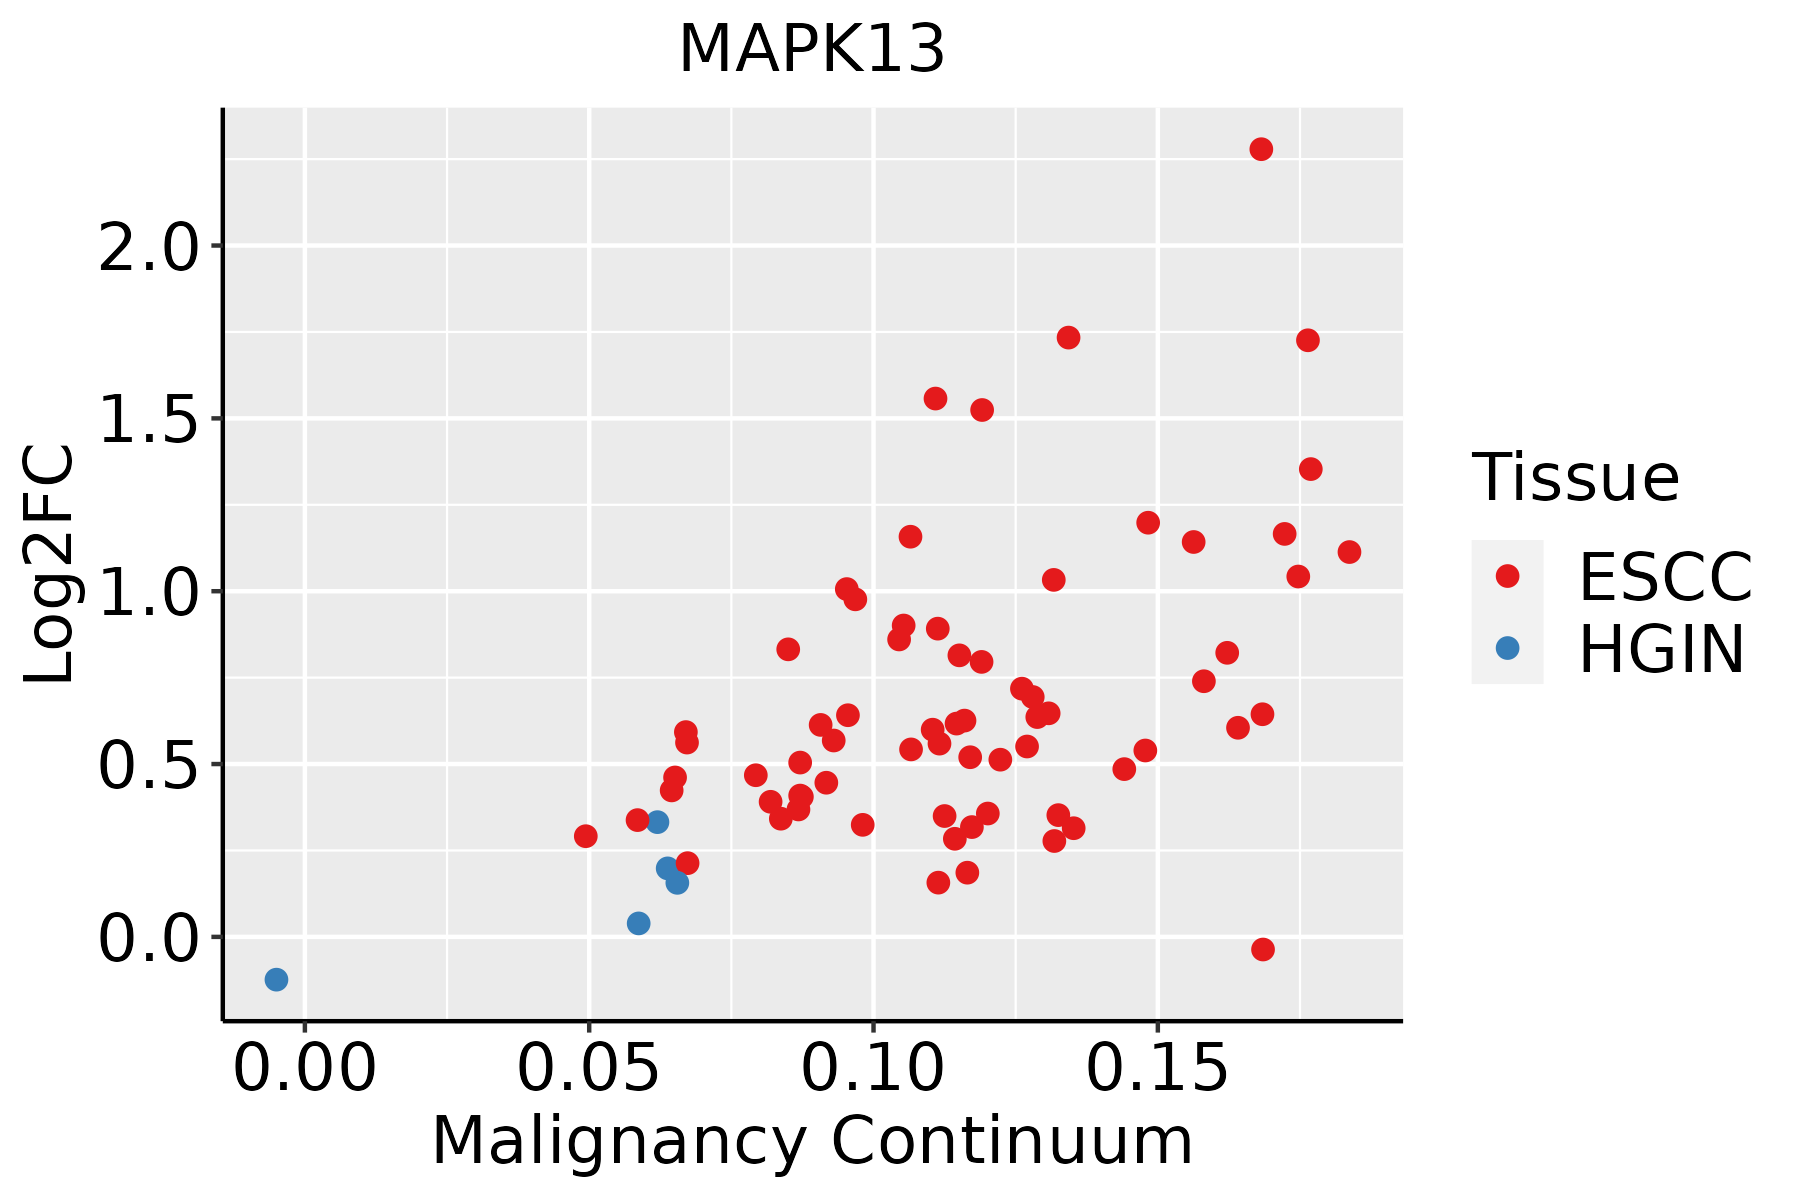 | ESCC: Esophageal squamous cell carcinoma |
| HGIN: High-grade intraepithelial neoplasias | ||
| LGIN: Low-grade intraepithelial neoplasias | ||
| Liver | 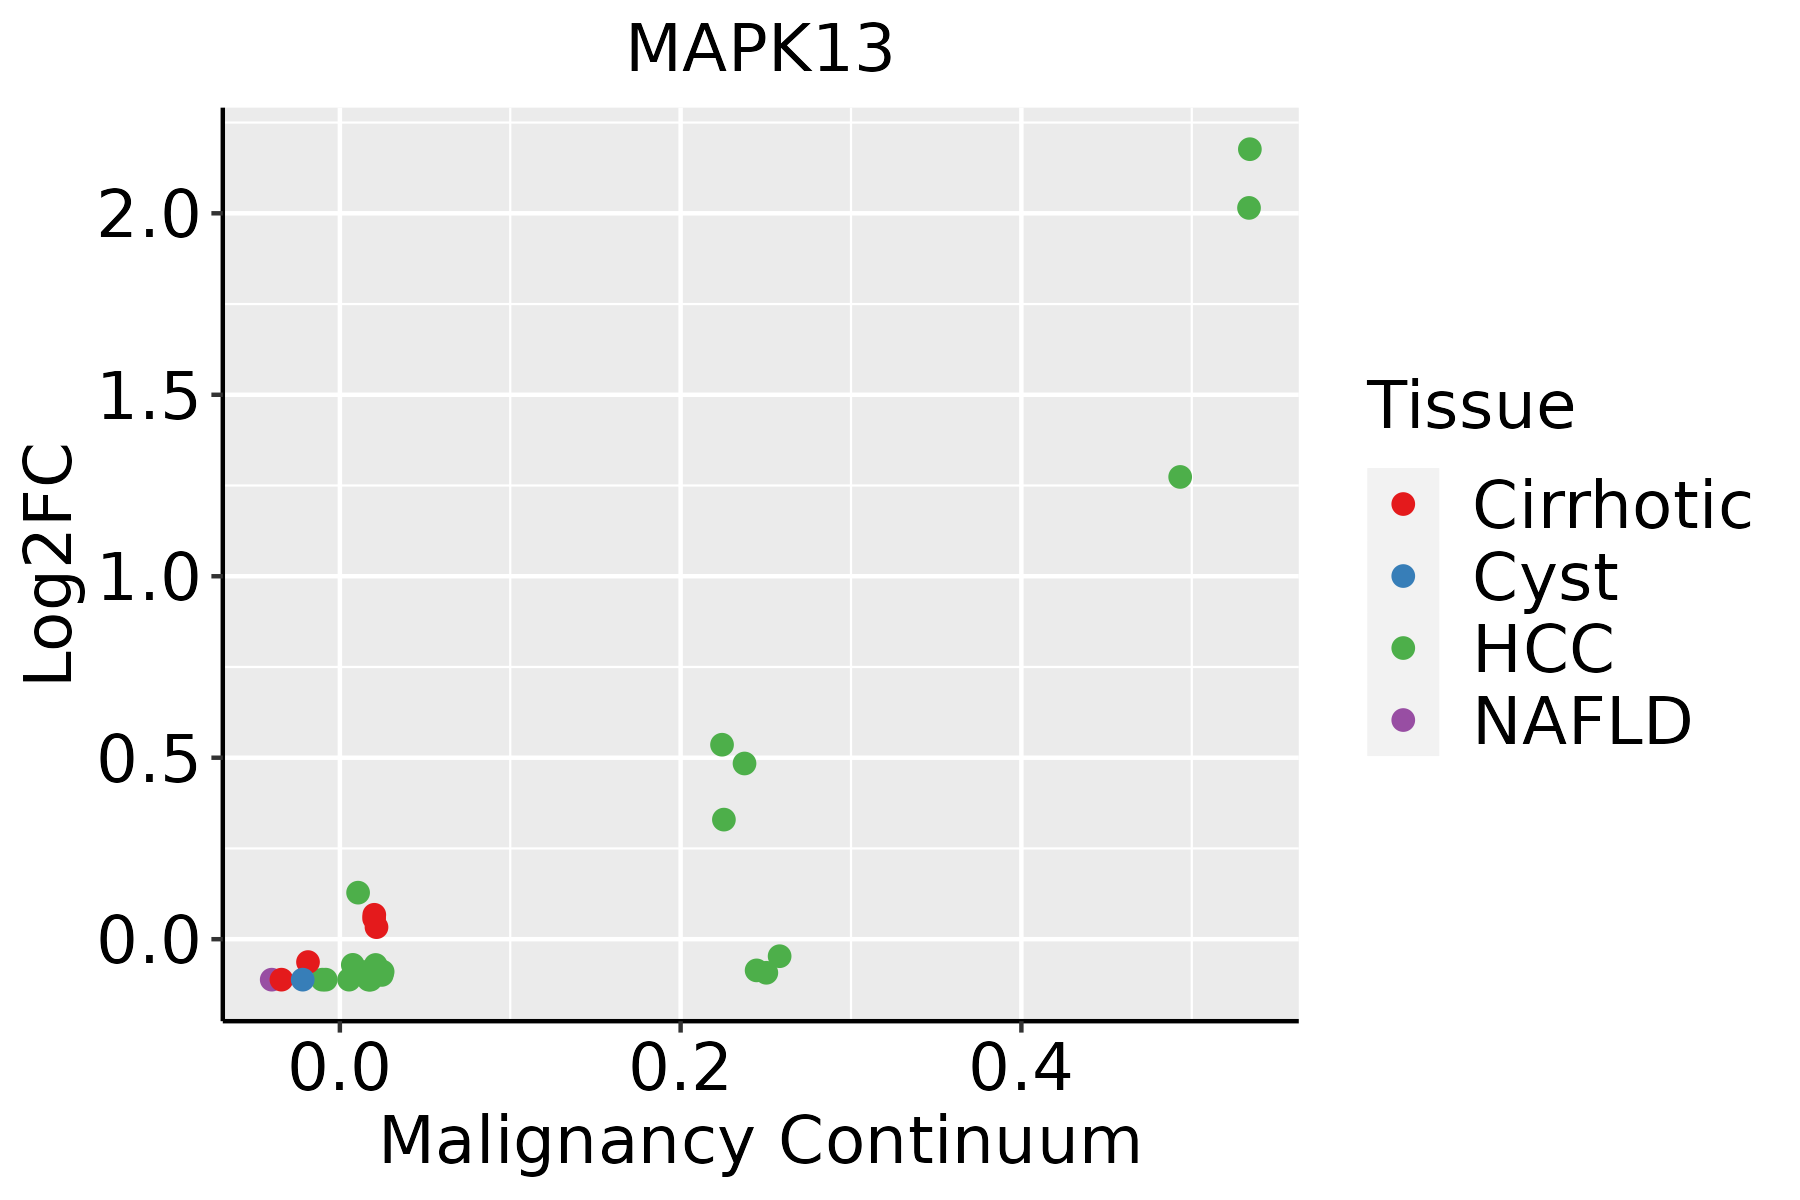 | HCC: Hepatocellular carcinoma |
| NAFLD: Non-alcoholic fatty liver disease | ||
| Oral Cavity | 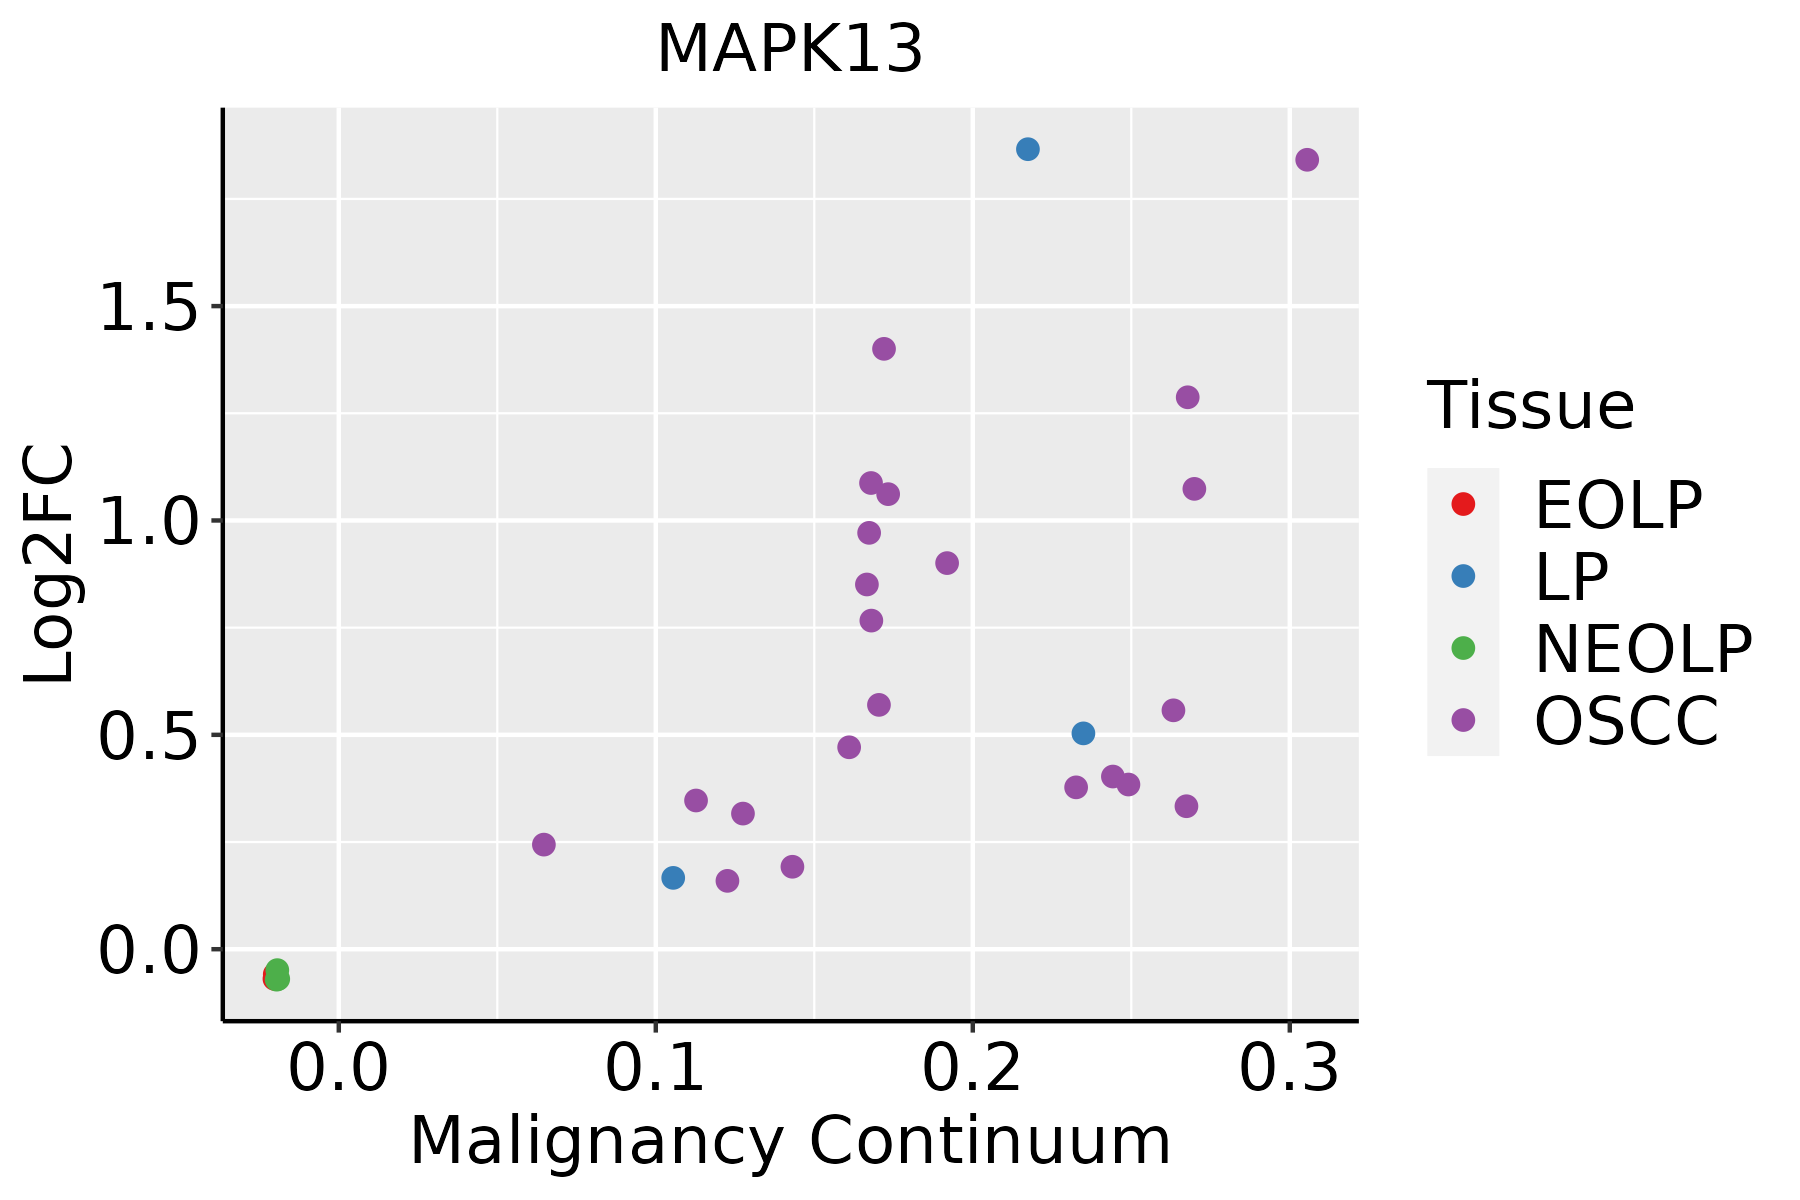 | EOLP: Erosive Oral lichen planus |
| LP: leukoplakia | ||
| NEOLP: Non-erosive oral lichen planus | ||
| OSCC: Oral squamous cell carcinoma | ||
| Skin | 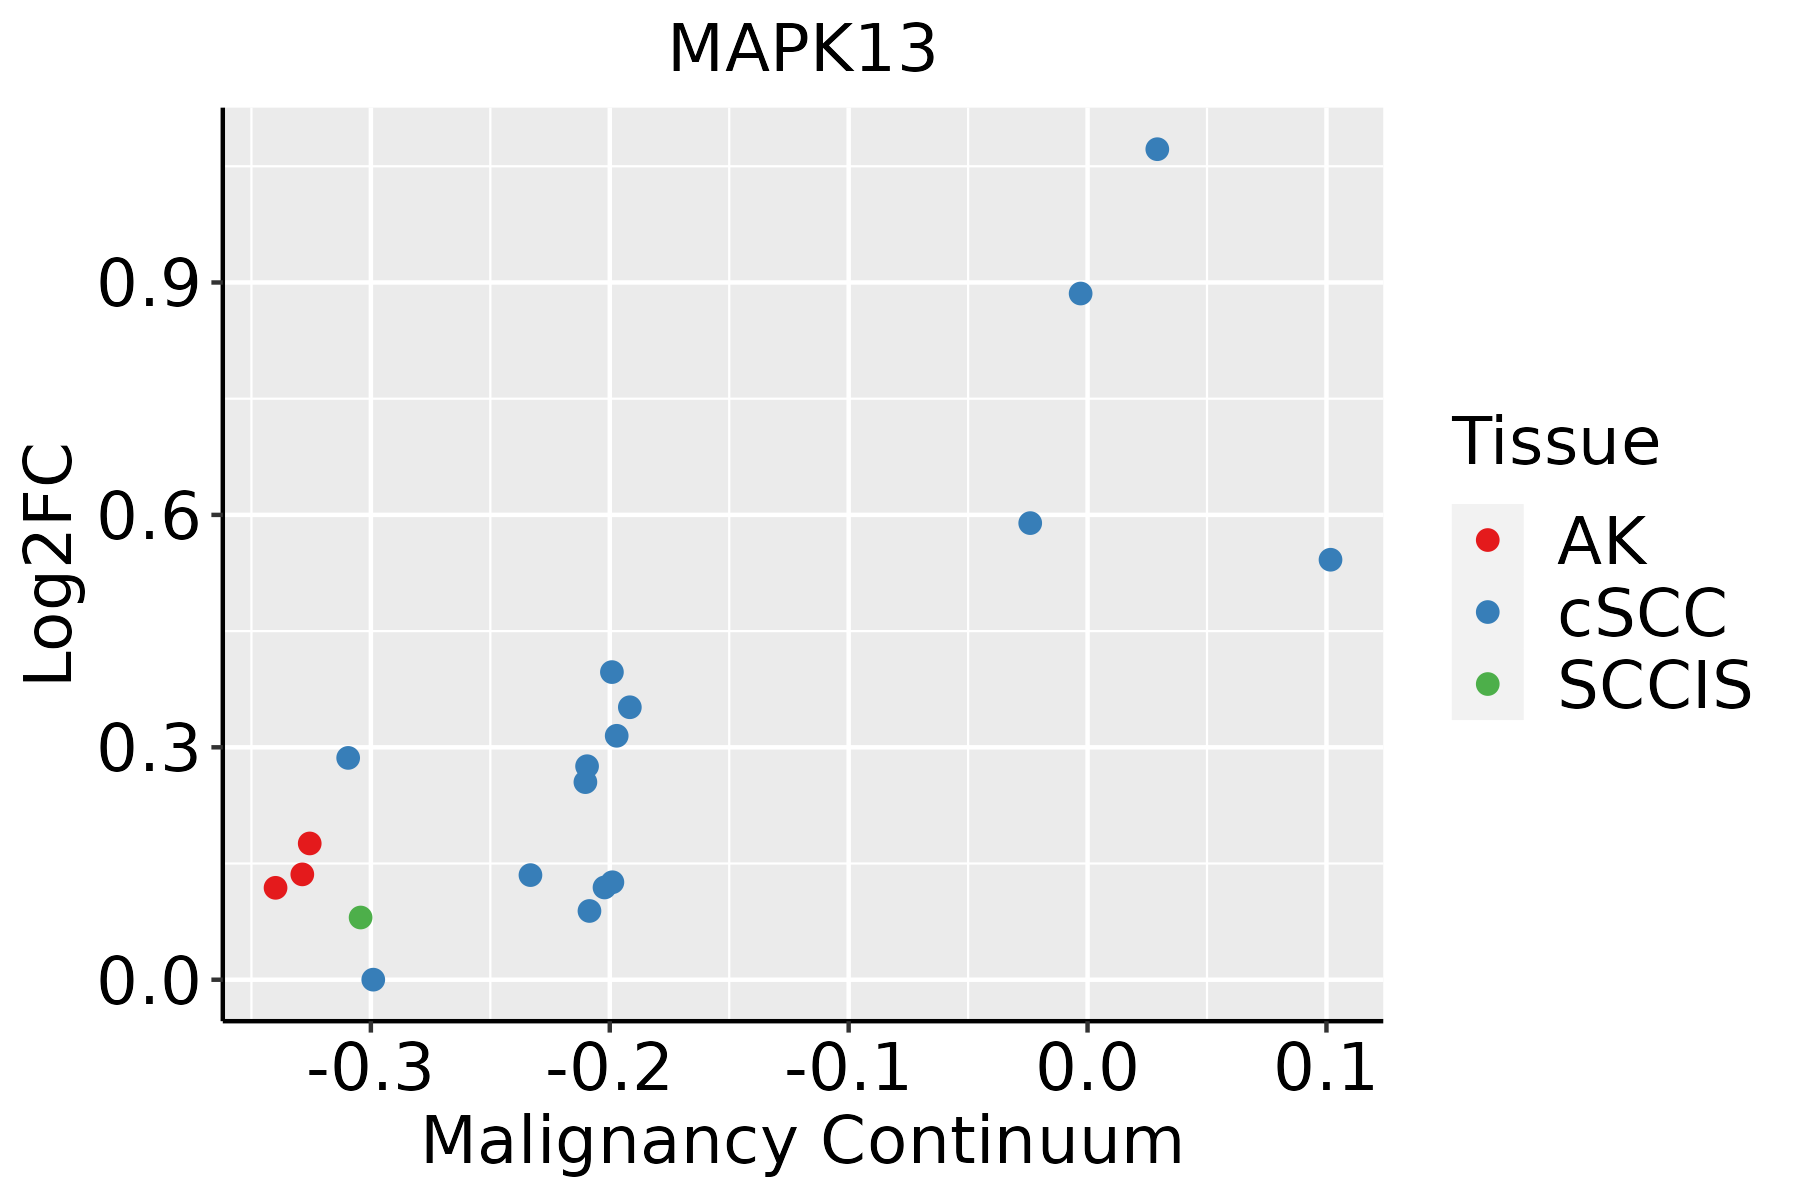 | AK: Actinic keratosis |
| cSCC: Cutaneous squamous cell carcinoma | ||
| SCCIS:squamous cell carcinoma in situ | ||
| Thyroid | 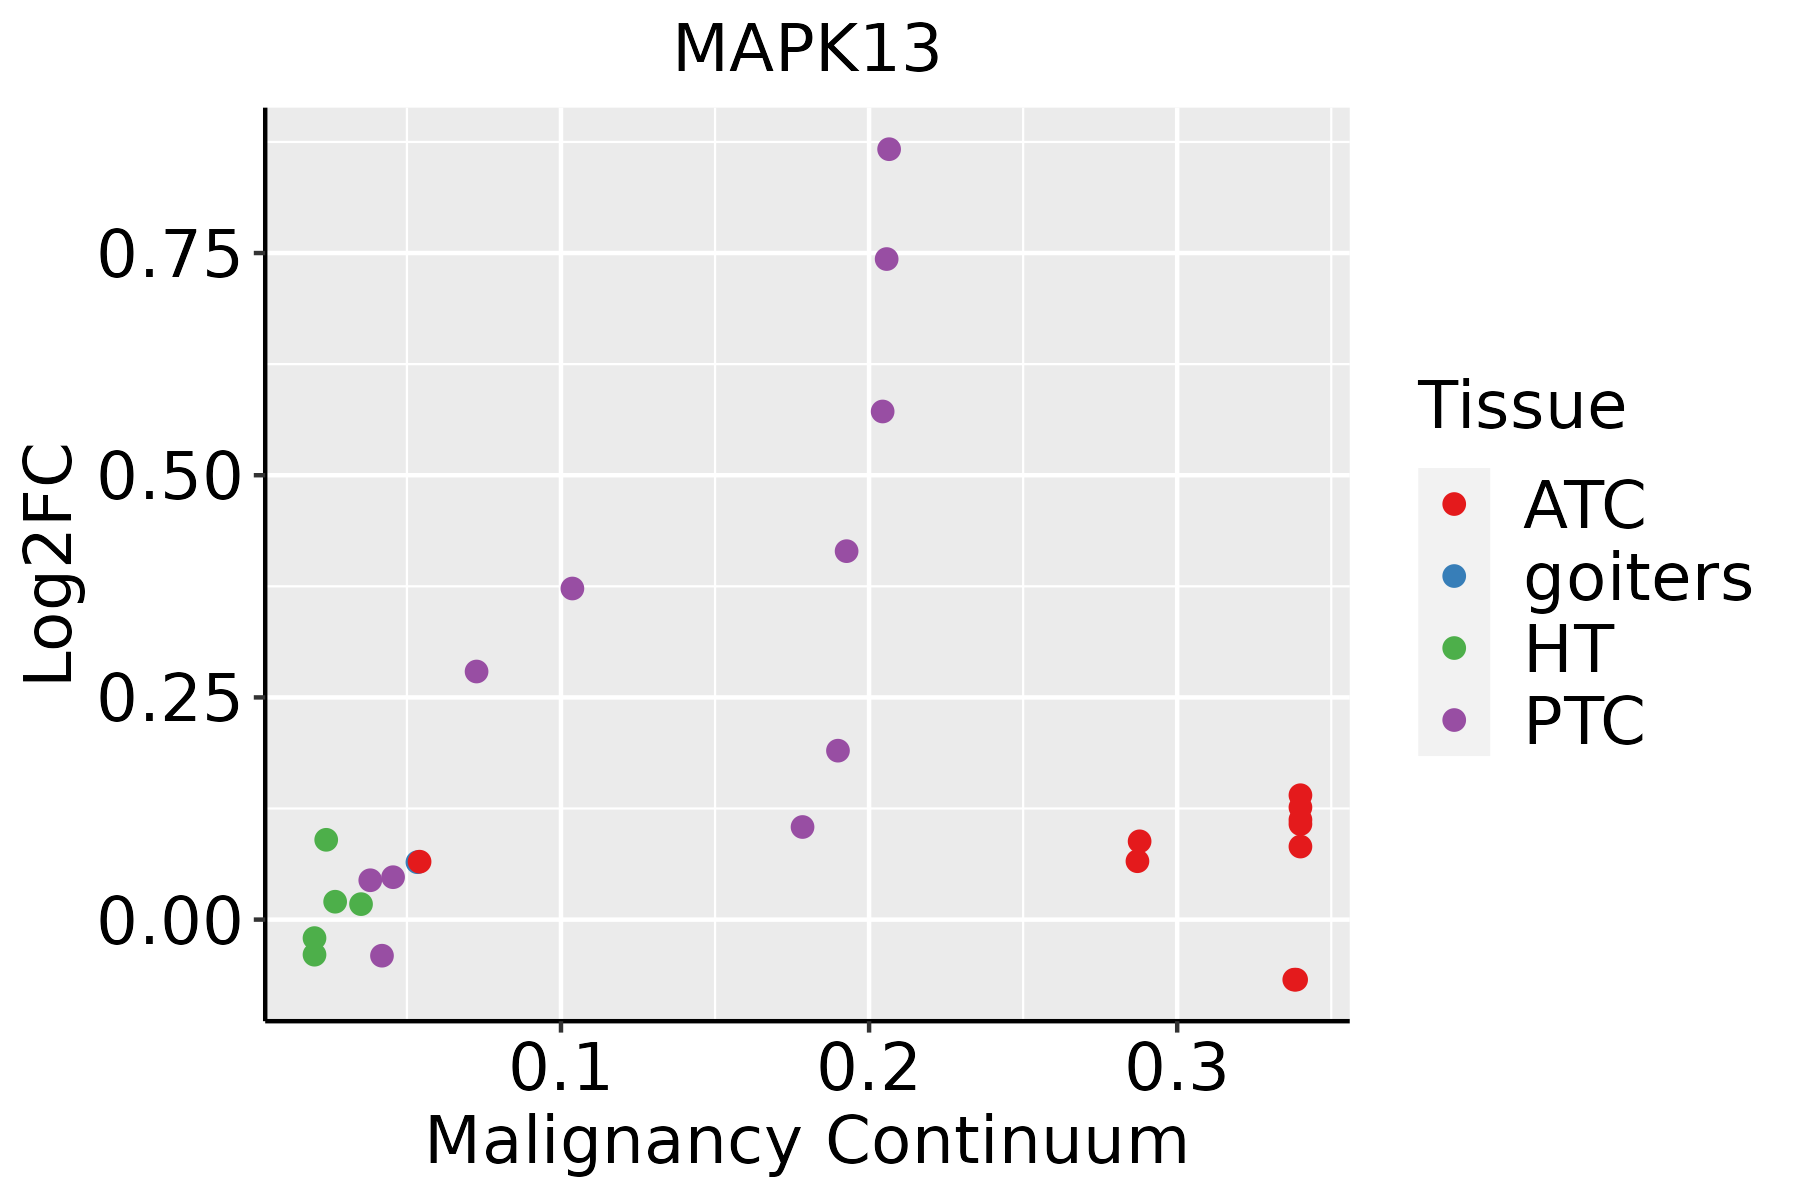 | ATC: Anaplastic thyroid cancer |
| HT: Hashimoto's thyroiditis | ||
| PTC: Papillary thyroid cancer |
| ∗log2FC in expression of this searched gene in stem-like cells from each diseased tissue sample relative to stem-like cells in normal samples in each tissue plotted against the malignancy continuum. Samples are colored based on if they are from different disease stage. |
Top |
Malignant transformation related pathway analysis |
| Find out the enriched GO biological processes and KEGG pathways involved in transition from healthy to precancer to cancer |
| Tissue | Disease Stage | Enriched GO biological Processes |
| Colorectum | AD |  |
| Colorectum | SER |  |
| Colorectum | MSS |  |
| Colorectum | MSI-H |  |
| Colorectum | FAP |  |
| ∗Top 15 enriched GO BP terms are showed in the bar plot of each disease state in each tissue. Each row represents a significant GO biological process which is colored according to the -log10(p.adjust). |
| Page: 1 2 3 4 5 6 7 8 9 |
| GO ID | Tissue | Disease Stage | Description | Gene Ratio | Bg Ratio | pvalue | p.adjust | Count |
| GO:0006979 | Colorectum | AD | response to oxidative stress | 145/3918 | 446/18723 | 5.16e-09 | 3.23e-07 | 145 |
| GO:0062197 | Colorectum | AD | cellular response to chemical stress | 109/3918 | 337/18723 | 5.33e-07 | 1.95e-05 | 109 |
| GO:0000302 | Colorectum | AD | response to reactive oxygen species | 78/3918 | 222/18723 | 6.17e-07 | 2.21e-05 | 78 |
| GO:0009743 | Colorectum | AD | response to carbohydrate | 86/3918 | 253/18723 | 8.43e-07 | 2.90e-05 | 86 |
| GO:0034599 | Colorectum | AD | cellular response to oxidative stress | 94/3918 | 288/18723 | 2.03e-06 | 6.02e-05 | 94 |
| GO:0042542 | Colorectum | AD | response to hydrogen peroxide | 52/3918 | 146/18723 | 2.83e-05 | 5.30e-04 | 52 |
| GO:0071322 | Colorectum | AD | cellular response to carbohydrate stimulus | 56/3918 | 163/18723 | 4.61e-05 | 7.97e-04 | 56 |
| GO:0051403 | Colorectum | AD | stress-activated MAPK cascade | 72/3918 | 239/18723 | 4.77e-04 | 5.25e-03 | 72 |
| GO:0031098 | Colorectum | AD | stress-activated protein kinase signaling cascade | 74/3918 | 247/18723 | 4.80e-04 | 5.27e-03 | 74 |
| GO:0034614 | Colorectum | AD | cellular response to reactive oxygen species | 50/3918 | 155/18723 | 6.25e-04 | 6.49e-03 | 50 |
| GO:0018105 | Colorectum | AD | peptidyl-serine phosphorylation | 88/3918 | 315/18723 | 1.73e-03 | 1.43e-02 | 88 |
| GO:0018209 | Colorectum | AD | peptidyl-serine modification | 92/3918 | 338/18723 | 3.19e-03 | 2.36e-02 | 92 |
| GO:00069791 | Colorectum | SER | response to oxidative stress | 114/2897 | 446/18723 | 1.75e-08 | 1.28e-06 | 114 |
| GO:00003021 | Colorectum | SER | response to reactive oxygen species | 65/2897 | 222/18723 | 1.21e-07 | 7.29e-06 | 65 |
| GO:00621971 | Colorectum | SER | cellular response to chemical stress | 87/2897 | 337/18723 | 5.33e-07 | 2.59e-05 | 87 |
| GO:00345991 | Colorectum | SER | cellular response to oxidative stress | 73/2897 | 288/18723 | 8.52e-06 | 2.86e-04 | 73 |
| GO:00425421 | Colorectum | SER | response to hydrogen peroxide | 42/2897 | 146/18723 | 3.10e-05 | 8.27e-04 | 42 |
| GO:00346141 | Colorectum | SER | cellular response to reactive oxygen species | 41/2897 | 155/18723 | 2.89e-04 | 4.74e-03 | 41 |
| GO:00097431 | Colorectum | SER | response to carbohydrate | 60/2897 | 253/18723 | 3.66e-04 | 5.67e-03 | 60 |
| GO:0071243 | Colorectum | SER | cellular response to arsenic-containing substance | 9/2897 | 20/18723 | 1.66e-03 | 1.72e-02 | 9 |
| Page: 1 2 3 4 5 6 7 8 9 10 11 12 13 14 15 |
| Pathway ID | Tissue | Disease Stage | Description | Gene Ratio | Bg Ratio | pvalue | p.adjust | qvalue | Count |
| hsa05208 | Colorectum | AD | Chemical carcinogenesis - reactive oxygen species | 126/2092 | 223/8465 | 1.01e-24 | 1.68e-22 | 1.07e-22 | 126 |
| hsa05415 | Colorectum | AD | Diabetic cardiomyopathy | 114/2092 | 203/8465 | 3.65e-22 | 3.06e-20 | 1.95e-20 | 114 |
| hsa04714 | Colorectum | AD | Thermogenesis | 120/2092 | 232/8465 | 2.76e-19 | 1.16e-17 | 7.37e-18 | 120 |
| hsa04932 | Colorectum | AD | Non-alcoholic fatty liver disease | 90/2092 | 155/8465 | 4.83e-19 | 1.80e-17 | 1.15e-17 | 90 |
| hsa05020 | Colorectum | AD | Prion disease | 133/2092 | 273/8465 | 2.47e-18 | 8.29e-17 | 5.29e-17 | 133 |
| hsa05014 | Colorectum | AD | Amyotrophic lateral sclerosis | 164/2092 | 364/8465 | 4.28e-18 | 1.27e-16 | 8.09e-17 | 164 |
| hsa05022 | Colorectum | AD | Pathways of neurodegeneration - multiple diseases | 201/2092 | 476/8465 | 4.54e-18 | 1.27e-16 | 8.09e-17 | 201 |
| hsa05171 | Colorectum | AD | Coronavirus disease - COVID-19 | 113/2092 | 232/8465 | 9.90e-16 | 2.55e-14 | 1.63e-14 | 113 |
| hsa05131 | Colorectum | AD | Shigellosis | 109/2092 | 247/8465 | 1.09e-11 | 2.44e-10 | 1.55e-10 | 109 |
| hsa05132 | Colorectum | AD | Salmonella infection | 102/2092 | 249/8465 | 7.65e-09 | 1.28e-07 | 8.17e-08 | 102 |
| hsa05130 | Colorectum | AD | Pathogenic Escherichia coli infection | 79/2092 | 197/8465 | 1.05e-06 | 1.36e-05 | 8.65e-06 | 79 |
| hsa05135 | Colorectum | AD | Yersinia infection | 58/2092 | 137/8465 | 3.90e-06 | 4.35e-05 | 2.78e-05 | 58 |
| hsa04722 | Colorectum | AD | Neurotrophin signaling pathway | 50/2092 | 119/8465 | 2.28e-05 | 2.24e-04 | 1.43e-04 | 50 |
| hsa04723 | Colorectum | AD | Retrograde endocannabinoid signaling | 59/2092 | 148/8465 | 2.94e-05 | 2.73e-04 | 1.74e-04 | 59 |
| hsa05418 | Colorectum | AD | Fluid shear stress and atherosclerosis | 54/2092 | 139/8465 | 1.41e-04 | 1.16e-03 | 7.37e-04 | 54 |
| hsa05417 | Colorectum | AD | Lipid and atherosclerosis | 73/2092 | 215/8465 | 1.31e-03 | 8.27e-03 | 5.27e-03 | 73 |
| hsa05205 | Colorectum | AD | Proteoglycans in cancer | 70/2092 | 205/8465 | 1.37e-03 | 8.46e-03 | 5.39e-03 | 70 |
| hsa05170 | Colorectum | AD | Human immunodeficiency virus 1 infection | 72/2092 | 212/8465 | 1.40e-03 | 8.46e-03 | 5.39e-03 | 72 |
| hsa04015 | Colorectum | AD | Rap1 signaling pathway | 71/2092 | 210/8465 | 1.72e-03 | 9.68e-03 | 6.18e-03 | 71 |
| hsa05163 | Colorectum | AD | Human cytomegalovirus infection | 75/2092 | 225/8465 | 2.00e-03 | 1.10e-02 | 7.01e-03 | 75 |
| Page: 1 2 3 4 5 6 7 8 9 10 11 12 13 14 15 16 17 18 19 20 21 22 23 24 25 26 27 28 29 30 31 32 |
Top |
Cell-cell communication analysis |
| Identification of potential cell-cell interactions between two cell types and their ligand-receptor pairs for different disease states |
| Ligand | Receptor | LRpair | Pathway | Tissue | Disease Stage |
| Page: 1 |
Top |
Single-cell gene regulatory network inference analysis |
| Find out the significant the regulons (TFs) and the target genes of each regulon across cell types for different disease states |
| TF | Cell Type | Tissue | Disease Stage | Target Gene | RSS | Regulon Activity |
| ∗The dot plots of a searched regulon are shown for all cell subpopulations in each disease state of each tissue based on the regulon specific score inferred using pySCENIC and by calculating the average expression. |
| Page: 1 |
Top |
Somatic mutation of malignant transformation related genes |
| Annotation of somatic variants for genes involved in malignant transformation |
| Hugo Symbol | Variant Class | Variant Classification | dbSNP RS | HGVSc | HGVSp | HGVSp Short | SWISSPROT | BIOTYPE | SIFT | PolyPhen | Tumor Sample Barcode | Tissue | Histology | Sex | Age | Stage | Therapy Types | Drugs | Outcome |
| MAPK13 | SNV | Missense_Mutation | c.943G>A | p.Glu315Lys | p.E315K | O15264 | protein_coding | tolerated(0.12) | benign(0.04) | TCGA-D8-A1XJ-01 | Breast | breast invasive carcinoma | Female | >=65 | III/IV | Hormone Therapy | tamoxiphen | SD | |
| MAPK13 | insertion | Nonsense_Mutation | novel | c.512_513insCCCCTAAGA | p.Leu171_Ala172insProTerGlu | p.L171_A172insP*E | O15264 | protein_coding | TCGA-B6-A0IK-01 | Breast | breast invasive carcinoma | Female | <65 | III/IV | Unknown | Unknown | PD | ||
| MAPK13 | SNV | Missense_Mutation | rs141413397 | c.1075C>T | p.Arg359Cys | p.R359C | O15264 | protein_coding | deleterious(0) | possibly_damaging(0.724) | TCGA-2W-A8YY-01 | Cervix | cervical & endocervical cancer | Female | <65 | I/II | Chemotherapy | cisplatin | CR |
| MAPK13 | SNV | Missense_Mutation | c.943N>A | p.Glu315Lys | p.E315K | O15264 | protein_coding | tolerated(0.12) | benign(0.04) | TCGA-C5-A8XK-01 | Cervix | cervical & endocervical cancer | Female | <65 | I/II | Chemotherapy | cisplatin | SD | |
| MAPK13 | SNV | Missense_Mutation | rs762484290 | c.574N>A | p.Glu192Lys | p.E192K | O15264 | protein_coding | deleterious(0) | probably_damaging(0.975) | TCGA-A6-6781-01 | Colorectum | colon adenocarcinoma | Male | <65 | III/IV | Chemotherapy | oxaliplatin | SD |
| MAPK13 | SNV | Missense_Mutation | c.885N>C | p.Lys295Asn | p.K295N | O15264 | protein_coding | tolerated(0.08) | benign(0.081) | TCGA-AA-3812-01 | Colorectum | colon adenocarcinoma | Female | >=65 | I/II | Unknown | Unknown | PD | |
| MAPK13 | SNV | Missense_Mutation | c.155N>T | p.Ala52Val | p.A52V | O15264 | protein_coding | deleterious(0) | probably_damaging(1) | TCGA-G4-6588-01 | Colorectum | colon adenocarcinoma | Female | <65 | I/II | Unknown | Unknown | SD | |
| MAPK13 | SNV | Missense_Mutation | c.593N>C | p.Met198Thr | p.M198T | O15264 | protein_coding | deleterious(0.02) | probably_damaging(0.998) | TCGA-AG-A02X-01 | Colorectum | rectum adenocarcinoma | Male | >=65 | I/II | Unknown | Unknown | SD | |
| MAPK13 | deletion | Frame_Shift_Del | c.569delN | p.Glu192ArgfsTer2 | p.E192Rfs*2 | O15264 | protein_coding | TCGA-G4-6586-01 | Colorectum | colon adenocarcinoma | Female | >=65 | I/II | Unknown | Unknown | SD | |||
| MAPK13 | SNV | Missense_Mutation | novel | c.445N>G | p.Arg149Gly | p.R149G | O15264 | protein_coding | deleterious(0) | probably_damaging(0.952) | TCGA-AJ-A3OJ-01 | Endometrium | uterine corpus endometrioid carcinoma | Female | <65 | I/II | Chemotherapy | carboplatin | CR |
| Page: 1 2 3 |
Top |
Related drugs of malignant transformation related genes |
| Identification of chemicals and drugs interact with genes involved in malignant transfromation |
| (DGIdb 4.0) |
| Entrez ID | Symbol | Category | Interaction Types | Drug Claim Name | Drug Name | PMIDs |
| 5603 | MAPK13 | KINASE, TRANSCRIPTION FACTOR, DRUGGABLE GENOME, SERINE THREONINE KINASE, ENZYME | OPHIOBOLIN O | OPHIOBOLIN O | 22130129 | |
| 5603 | MAPK13 | KINASE, TRANSCRIPTION FACTOR, DRUGGABLE GENOME, SERINE THREONINE KINASE, ENZYME | inhibitor | 249565859 | PF-03715455 | |
| 5603 | MAPK13 | KINASE, TRANSCRIPTION FACTOR, DRUGGABLE GENOME, SERINE THREONINE KINASE, ENZYME | SEMAPIMOD | SEMAPIMOD | ||
| 5603 | MAPK13 | KINASE, TRANSCRIPTION FACTOR, DRUGGABLE GENOME, SERINE THREONINE KINASE, ENZYME | SNS-314 | SNS-314 | ||
| 5603 | MAPK13 | KINASE, TRANSCRIPTION FACTOR, DRUGGABLE GENOME, SERINE THREONINE KINASE, ENZYME | ARRY-797 | ARRY-797 | ||
| 5603 | MAPK13 | KINASE, TRANSCRIPTION FACTOR, DRUGGABLE GENOME, SERINE THREONINE KINASE, ENZYME | MILTIRONE | MILTIRONE | 26339922 | |
| 5603 | MAPK13 | KINASE, TRANSCRIPTION FACTOR, DRUGGABLE GENOME, SERINE THREONINE KINASE, ENZYME | TAMATINIB | R-406 | ||
| 5603 | MAPK13 | KINASE, TRANSCRIPTION FACTOR, DRUGGABLE GENOME, SERINE THREONINE KINASE, ENZYME | DIHYDROTANSHINONE I | DIHYDROTANSHINONE I | 26339922 | |
| 5603 | MAPK13 | KINASE, TRANSCRIPTION FACTOR, DRUGGABLE GENOME, SERINE THREONINE KINASE, ENZYME | VX-702 | VX-702 | ||
| 5603 | MAPK13 | KINASE, TRANSCRIPTION FACTOR, DRUGGABLE GENOME, SERINE THREONINE KINASE, ENZYME | DORAMAPIMOD | DORAMAPIMOD |
| Page: 1 2 3 |

Copyright 2023-Present -The University of Texas Health Science Center at Houston |