
|
|||||
|
 | |
| |
| |
| |
| |
| |
|
Gene: LONRF1 |
Gene summary for LONRF1 |
| Gene information | Species | Human | Gene symbol | LONRF1 | Gene ID | 91694 |
| Gene name | LON peptidase N-terminal domain and ring finger 1 | |
| Gene Alias | RNF191 | |
| Cytomap | 8p23.1 | |
| Gene Type | protein-coding | GO ID | GO:0005575 | UniProtAcc | Q17RB8 |
Top |
Malignant transformation analysis |
| Identification of the aberrant gene expression in precancerous and cancerous lesions by comparing the gene expression of stem-like cells in diseased tissues with normal stem cells |
| Entrez ID | Symbol | Replicates | Species | Organ | Tissue | Adj P-value | Log2FC | Malignancy |
| 91694 | LONRF1 | P31T-E | Human | Esophagus | ESCC | 1.05e-09 | -4.86e-02 | 0.1251 |
| 91694 | LONRF1 | P32T-E | Human | Esophagus | ESCC | 2.83e-09 | 6.51e-03 | 0.1666 |
| 91694 | LONRF1 | P36T-E | Human | Esophagus | ESCC | 1.86e-11 | 3.17e-01 | 0.1187 |
| 91694 | LONRF1 | P37T-E | Human | Esophagus | ESCC | 1.05e-07 | -5.00e-02 | 0.1371 |
| 91694 | LONRF1 | P39T-E | Human | Esophagus | ESCC | 6.42e-10 | 1.27e-01 | 0.0894 |
| 91694 | LONRF1 | P40T-E | Human | Esophagus | ESCC | 5.11e-08 | 1.32e-01 | 0.109 |
| 91694 | LONRF1 | P42T-E | Human | Esophagus | ESCC | 2.30e-06 | 3.79e-02 | 0.1175 |
| 91694 | LONRF1 | P47T-E | Human | Esophagus | ESCC | 9.85e-12 | 5.24e-02 | 0.1067 |
| 91694 | LONRF1 | P48T-E | Human | Esophagus | ESCC | 4.46e-13 | 2.36e-01 | 0.0959 |
| 91694 | LONRF1 | P52T-E | Human | Esophagus | ESCC | 1.14e-07 | 2.23e-02 | 0.1555 |
| 91694 | LONRF1 | P54T-E | Human | Esophagus | ESCC | 3.91e-17 | 1.39e-01 | 0.0975 |
| 91694 | LONRF1 | P56T-E | Human | Esophagus | ESCC | 5.43e-03 | 4.19e-01 | 0.1613 |
| 91694 | LONRF1 | P57T-E | Human | Esophagus | ESCC | 5.54e-12 | 3.83e-02 | 0.0926 |
| 91694 | LONRF1 | P61T-E | Human | Esophagus | ESCC | 3.88e-09 | 1.54e-01 | 0.099 |
| 91694 | LONRF1 | P62T-E | Human | Esophagus | ESCC | 2.27e-05 | 3.44e-02 | 0.1302 |
| 91694 | LONRF1 | P65T-E | Human | Esophagus | ESCC | 3.06e-09 | 3.68e-02 | 0.0978 |
| 91694 | LONRF1 | P75T-E | Human | Esophagus | ESCC | 6.67e-03 | -1.13e-01 | 0.1125 |
| 91694 | LONRF1 | P76T-E | Human | Esophagus | ESCC | 8.11e-05 | 1.15e-02 | 0.1207 |
| 91694 | LONRF1 | P79T-E | Human | Esophagus | ESCC | 7.29e-20 | 2.33e-01 | 0.1154 |
| 91694 | LONRF1 | P80T-E | Human | Esophagus | ESCC | 1.52e-04 | 1.34e-01 | 0.155 |
| Page: 1 2 3 |
| Tissue | Expression Dynamics | Abbreviation |
| Esophagus | 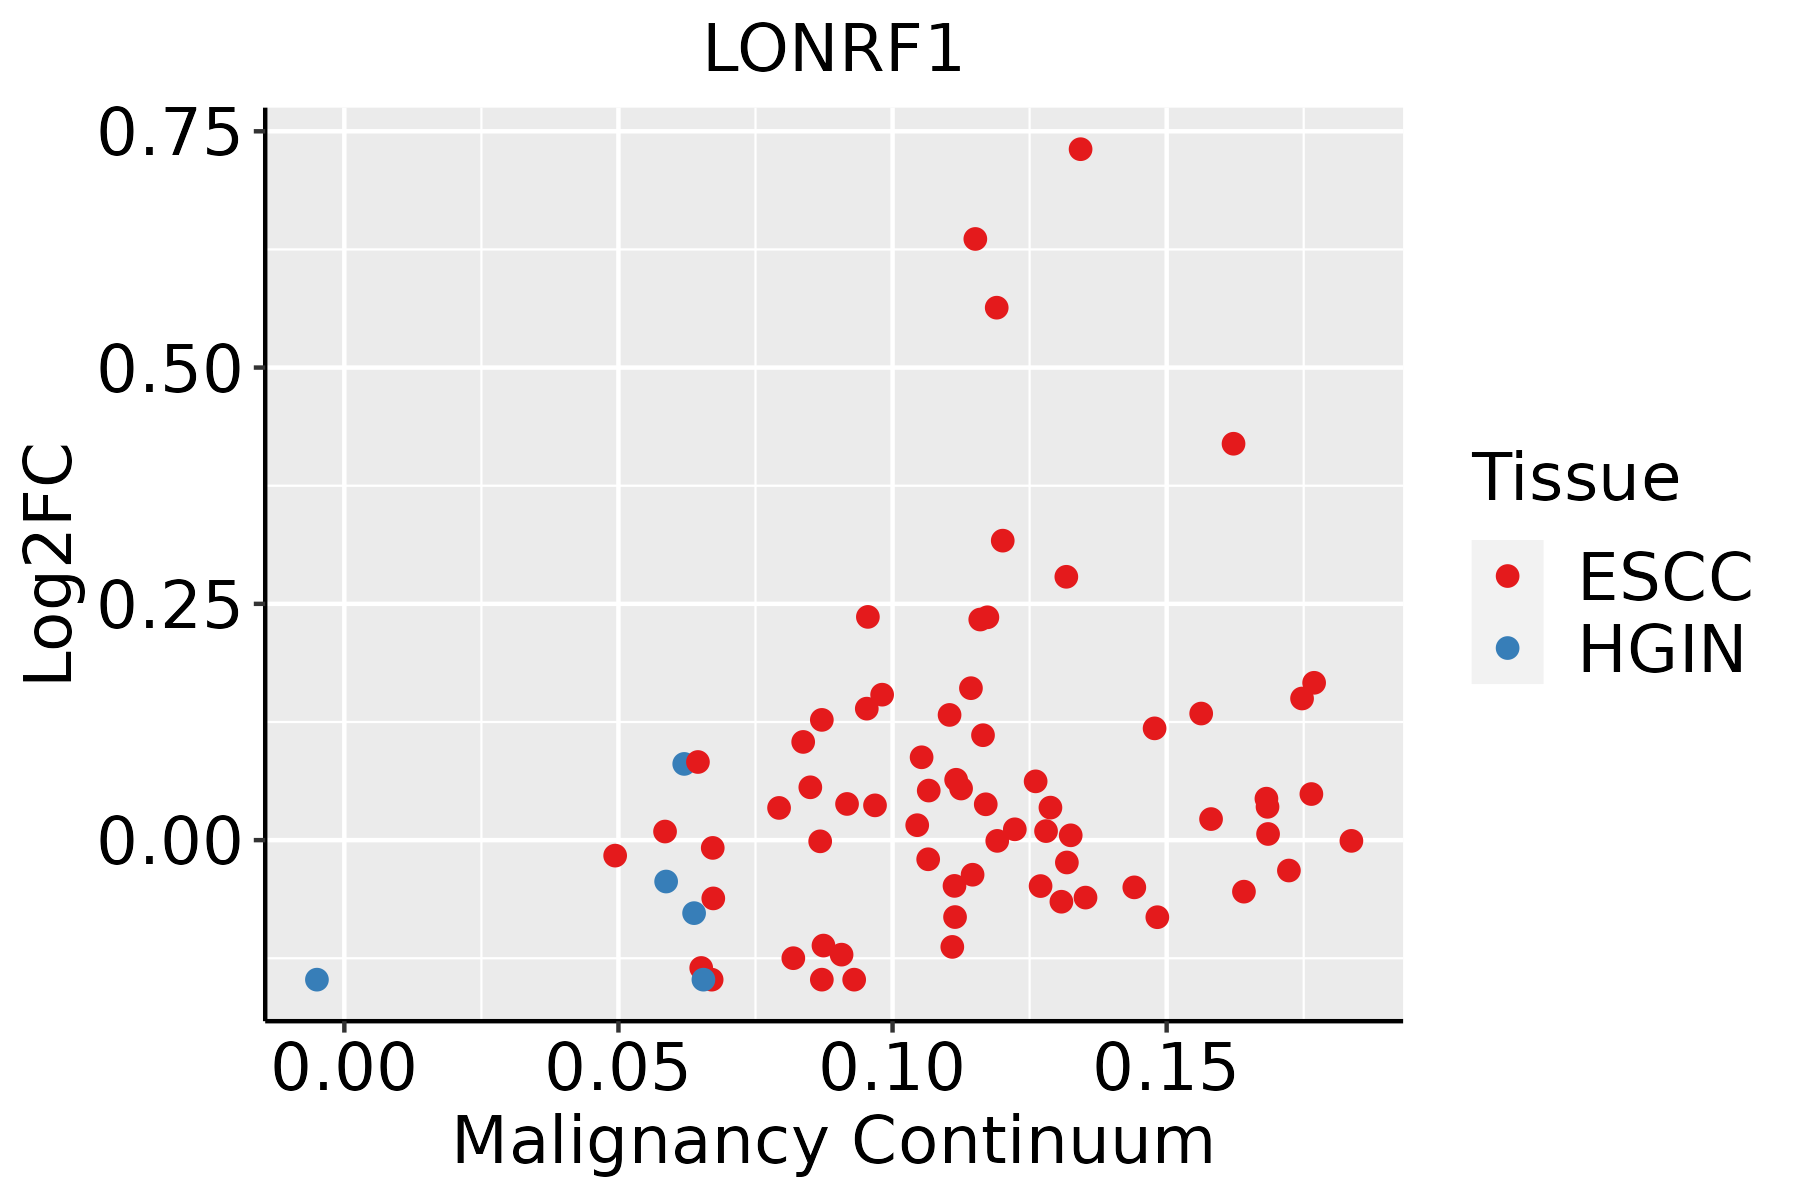 | ESCC: Esophageal squamous cell carcinoma |
| HGIN: High-grade intraepithelial neoplasias | ||
| LGIN: Low-grade intraepithelial neoplasias | ||
| Skin | 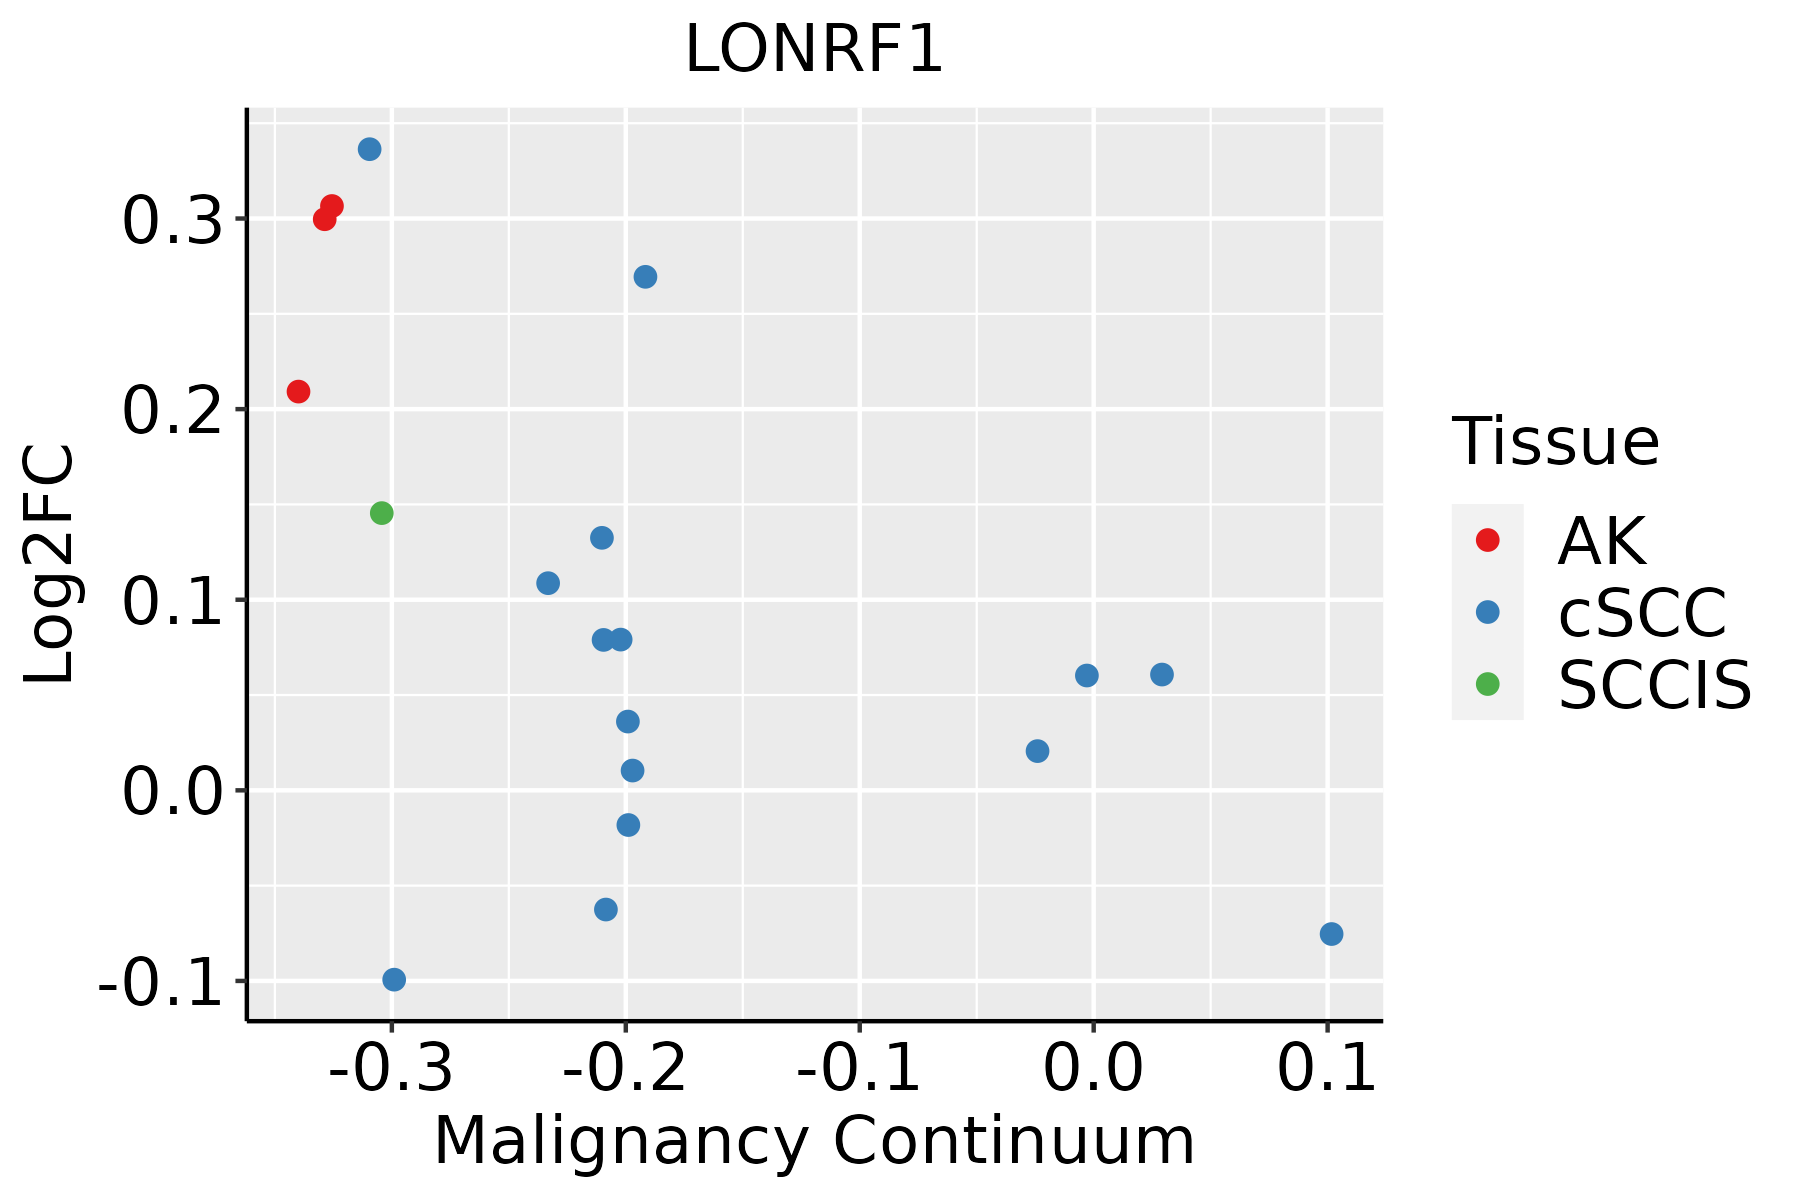 | AK: Actinic keratosis |
| cSCC: Cutaneous squamous cell carcinoma | ||
| SCCIS:squamous cell carcinoma in situ | ||
| Thyroid | 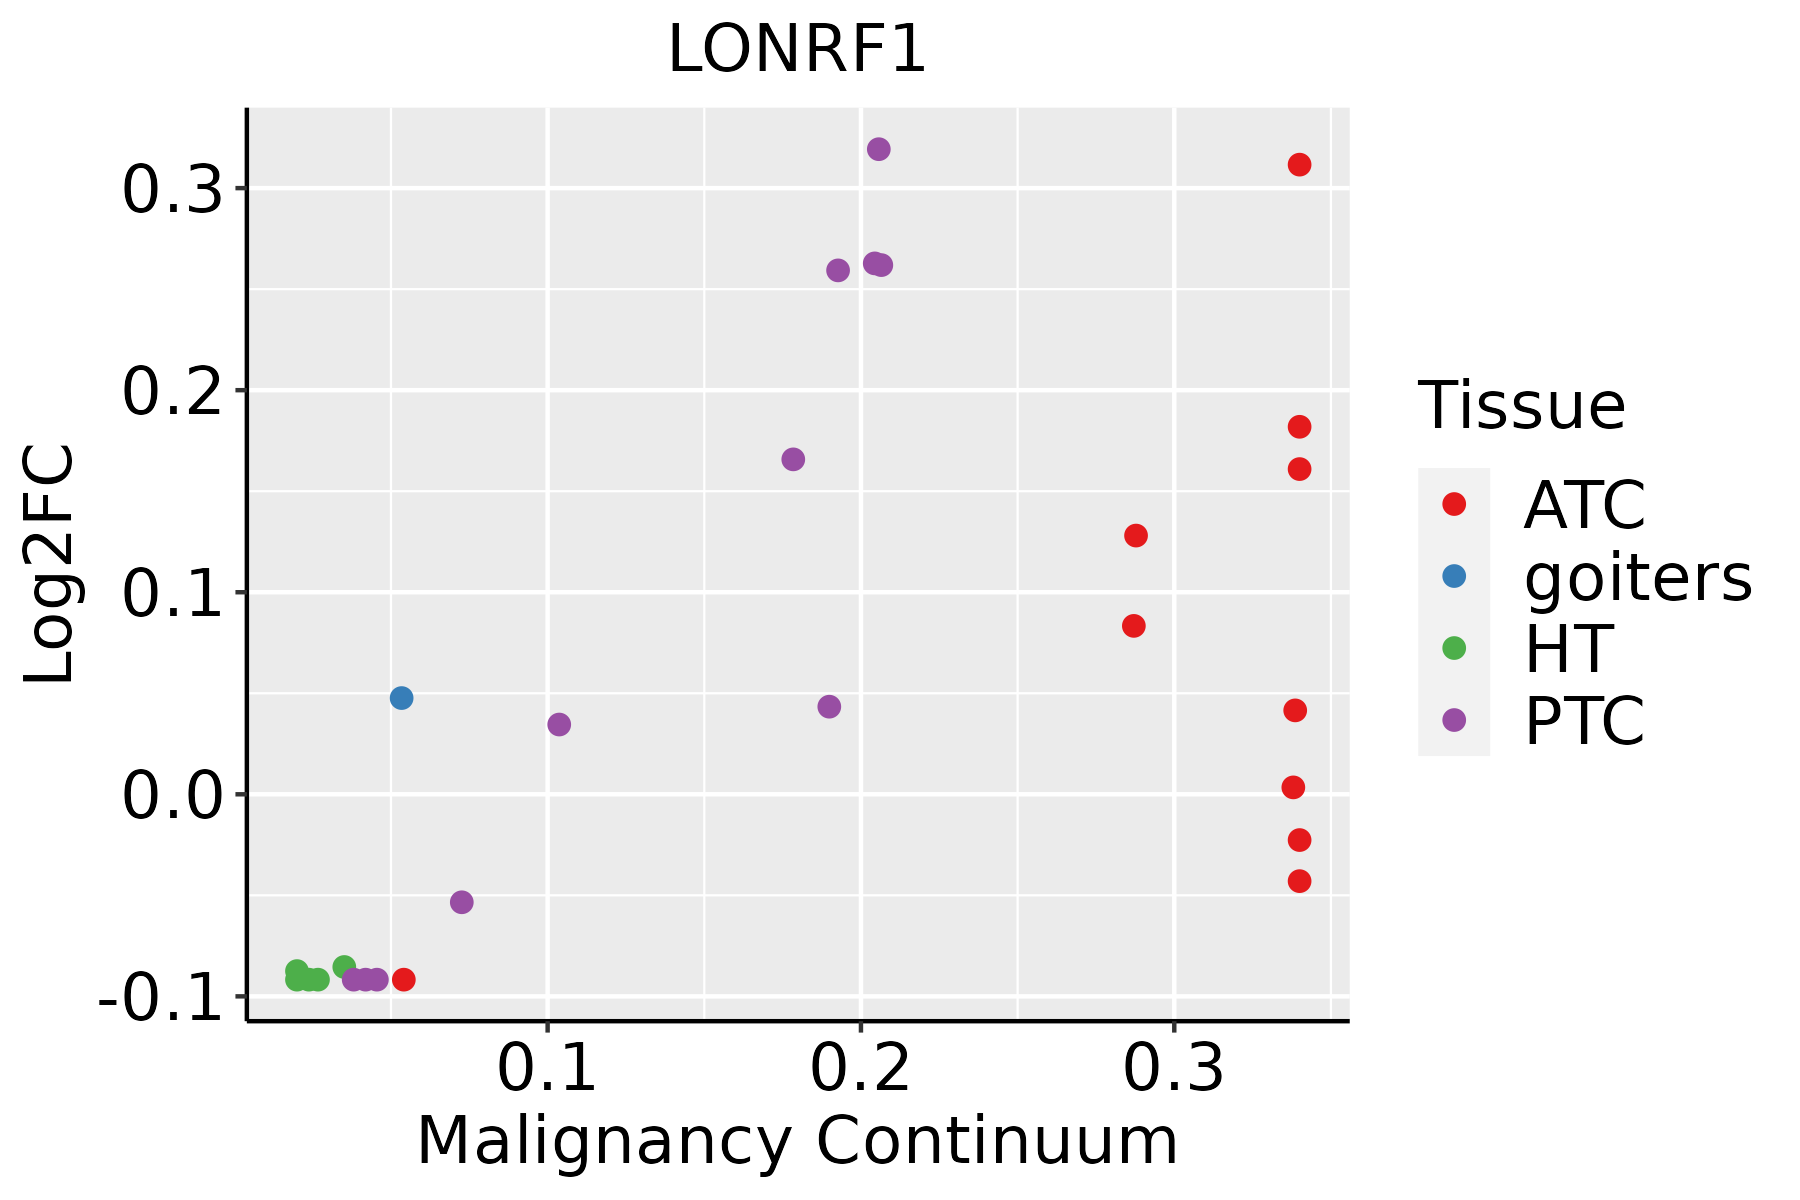 | ATC: Anaplastic thyroid cancer |
| HT: Hashimoto's thyroiditis | ||
| PTC: Papillary thyroid cancer |
| ∗log2FC in expression of this searched gene in stem-like cells from each diseased tissue sample relative to stem-like cells in normal samples in each tissue plotted against the malignancy continuum. Samples are colored based on if they are from different disease stage. |
Top |
Malignant transformation related pathway analysis |
| Find out the enriched GO biological processes and KEGG pathways involved in transition from healthy to precancer to cancer |
| Tissue | Disease Stage | Enriched GO biological Processes |
| Colorectum | AD |  |
| Colorectum | SER |  |
| Colorectum | MSS |  |
| Colorectum | MSI-H |  |
| Colorectum | FAP |  |
| ∗Top 15 enriched GO BP terms are showed in the bar plot of each disease state in each tissue. Each row represents a significant GO biological process which is colored according to the -log10(p.adjust). |
| Page: 1 2 3 4 5 6 7 8 9 |
| GO ID | Tissue | Disease Stage | Description | Gene Ratio | Bg Ratio | pvalue | p.adjust | Count |
| Page: 1 |
| Pathway ID | Tissue | Disease Stage | Description | Gene Ratio | Bg Ratio | pvalue | p.adjust | qvalue | Count |
| Page: 1 |
Top |
Cell-cell communication analysis |
| Identification of potential cell-cell interactions between two cell types and their ligand-receptor pairs for different disease states |
| Ligand | Receptor | LRpair | Pathway | Tissue | Disease Stage |
| Page: 1 |
Top |
Single-cell gene regulatory network inference analysis |
| Find out the significant the regulons (TFs) and the target genes of each regulon across cell types for different disease states |
| TF | Cell Type | Tissue | Disease Stage | Target Gene | RSS | Regulon Activity |
| ∗The dot plots of a searched regulon are shown for all cell subpopulations in each disease state of each tissue based on the regulon specific score inferred using pySCENIC and by calculating the average expression. |
| Page: 1 |
Top |
Somatic mutation of malignant transformation related genes |
| Annotation of somatic variants for genes involved in malignant transformation |
| Hugo Symbol | Variant Class | Variant Classification | dbSNP RS | HGVSc | HGVSp | HGVSp Short | SWISSPROT | BIOTYPE | SIFT | PolyPhen | Tumor Sample Barcode | Tissue | Histology | Sex | Age | Stage | Therapy Types | Drugs | Outcome |
| LONRF1 | SNV | Missense_Mutation | c.865C>A | p.Leu289Ile | p.L289I | Q17RB8 | protein_coding | deleterious(0) | probably_damaging(1) | TCGA-A2-A25A-01 | Breast | breast invasive carcinoma | Female | <65 | I/II | Unspecific | Cytoxan | SD | |
| LONRF1 | SNV | Missense_Mutation | rs758592289 | c.901C>T | p.Leu301Phe | p.L301F | Q17RB8 | protein_coding | tolerated(0.18) | benign(0.066) | TCGA-A8-A09G-01 | Breast | breast invasive carcinoma | Female | >=65 | III/IV | Unknown | Unknown | SD |
| LONRF1 | SNV | Missense_Mutation | c.1358N>T | p.Thr453Ile | p.T453I | Q17RB8 | protein_coding | tolerated(0.12) | benign(0) | TCGA-B6-A0IJ-01 | Breast | breast invasive carcinoma | Female | <65 | I/II | Unknown | Unknown | SD | |
| LONRF1 | SNV | Missense_Mutation | c.1834N>A | p.Asp612Asn | p.D612N | Q17RB8 | protein_coding | deleterious(0.03) | possibly_damaging(0.627) | TCGA-BH-A0W7-01 | Breast | breast invasive carcinoma | Female | <65 | I/II | Chemotherapy | taxotere | CR | |
| LONRF1 | SNV | Missense_Mutation | novel | c.1564N>C | p.Glu522Gln | p.E522Q | Q17RB8 | protein_coding | tolerated(0.22) | possibly_damaging(0.463) | TCGA-C8-A1HM-01 | Breast | breast invasive carcinoma | Female | >=65 | I/II | Chemotherapy | doxorubicin | CR |
| LONRF1 | insertion | Frame_Shift_Ins | novel | c.2045_2046insAGTGGCTATAATTCTTAGG | p.Leu683ValfsTer9 | p.L683Vfs*9 | Q17RB8 | protein_coding | TCGA-B6-A0IK-01 | Breast | breast invasive carcinoma | Female | <65 | III/IV | Unknown | Unknown | PD | ||
| LONRF1 | deletion | Frame_Shift_Del | novel | c.1785delT | p.Arg596GlufsTer55 | p.R596Efs*55 | Q17RB8 | protein_coding | TCGA-EW-A2FV-01 | Breast | breast invasive carcinoma | Female | <65 | III/IV | Chemotherapy | docetaxel | SD | ||
| LONRF1 | SNV | Missense_Mutation | novel | c.1948N>A | p.Leu650Ile | p.L650I | Q17RB8 | protein_coding | tolerated(0.26) | probably_damaging(0.951) | TCGA-EA-A3HU-01 | Cervix | cervical & endocervical cancer | Female | <65 | I/II | Unknown | Unknown | SD |
| LONRF1 | SNV | Missense_Mutation | c.1449N>C | p.Met483Ile | p.M483I | Q17RB8 | protein_coding | deleterious(0.04) | benign(0.444) | TCGA-EK-A2IP-01 | Cervix | cervical & endocervical cancer | Female | <65 | I/II | Unknown | Unknown | SD | |
| LONRF1 | SNV | Missense_Mutation | c.1431N>A | p.Phe477Leu | p.F477L | Q17RB8 | protein_coding | tolerated(0.64) | benign(0.139) | TCGA-IR-A3LI-01 | Cervix | cervical & endocervical cancer | Female | <65 | I/II | Chemotherapy | cisplatin | CR |
| Page: 1 2 3 4 5 6 |
Top |
Related drugs of malignant transformation related genes |
| Identification of chemicals and drugs interact with genes involved in malignant transfromation |
| (DGIdb 4.0) |
| Entrez ID | Symbol | Category | Interaction Types | Drug Claim Name | Drug Name | PMIDs |
| Page: 1 |

Copyright 2023-Present -The University of Texas Health Science Center at Houston |