
|
|||||
|
 | |
| |
| |
| |
| |
| |
|
Gene: LIX1L |
Gene summary for LIX1L |
| Gene information | Species | Human | Gene symbol | LIX1L | Gene ID | 128077 |
| Gene name | limb and CNS expressed 1 like | |
| Gene Alias | LIX1L | |
| Cytomap | 1q21.1 | |
| Gene Type | protein-coding | GO ID | GO:0006914 | UniProtAcc | B3KY58 |
Top |
Malignant transformation analysis |
| Identification of the aberrant gene expression in precancerous and cancerous lesions by comparing the gene expression of stem-like cells in diseased tissues with normal stem cells |
| Entrez ID | Symbol | Replicates | Species | Organ | Tissue | Adj P-value | Log2FC | Malignancy |
| 128077 | LIX1L | P27T-E | Human | Esophagus | ESCC | 5.73e-10 | 1.26e-01 | 0.1055 |
| 128077 | LIX1L | P30T-E | Human | Esophagus | ESCC | 1.05e-16 | 4.63e-01 | 0.137 |
| 128077 | LIX1L | P32T-E | Human | Esophagus | ESCC | 4.56e-31 | 5.89e-01 | 0.1666 |
| 128077 | LIX1L | P36T-E | Human | Esophagus | ESCC | 4.13e-13 | 3.58e-01 | 0.1187 |
| 128077 | LIX1L | P37T-E | Human | Esophagus | ESCC | 1.18e-25 | 5.02e-01 | 0.1371 |
| 128077 | LIX1L | P39T-E | Human | Esophagus | ESCC | 2.39e-06 | 4.37e-02 | 0.0894 |
| 128077 | LIX1L | P40T-E | Human | Esophagus | ESCC | 2.60e-08 | 2.30e-01 | 0.109 |
| 128077 | LIX1L | P42T-E | Human | Esophagus | ESCC | 1.11e-12 | 3.11e-01 | 0.1175 |
| 128077 | LIX1L | P44T-E | Human | Esophagus | ESCC | 1.07e-04 | 1.76e-01 | 0.1096 |
| 128077 | LIX1L | P47T-E | Human | Esophagus | ESCC | 1.00e-02 | 5.80e-02 | 0.1067 |
| 128077 | LIX1L | P48T-E | Human | Esophagus | ESCC | 2.94e-08 | 5.61e-02 | 0.0959 |
| 128077 | LIX1L | P49T-E | Human | Esophagus | ESCC | 1.19e-11 | 9.49e-01 | 0.1768 |
| 128077 | LIX1L | P52T-E | Human | Esophagus | ESCC | 1.83e-11 | 2.13e-01 | 0.1555 |
| 128077 | LIX1L | P56T-E | Human | Esophagus | ESCC | 4.58e-02 | 4.23e-01 | 0.1613 |
| 128077 | LIX1L | P57T-E | Human | Esophagus | ESCC | 3.16e-11 | 2.96e-01 | 0.0926 |
| 128077 | LIX1L | P62T-E | Human | Esophagus | ESCC | 2.79e-16 | 3.20e-01 | 0.1302 |
| 128077 | LIX1L | P65T-E | Human | Esophagus | ESCC | 2.91e-02 | 6.87e-02 | 0.0978 |
| 128077 | LIX1L | P74T-E | Human | Esophagus | ESCC | 2.29e-02 | 9.78e-02 | 0.1479 |
| 128077 | LIX1L | P76T-E | Human | Esophagus | ESCC | 1.96e-13 | 1.43e-01 | 0.1207 |
| 128077 | LIX1L | P80T-E | Human | Esophagus | ESCC | 7.68e-05 | 1.66e-01 | 0.155 |
| Page: 1 2 3 4 |
| Tissue | Expression Dynamics | Abbreviation |
| Esophagus | 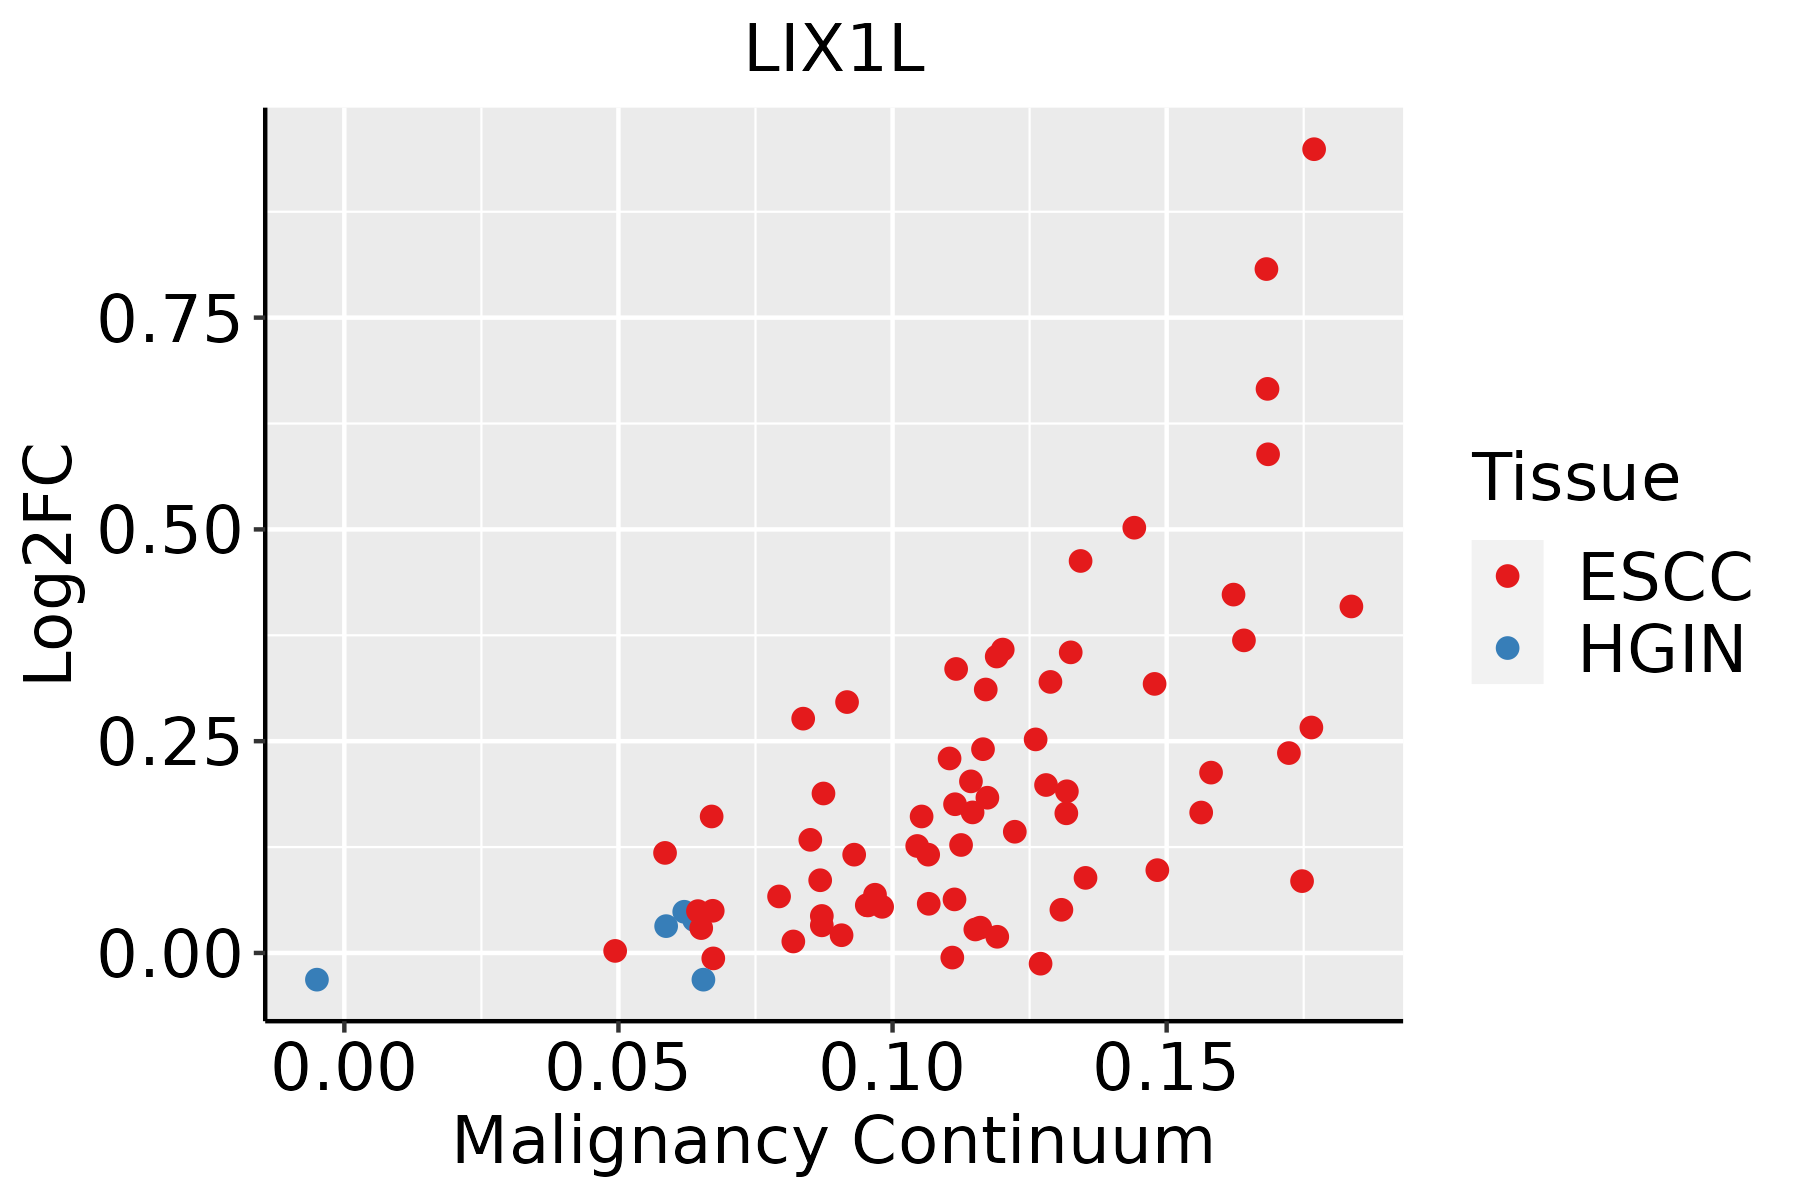 | ESCC: Esophageal squamous cell carcinoma |
| HGIN: High-grade intraepithelial neoplasias | ||
| LGIN: Low-grade intraepithelial neoplasias | ||
| Liver | 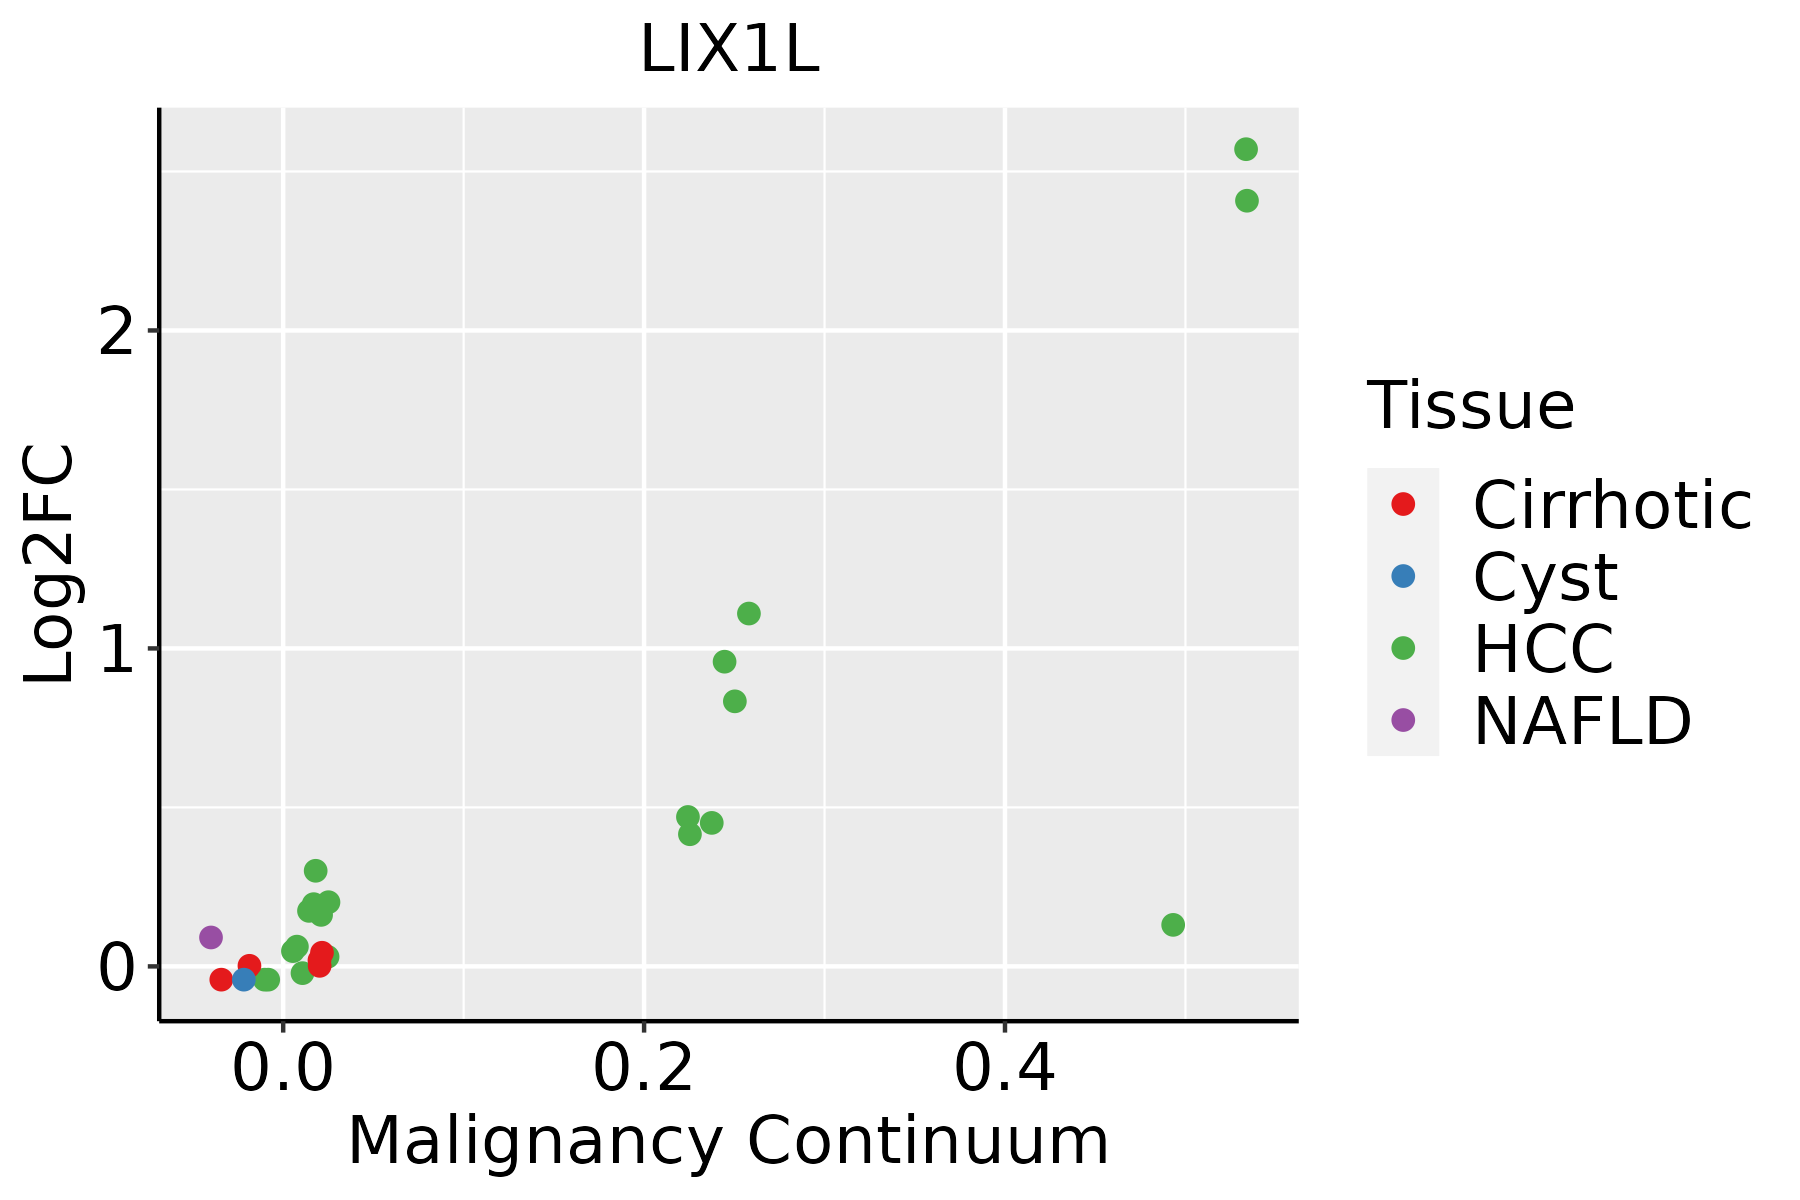 | HCC: Hepatocellular carcinoma |
| NAFLD: Non-alcoholic fatty liver disease | ||
| Oral Cavity |  | EOLP: Erosive Oral lichen planus |
| LP: leukoplakia | ||
| NEOLP: Non-erosive oral lichen planus | ||
| OSCC: Oral squamous cell carcinoma |
| ∗log2FC in expression of this searched gene in stem-like cells from each diseased tissue sample relative to stem-like cells in normal samples in each tissue plotted against the malignancy continuum. Samples are colored based on if they are from different disease stage. |
Top |
Malignant transformation related pathway analysis |
| Find out the enriched GO biological processes and KEGG pathways involved in transition from healthy to precancer to cancer |
| Tissue | Disease Stage | Enriched GO biological Processes |
| Colorectum | AD |  |
| Colorectum | SER |  |
| Colorectum | MSS |  |
| Colorectum | MSI-H |  |
| Colorectum | FAP |  |
| ∗Top 15 enriched GO BP terms are showed in the bar plot of each disease state in each tissue. Each row represents a significant GO biological process which is colored according to the -log10(p.adjust). |
| Page: 1 2 3 4 5 6 7 8 9 |
| GO ID | Tissue | Disease Stage | Description | Gene Ratio | Bg Ratio | pvalue | p.adjust | Count |
| GO:001623617 | Esophagus | ESCC | macroautophagy | 216/8552 | 291/18723 | 1.94e-23 | 4.57e-21 | 216 |
| GO:0022411111 | Esophagus | ESCC | cellular component disassembly | 305/8552 | 443/18723 | 1.94e-23 | 4.57e-21 | 305 |
| GO:003298416 | Esophagus | ESCC | protein-containing complex disassembly | 151/8552 | 224/18723 | 3.45e-11 | 1.15e-09 | 151 |
| GO:00973523 | Esophagus | ESCC | autophagosome maturation | 31/8552 | 40/18723 | 4.04e-05 | 3.26e-04 | 31 |
| GO:001623621 | Liver | HCC | macroautophagy | 204/7958 | 291/18723 | 8.66e-22 | 1.41e-19 | 204 |
| GO:002241112 | Liver | HCC | cellular component disassembly | 282/7958 | 443/18723 | 1.02e-19 | 1.38e-17 | 282 |
| GO:003298411 | Liver | HCC | protein-containing complex disassembly | 138/7958 | 224/18723 | 5.59e-09 | 1.46e-07 | 138 |
| GO:00973521 | Liver | HCC | autophagosome maturation | 30/7958 | 40/18723 | 3.04e-05 | 3.12e-04 | 30 |
| GO:002241119 | Oral cavity | OSCC | cellular component disassembly | 283/7305 | 443/18723 | 9.57e-27 | 3.37e-24 | 283 |
| GO:001623610 | Oral cavity | OSCC | macroautophagy | 192/7305 | 291/18723 | 7.01e-21 | 1.14e-18 | 192 |
| GO:003298410 | Oral cavity | OSCC | protein-containing complex disassembly | 136/7305 | 224/18723 | 3.42e-11 | 1.13e-09 | 136 |
| GO:00973522 | Oral cavity | OSCC | autophagosome maturation | 28/7305 | 40/18723 | 7.00e-05 | 5.60e-04 | 28 |
| Page: 1 |
| Pathway ID | Tissue | Disease Stage | Description | Gene Ratio | Bg Ratio | pvalue | p.adjust | qvalue | Count |
| Page: 1 |
Top |
Cell-cell communication analysis |
| Identification of potential cell-cell interactions between two cell types and their ligand-receptor pairs for different disease states |
| Ligand | Receptor | LRpair | Pathway | Tissue | Disease Stage |
| Page: 1 |
Top |
Single-cell gene regulatory network inference analysis |
| Find out the significant the regulons (TFs) and the target genes of each regulon across cell types for different disease states |
| TF | Cell Type | Tissue | Disease Stage | Target Gene | RSS | Regulon Activity |
| ∗The dot plots of a searched regulon are shown for all cell subpopulations in each disease state of each tissue based on the regulon specific score inferred using pySCENIC and by calculating the average expression. |
| Page: 1 |
Top |
Somatic mutation of malignant transformation related genes |
| Annotation of somatic variants for genes involved in malignant transformation |
| Hugo Symbol | Variant Class | Variant Classification | dbSNP RS | HGVSc | HGVSp | HGVSp Short | SWISSPROT | BIOTYPE | SIFT | PolyPhen | Tumor Sample Barcode | Tissue | Histology | Sex | Age | Stage | Therapy Types | Drugs | Outcome |
| LIX1L | SNV | Missense_Mutation | c.937N>T | p.Arg313Cys | p.R313C | Q8IVB5 | protein_coding | deleterious(0) | probably_damaging(0.999) | TCGA-D8-A1JA-01 | Breast | breast invasive carcinoma | Female | <65 | III/IV | Chemotherapy | adriamycin | PD | |
| LIX1L | SNV | Missense_Mutation | novel | c.451T>G | p.Phe151Val | p.F151V | Q8IVB5 | protein_coding | deleterious(0) | possibly_damaging(0.859) | TCGA-2W-A8YY-01 | Cervix | cervical & endocervical cancer | Female | <65 | I/II | Chemotherapy | cisplatin | CR |
| LIX1L | SNV | Missense_Mutation | novel | c.712N>A | p.Gln238Lys | p.Q238K | Q8IVB5 | protein_coding | deleterious(0.02) | probably_damaging(0.994) | TCGA-MA-AA41-01 | Cervix | cervical & endocervical cancer | Female | <65 | I/II | Unknown | Unknown | SD |
| LIX1L | SNV | Missense_Mutation | c.791C>T | p.Ser264Leu | p.S264L | Q8IVB5 | protein_coding | deleterious(0.01) | probably_damaging(0.983) | TCGA-VS-A9UV-01 | Cervix | cervical & endocervical cancer | Female | >=65 | I/II | Unknown | Unknown | PD | |
| LIX1L | SNV | Missense_Mutation | c.410T>C | p.Val137Ala | p.V137A | Q8IVB5 | protein_coding | deleterious(0) | possibly_damaging(0.796) | TCGA-AA-3510-01 | Colorectum | colon adenocarcinoma | Male | >=65 | I/II | Unknown | Unknown | SD | |
| LIX1L | SNV | Missense_Mutation | c.829G>T | p.Ala277Ser | p.A277S | Q8IVB5 | protein_coding | tolerated(0.07) | benign(0.364) | TCGA-AA-A02E-01 | Colorectum | colon adenocarcinoma | Female | >=65 | III/IV | Unknown | Unknown | PD | |
| LIX1L | SNV | Missense_Mutation | c.357G>T | p.Lys119Asn | p.K119N | Q8IVB5 | protein_coding | tolerated(0.06) | possibly_damaging(0.497) | TCGA-AG-3892-01 | Colorectum | rectum adenocarcinoma | Female | <65 | I/II | Unknown | Unknown | SD | |
| LIX1L | SNV | Missense_Mutation | novel | c.498G>T | p.Lys166Asn | p.K166N | Q8IVB5 | protein_coding | deleterious(0) | probably_damaging(0.999) | TCGA-AG-A002-01 | Colorectum | rectum adenocarcinoma | Male | <65 | I/II | Unknown | Unknown | SD |
| LIX1L | insertion | Frame_Shift_Ins | novel | c.467_468insTTACATT | p.Lys157TyrfsTer5 | p.K157Yfs*5 | Q8IVB5 | protein_coding | TCGA-AM-5820-01 | Colorectum | colon adenocarcinoma | Female | <65 | I/II | Unknown | Unknown | SD | ||
| LIX1L | SNV | Missense_Mutation | novel | c.907N>A | p.Asp303Asn | p.D303N | Q8IVB5 | protein_coding | deleterious(0.02) | possibly_damaging(0.52) | TCGA-A5-A0G1-01 | Endometrium | uterine corpus endometrioid carcinoma | Female | >=65 | I/II | Unknown | Unknown | SD |
| Page: 1 2 3 |
Top |
Related drugs of malignant transformation related genes |
| Identification of chemicals and drugs interact with genes involved in malignant transfromation |
| (DGIdb 4.0) |
| Entrez ID | Symbol | Category | Interaction Types | Drug Claim Name | Drug Name | PMIDs |
| Page: 1 |

Copyright 2023-Present -The University of Texas Health Science Center at Houston |