
|
|||||
|
 | |
| |
| |
| |
| |
| |
|
Gene: LHPP |
Gene summary for LHPP |
| Gene information | Species | Human | Gene symbol | LHPP | Gene ID | 64077 |
| Gene name | phospholysine phosphohistidine inorganic pyrophosphate phosphatase | |
| Gene Alias | HDHD2B | |
| Cytomap | 10q26.13 | |
| Gene Type | protein-coding | GO ID | GO:0006793 | UniProtAcc | Q9H008 |
Top |
Malignant transformation analysis |
| Identification of the aberrant gene expression in precancerous and cancerous lesions by comparing the gene expression of stem-like cells in diseased tissues with normal stem cells |
| Entrez ID | Symbol | Replicates | Species | Organ | Tissue | Adj P-value | Log2FC | Malignancy |
| 64077 | LHPP | P21T-E | Human | Esophagus | ESCC | 2.58e-24 | 3.54e-01 | 0.1617 |
| 64077 | LHPP | P22T-E | Human | Esophagus | ESCC | 2.79e-19 | 3.55e-01 | 0.1236 |
| 64077 | LHPP | P23T-E | Human | Esophagus | ESCC | 4.56e-25 | 6.80e-01 | 0.108 |
| 64077 | LHPP | P24T-E | Human | Esophagus | ESCC | 3.47e-16 | 3.64e-01 | 0.1287 |
| 64077 | LHPP | P26T-E | Human | Esophagus | ESCC | 2.83e-34 | 5.78e-01 | 0.1276 |
| 64077 | LHPP | P27T-E | Human | Esophagus | ESCC | 3.33e-53 | 9.38e-01 | 0.1055 |
| 64077 | LHPP | P28T-E | Human | Esophagus | ESCC | 6.69e-15 | 2.58e-01 | 0.1149 |
| 64077 | LHPP | P30T-E | Human | Esophagus | ESCC | 1.70e-22 | 7.00e-01 | 0.137 |
| 64077 | LHPP | P31T-E | Human | Esophagus | ESCC | 2.14e-45 | 7.55e-01 | 0.1251 |
| 64077 | LHPP | P32T-E | Human | Esophagus | ESCC | 5.45e-13 | 1.89e-01 | 0.1666 |
| 64077 | LHPP | P36T-E | Human | Esophagus | ESCC | 1.04e-07 | 1.91e-01 | 0.1187 |
| 64077 | LHPP | P37T-E | Human | Esophagus | ESCC | 1.98e-22 | 5.37e-01 | 0.1371 |
| 64077 | LHPP | P38T-E | Human | Esophagus | ESCC | 1.00e-02 | 1.51e-01 | 0.127 |
| 64077 | LHPP | P39T-E | Human | Esophagus | ESCC | 2.25e-10 | 2.23e-01 | 0.0894 |
| 64077 | LHPP | P40T-E | Human | Esophagus | ESCC | 2.43e-08 | 2.97e-01 | 0.109 |
| 64077 | LHPP | P42T-E | Human | Esophagus | ESCC | 2.91e-12 | 4.01e-01 | 0.1175 |
| 64077 | LHPP | P44T-E | Human | Esophagus | ESCC | 4.71e-08 | 2.37e-01 | 0.1096 |
| 64077 | LHPP | P47T-E | Human | Esophagus | ESCC | 5.05e-13 | 2.03e-01 | 0.1067 |
| 64077 | LHPP | P48T-E | Human | Esophagus | ESCC | 1.27e-12 | 2.56e-01 | 0.0959 |
| 64077 | LHPP | P49T-E | Human | Esophagus | ESCC | 5.22e-06 | 7.30e-01 | 0.1768 |
| Page: 1 2 3 4 5 |
| Tissue | Expression Dynamics | Abbreviation |
| Esophagus | 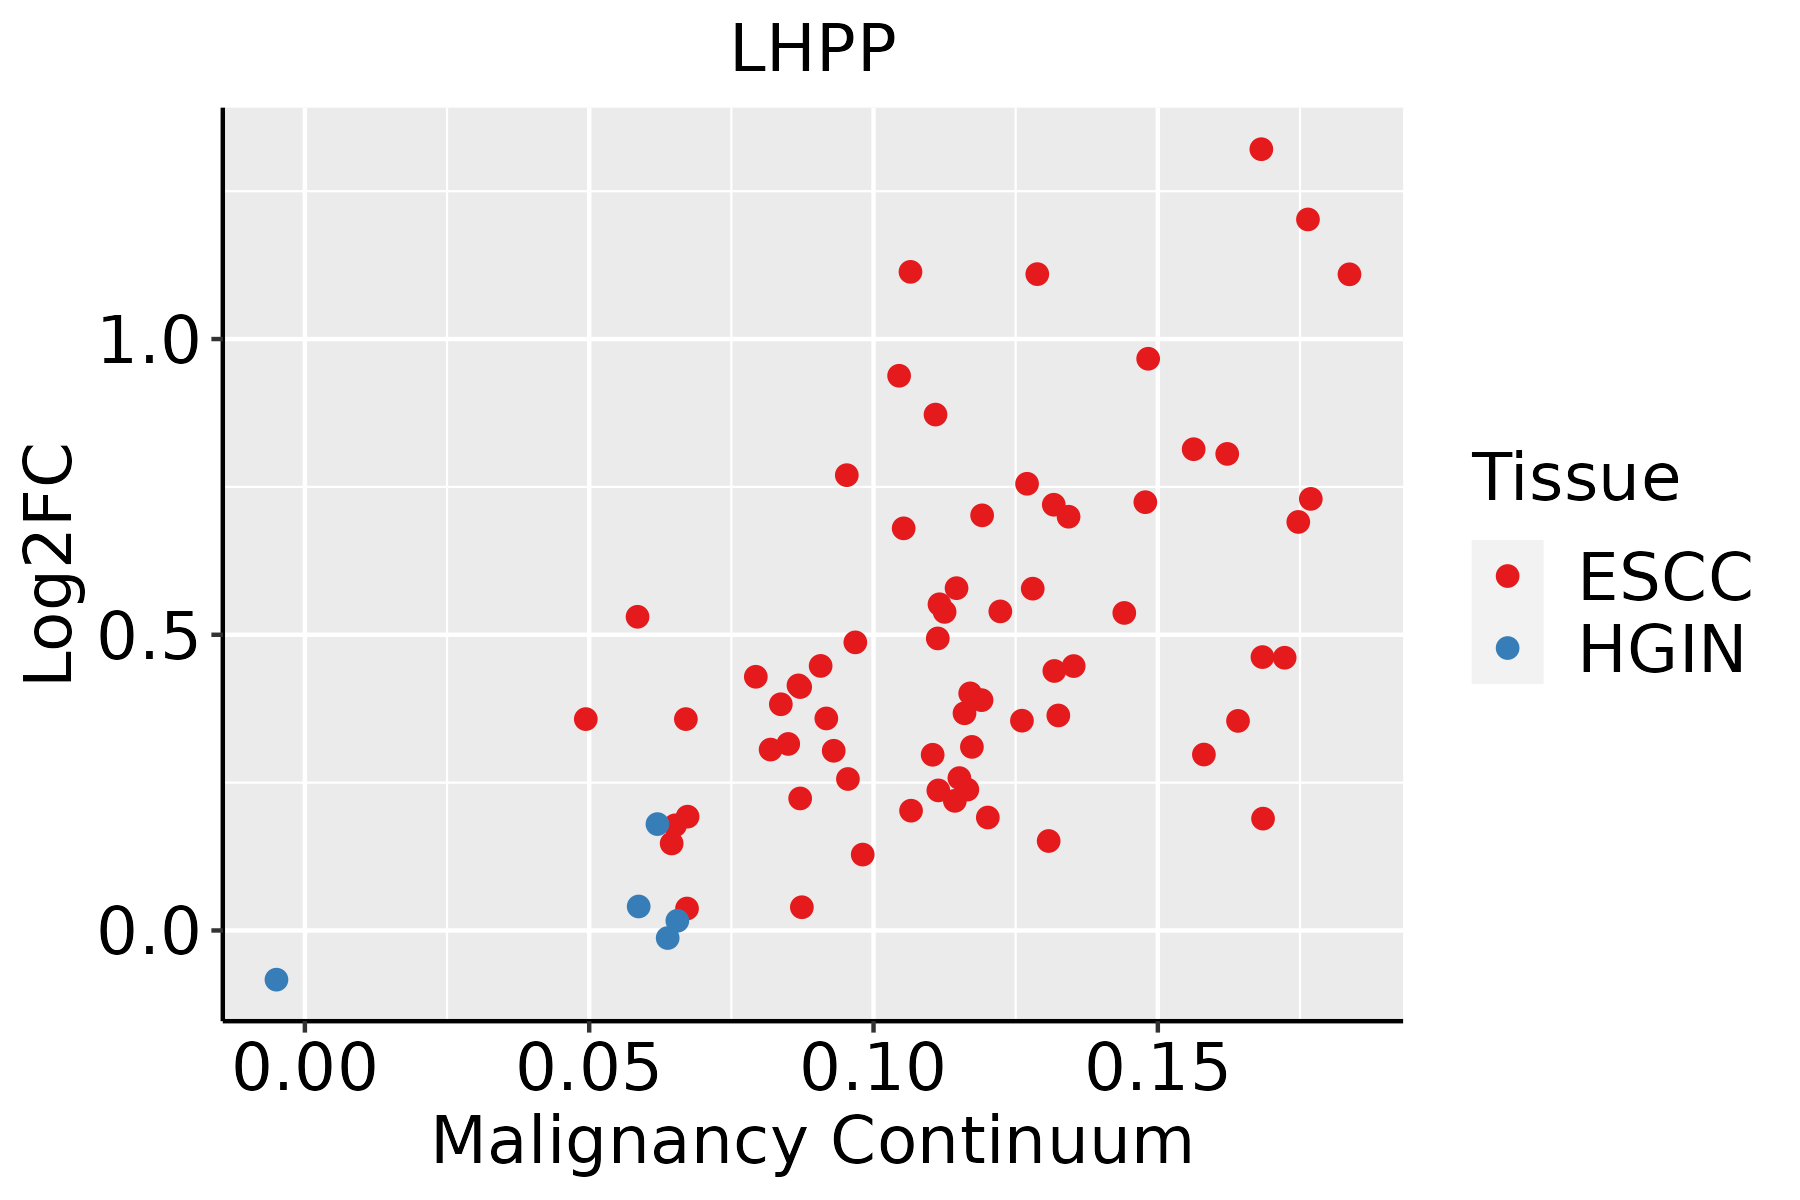 | ESCC: Esophageal squamous cell carcinoma |
| HGIN: High-grade intraepithelial neoplasias | ||
| LGIN: Low-grade intraepithelial neoplasias | ||
| Liver |  | HCC: Hepatocellular carcinoma |
| NAFLD: Non-alcoholic fatty liver disease | ||
| Oral Cavity | 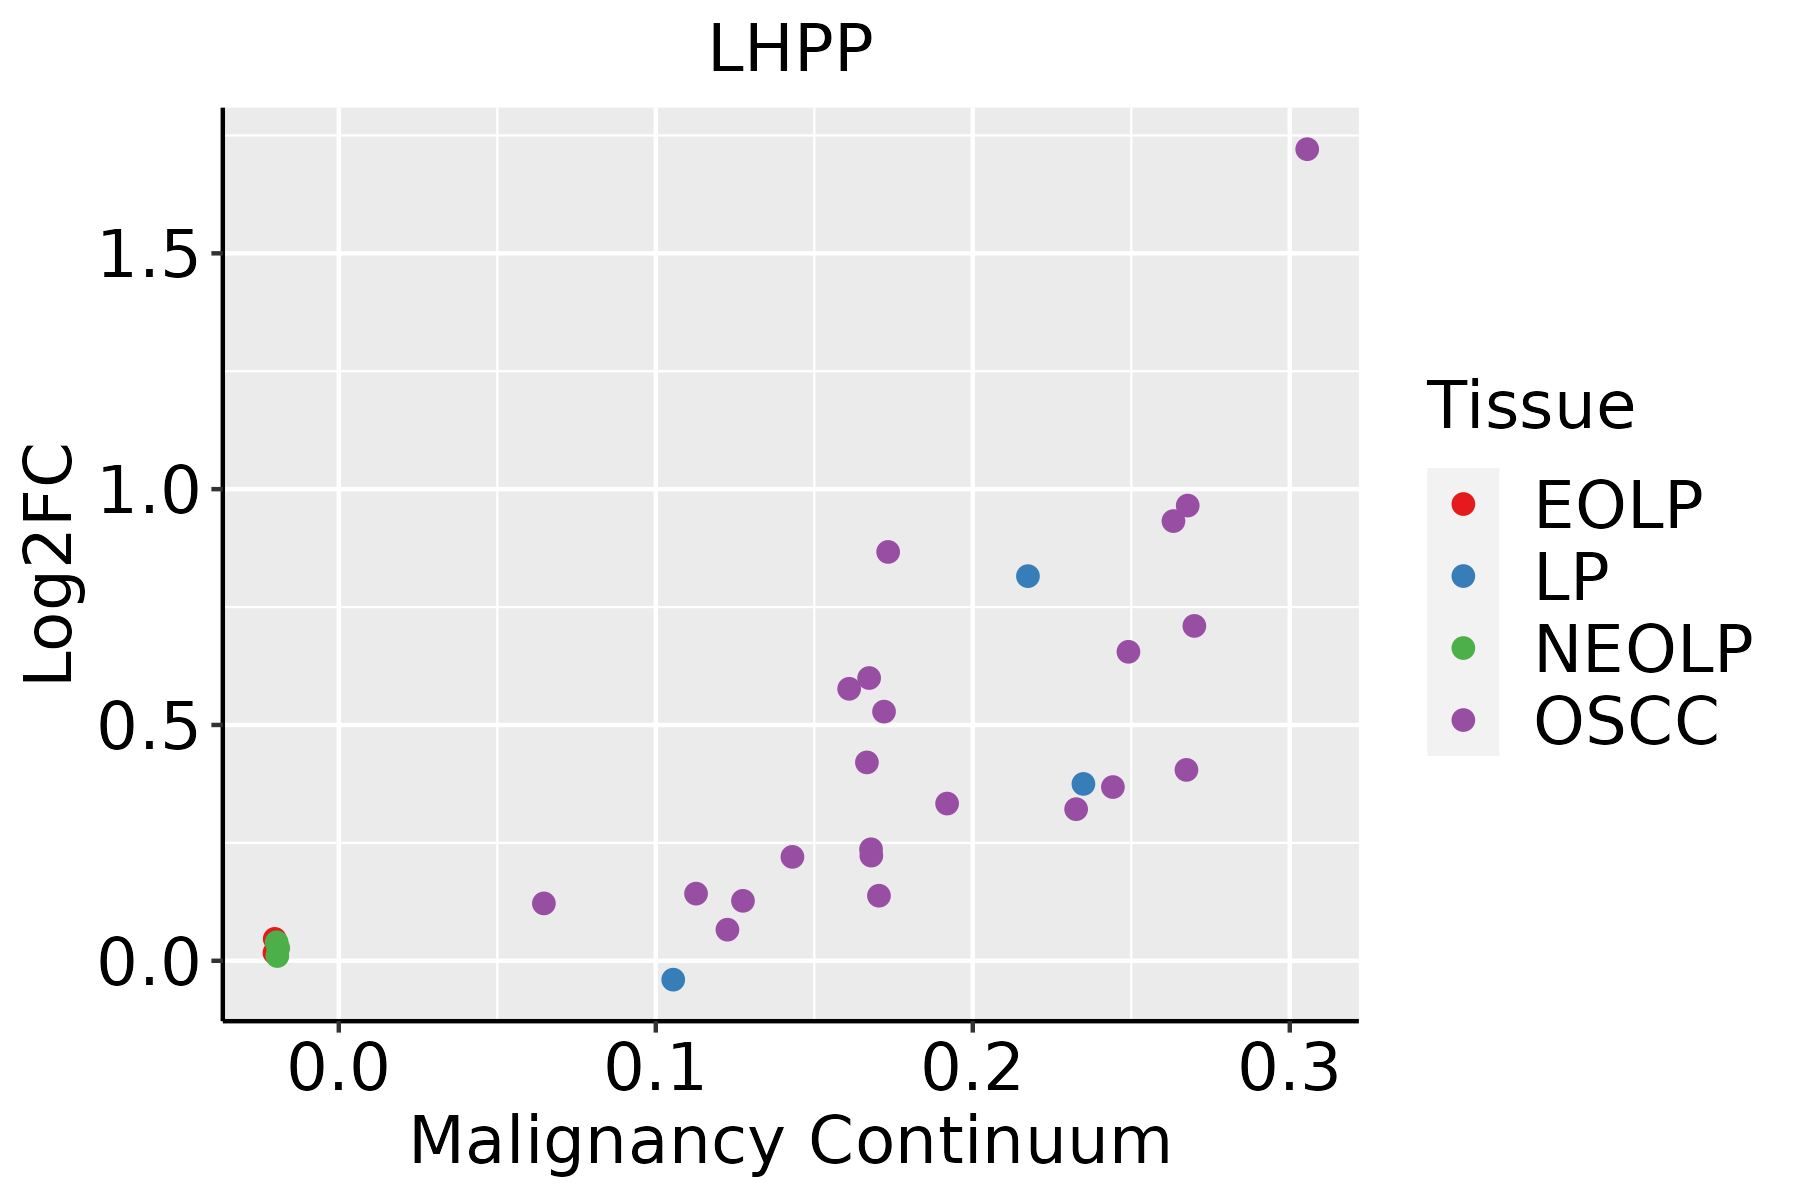 | EOLP: Erosive Oral lichen planus |
| LP: leukoplakia | ||
| NEOLP: Non-erosive oral lichen planus | ||
| OSCC: Oral squamous cell carcinoma |
| ∗log2FC in expression of this searched gene in stem-like cells from each diseased tissue sample relative to stem-like cells in normal samples in each tissue plotted against the malignancy continuum. Samples are colored based on if they are from different disease stage. |
Top |
Malignant transformation related pathway analysis |
| Find out the enriched GO biological processes and KEGG pathways involved in transition from healthy to precancer to cancer |
| Tissue | Disease Stage | Enriched GO biological Processes |
| Colorectum | AD |  |
| Colorectum | SER |  |
| Colorectum | MSS |  |
| Colorectum | MSI-H |  |
| Colorectum | FAP |  |
| ∗Top 15 enriched GO BP terms are showed in the bar plot of each disease state in each tissue. Each row represents a significant GO biological process which is colored according to the -log10(p.adjust). |
| Page: 1 2 3 4 5 6 7 8 9 |
| GO ID | Tissue | Disease Stage | Description | Gene Ratio | Bg Ratio | pvalue | p.adjust | Count |
| GO:001631110 | Esophagus | ESCC | dephosphorylation | 251/8552 | 417/18723 | 1.26e-09 | 2.99e-08 | 251 |
| GO:001631121 | Liver | HCC | dephosphorylation | 230/7958 | 417/18723 | 1.00e-07 | 1.96e-06 | 230 |
| GO:00163119 | Oral cavity | OSCC | dephosphorylation | 220/7305 | 417/18723 | 6.33e-09 | 1.34e-07 | 220 |
| Page: 1 |
| Pathway ID | Tissue | Disease Stage | Description | Gene Ratio | Bg Ratio | pvalue | p.adjust | qvalue | Count |
| hsa00190210 | Esophagus | ESCC | Oxidative phosphorylation | 104/4205 | 134/8465 | 2.04e-11 | 2.98e-10 | 1.53e-10 | 104 |
| hsa0019038 | Esophagus | ESCC | Oxidative phosphorylation | 104/4205 | 134/8465 | 2.04e-11 | 2.98e-10 | 1.53e-10 | 104 |
| hsa0019022 | Liver | HCC | Oxidative phosphorylation | 103/4020 | 134/8465 | 2.39e-12 | 5.01e-11 | 2.79e-11 | 103 |
| hsa0019032 | Liver | HCC | Oxidative phosphorylation | 103/4020 | 134/8465 | 2.39e-12 | 5.01e-11 | 2.79e-11 | 103 |
| hsa0019028 | Oral cavity | OSCC | Oxidative phosphorylation | 88/3704 | 134/8465 | 2.15e-07 | 1.44e-06 | 7.32e-07 | 88 |
| hsa00190112 | Oral cavity | OSCC | Oxidative phosphorylation | 88/3704 | 134/8465 | 2.15e-07 | 1.44e-06 | 7.32e-07 | 88 |
| hsa0019029 | Oral cavity | LP | Oxidative phosphorylation | 81/2418 | 134/8465 | 9.58e-15 | 2.45e-13 | 1.58e-13 | 81 |
| hsa0019037 | Oral cavity | LP | Oxidative phosphorylation | 81/2418 | 134/8465 | 9.58e-15 | 2.45e-13 | 1.58e-13 | 81 |
| Page: 1 |
Top |
Cell-cell communication analysis |
| Identification of potential cell-cell interactions between two cell types and their ligand-receptor pairs for different disease states |
| Ligand | Receptor | LRpair | Pathway | Tissue | Disease Stage |
| Page: 1 |
Top |
Single-cell gene regulatory network inference analysis |
| Find out the significant the regulons (TFs) and the target genes of each regulon across cell types for different disease states |
| TF | Cell Type | Tissue | Disease Stage | Target Gene | RSS | Regulon Activity |
| ∗The dot plots of a searched regulon are shown for all cell subpopulations in each disease state of each tissue based on the regulon specific score inferred using pySCENIC and by calculating the average expression. |
| Page: 1 |
Top |
Somatic mutation of malignant transformation related genes |
| Annotation of somatic variants for genes involved in malignant transformation |
| Hugo Symbol | Variant Class | Variant Classification | dbSNP RS | HGVSc | HGVSp | HGVSp Short | SWISSPROT | BIOTYPE | SIFT | PolyPhen | Tumor Sample Barcode | Tissue | Histology | Sex | Age | Stage | Therapy Types | Drugs | Outcome |
| LHPP | SNV | Missense_Mutation | rs573880113 | c.602C>T | p.Ala201Val | p.A201V | Q9H008 | protein_coding | tolerated(0.07) | benign(0.003) | TCGA-2W-A8YY-01 | Cervix | cervical & endocervical cancer | Female | <65 | I/II | Chemotherapy | cisplatin | CR |
| LHPP | SNV | Missense_Mutation | rs201380619 | c.689C>T | p.Ala230Val | p.A230V | Q9H008 | protein_coding | deleterious(0.01) | possibly_damaging(0.809) | TCGA-AA-3947-01 | Colorectum | colon adenocarcinoma | Female | <65 | I/II | Unknown | Unknown | SD |
| LHPP | SNV | Missense_Mutation | rs538187592 | c.661N>A | p.Gly221Ser | p.G221S | Q9H008 | protein_coding | deleterious(0.02) | probably_damaging(0.966) | TCGA-AA-3950-01 | Colorectum | colon adenocarcinoma | Female | >=65 | I/II | Unknown | Unknown | SD |
| LHPP | SNV | Missense_Mutation | rs370925915 | c.181N>T | p.Arg61Trp | p.R61W | Q9H008 | protein_coding | deleterious(0) | possibly_damaging(0.848) | TCGA-AA-A01P-01 | Colorectum | colon adenocarcinoma | Female | >=65 | III/IV | Unknown | Unknown | PD |
| LHPP | SNV | Missense_Mutation | c.582N>G | p.Phe194Leu | p.F194L | Q9H008 | protein_coding | deleterious(0.04) | possibly_damaging(0.773) | TCGA-CA-6718-01 | Colorectum | colon adenocarcinoma | Male | <65 | I/II | Unknown | Unknown | PD | |
| LHPP | SNV | Missense_Mutation | rs142666958 | c.553G>A | p.Glu185Lys | p.E185K | Q9H008 | protein_coding | tolerated(0.15) | benign(0.019) | TCGA-CK-5916-01 | Colorectum | colon adenocarcinoma | Female | >=65 | I/II | Unknown | Unknown | PD |
| LHPP | SNV | Missense_Mutation | rs202090877 | c.134G>A | p.Arg45His | p.R45H | Q9H008 | protein_coding | tolerated(0.08) | benign(0.009) | TCGA-CM-6164-01 | Colorectum | colon adenocarcinoma | Female | <65 | I/II | Unknown | Unknown | SD |
| LHPP | SNV | Missense_Mutation | rs771378730 | c.674G>A | p.Arg225Gln | p.R225Q | Q9H008 | protein_coding | tolerated(0.41) | benign(0.003) | TCGA-F4-6570-01 | Colorectum | colon adenocarcinoma | Female | >=65 | I/II | Unknown | Unknown | SD |
| LHPP | SNV | Missense_Mutation | c.806N>G | p.Asp269Gly | p.D269G | Q9H008 | protein_coding | tolerated_low_confidence(0.06) | benign(0.045) | TCGA-G4-6628-01 | Colorectum | colon adenocarcinoma | Male | >=65 | I/II | Unknown | Unknown | SD | |
| LHPP | SNV | Missense_Mutation | rs774113542 | c.319N>T | p.Arg107Cys | p.R107C | Q9H008 | protein_coding | tolerated(0.18) | possibly_damaging(0.835) | TCGA-AG-3898-01 | Colorectum | rectum adenocarcinoma | Male | <65 | I/II | Unknown | Unknown | SD |
| Page: 1 2 3 |
Top |
Related drugs of malignant transformation related genes |
| Identification of chemicals and drugs interact with genes involved in malignant transfromation |
| (DGIdb 4.0) |
| Entrez ID | Symbol | Category | Interaction Types | Drug Claim Name | Drug Name | PMIDs |
| Page: 1 |

Copyright 2023-Present -The University of Texas Health Science Center at Houston |