
|
|||||
|
 | |
| |
| |
| |
| |
| |
|
Gene: LCP1 |
Gene summary for LCP1 |
| Gene information | Species | Human | Gene symbol | LCP1 | Gene ID | 3936 |
| Gene name | lymphocyte cytosolic protein 1 | |
| Gene Alias | CP64 | |
| Cytomap | 13q14.13 | |
| Gene Type | protein-coding | GO ID | GO:0001775 | UniProtAcc | A0A024RDT4 |
Top |
Malignant transformation analysis |
| Identification of the aberrant gene expression in precancerous and cancerous lesions by comparing the gene expression of stem-like cells in diseased tissues with normal stem cells |
| Entrez ID | Symbol | Replicates | Species | Organ | Tissue | Adj P-value | Log2FC | Malignancy |
| 3936 | LCP1 | P37T-E | Human | Esophagus | ESCC | 8.07e-03 | 2.58e-01 | 0.1371 |
| 3936 | LCP1 | P47T-E | Human | Esophagus | ESCC | 1.04e-18 | 4.98e-01 | 0.1067 |
| 3936 | LCP1 | P56T-E | Human | Esophagus | ESCC | 5.24e-05 | 9.90e-01 | 0.1613 |
| 3936 | LCP1 | P76T-E | Human | Esophagus | ESCC | 2.40e-29 | 6.64e-01 | 0.1207 |
| 3936 | LCP1 | P79T-E | Human | Esophagus | ESCC | 4.88e-06 | 2.45e-01 | 0.1154 |
| 3936 | LCP1 | P89T-E | Human | Esophagus | ESCC | 1.95e-10 | 1.17e+00 | 0.1752 |
| 3936 | LCP1 | P130T-E | Human | Esophagus | ESCC | 1.85e-16 | 7.24e-01 | 0.1676 |
| 3936 | LCP1 | HCC1_Meng | Human | Liver | HCC | 5.88e-27 | -3.71e-02 | 0.0246 |
| 3936 | LCP1 | cirrhotic2 | Human | Liver | Cirrhotic | 2.63e-06 | -2.12e-02 | 0.0201 |
| 3936 | LCP1 | HCC2 | Human | Liver | HCC | 1.18e-45 | 4.65e+00 | 0.5341 |
| 3936 | LCP1 | HCC5 | Human | Liver | HCC | 2.30e-27 | 2.19e+00 | 0.4932 |
| 3936 | LCP1 | Pt13.a | Human | Liver | HCC | 1.43e-05 | 2.60e-01 | 0.021 |
| 3936 | LCP1 | Pt14.d | Human | Liver | HCC | 1.09e-05 | 1.78e-01 | 0.0143 |
| 3936 | LCP1 | C21 | Human | Oral cavity | OSCC | 1.11e-23 | 6.50e-01 | 0.2678 |
| 3936 | LCP1 | C38 | Human | Oral cavity | OSCC | 9.09e-14 | 9.24e-01 | 0.172 |
| 3936 | LCP1 | C51 | Human | Oral cavity | OSCC | 1.32e-05 | 2.87e-01 | 0.2674 |
| 3936 | LCP1 | C06 | Human | Oral cavity | OSCC | 3.39e-03 | 3.97e-01 | 0.2699 |
| 3936 | LCP1 | C86 | Human | Oral cavity | OSCC | 9.60e-07 | 5.66e-01 | 0.161 |
| 3936 | LCP1 | C09 | Human | Oral cavity | OSCC | 1.50e-04 | 1.18e-01 | 0.1431 |
| 3936 | LCP1 | LN38 | Human | Oral cavity | OSCC | 7.17e-03 | 5.02e-01 | 0.168 |
| Page: 1 2 3 |
| Tissue | Expression Dynamics | Abbreviation |
| Cervix | 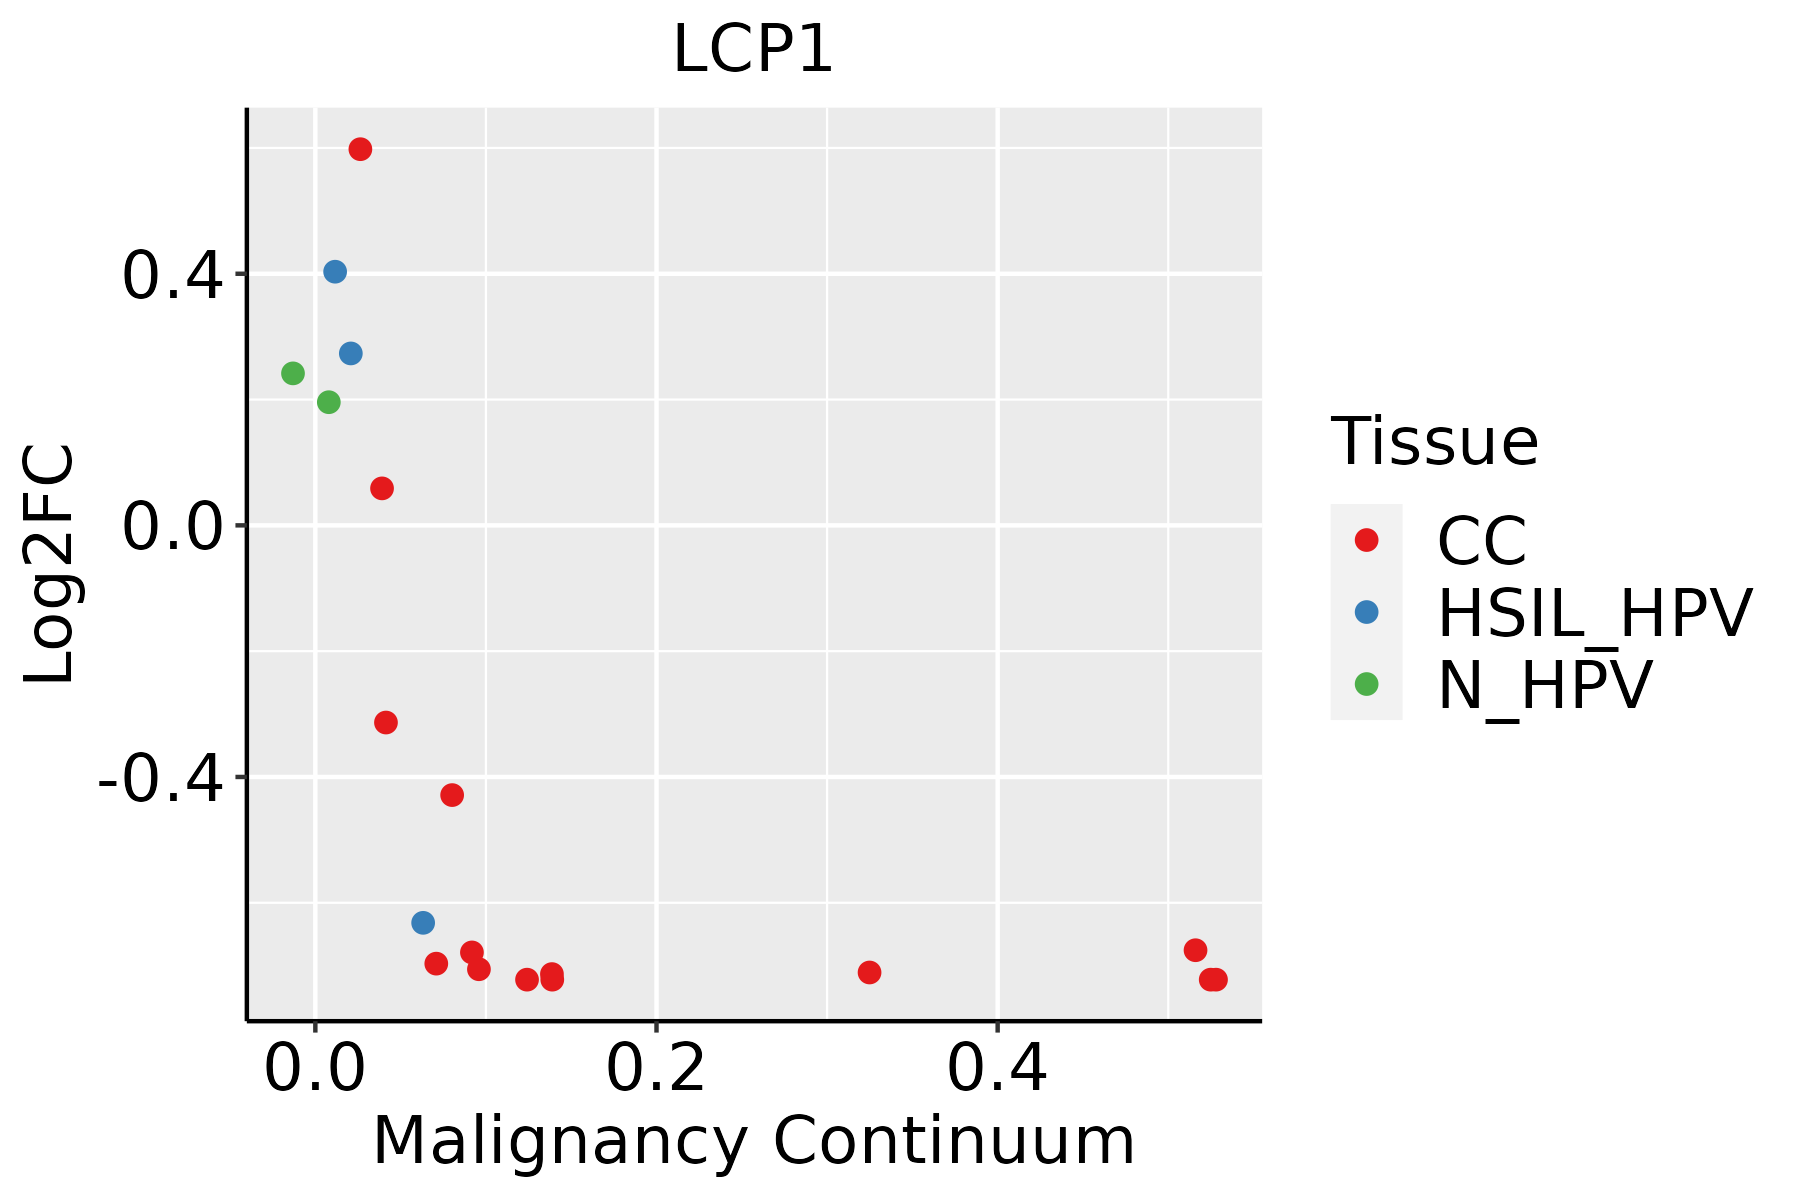 | CC: Cervix cancer |
| HSIL_HPV: HPV-infected high-grade squamous intraepithelial lesions | ||
| N_HPV: HPV-infected normal cervix | ||
| Esophagus | 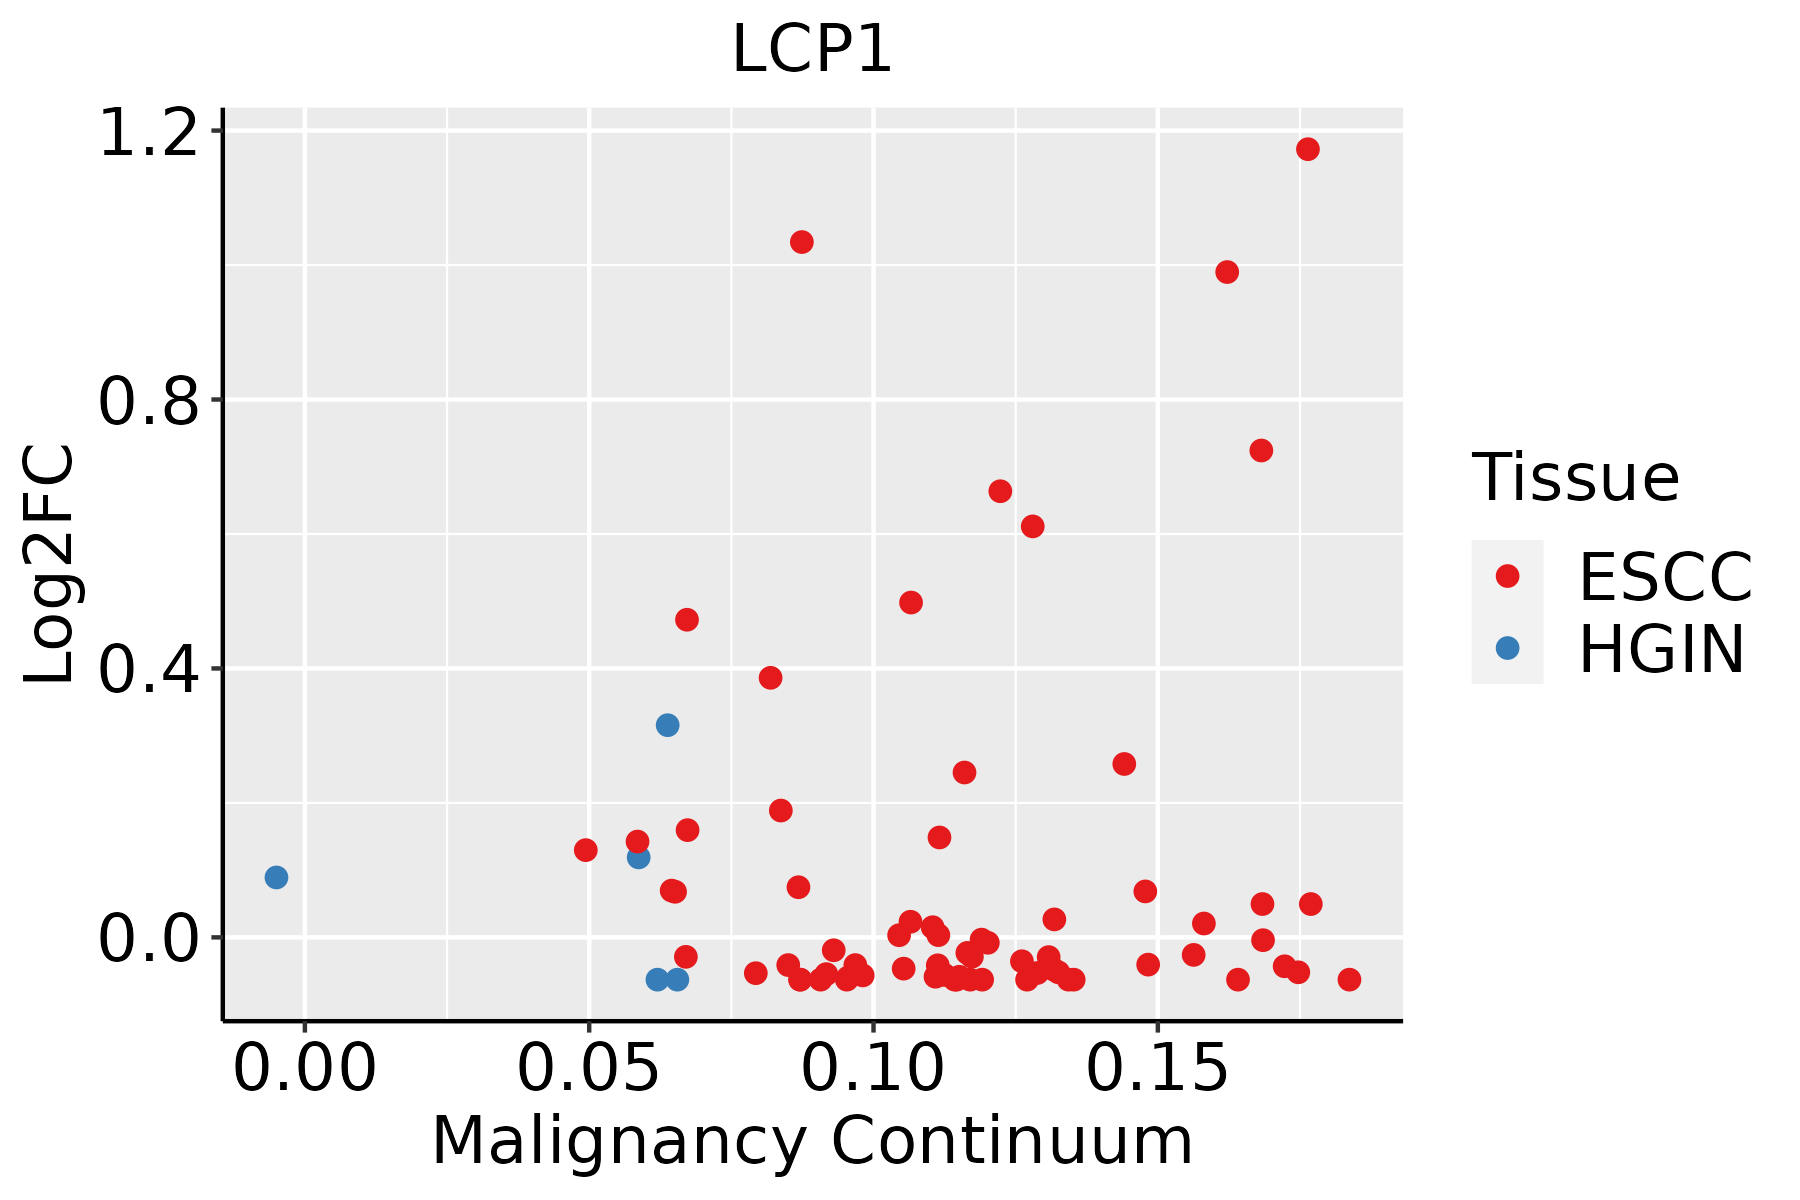 | ESCC: Esophageal squamous cell carcinoma |
| HGIN: High-grade intraepithelial neoplasias | ||
| LGIN: Low-grade intraepithelial neoplasias | ||
| Liver | 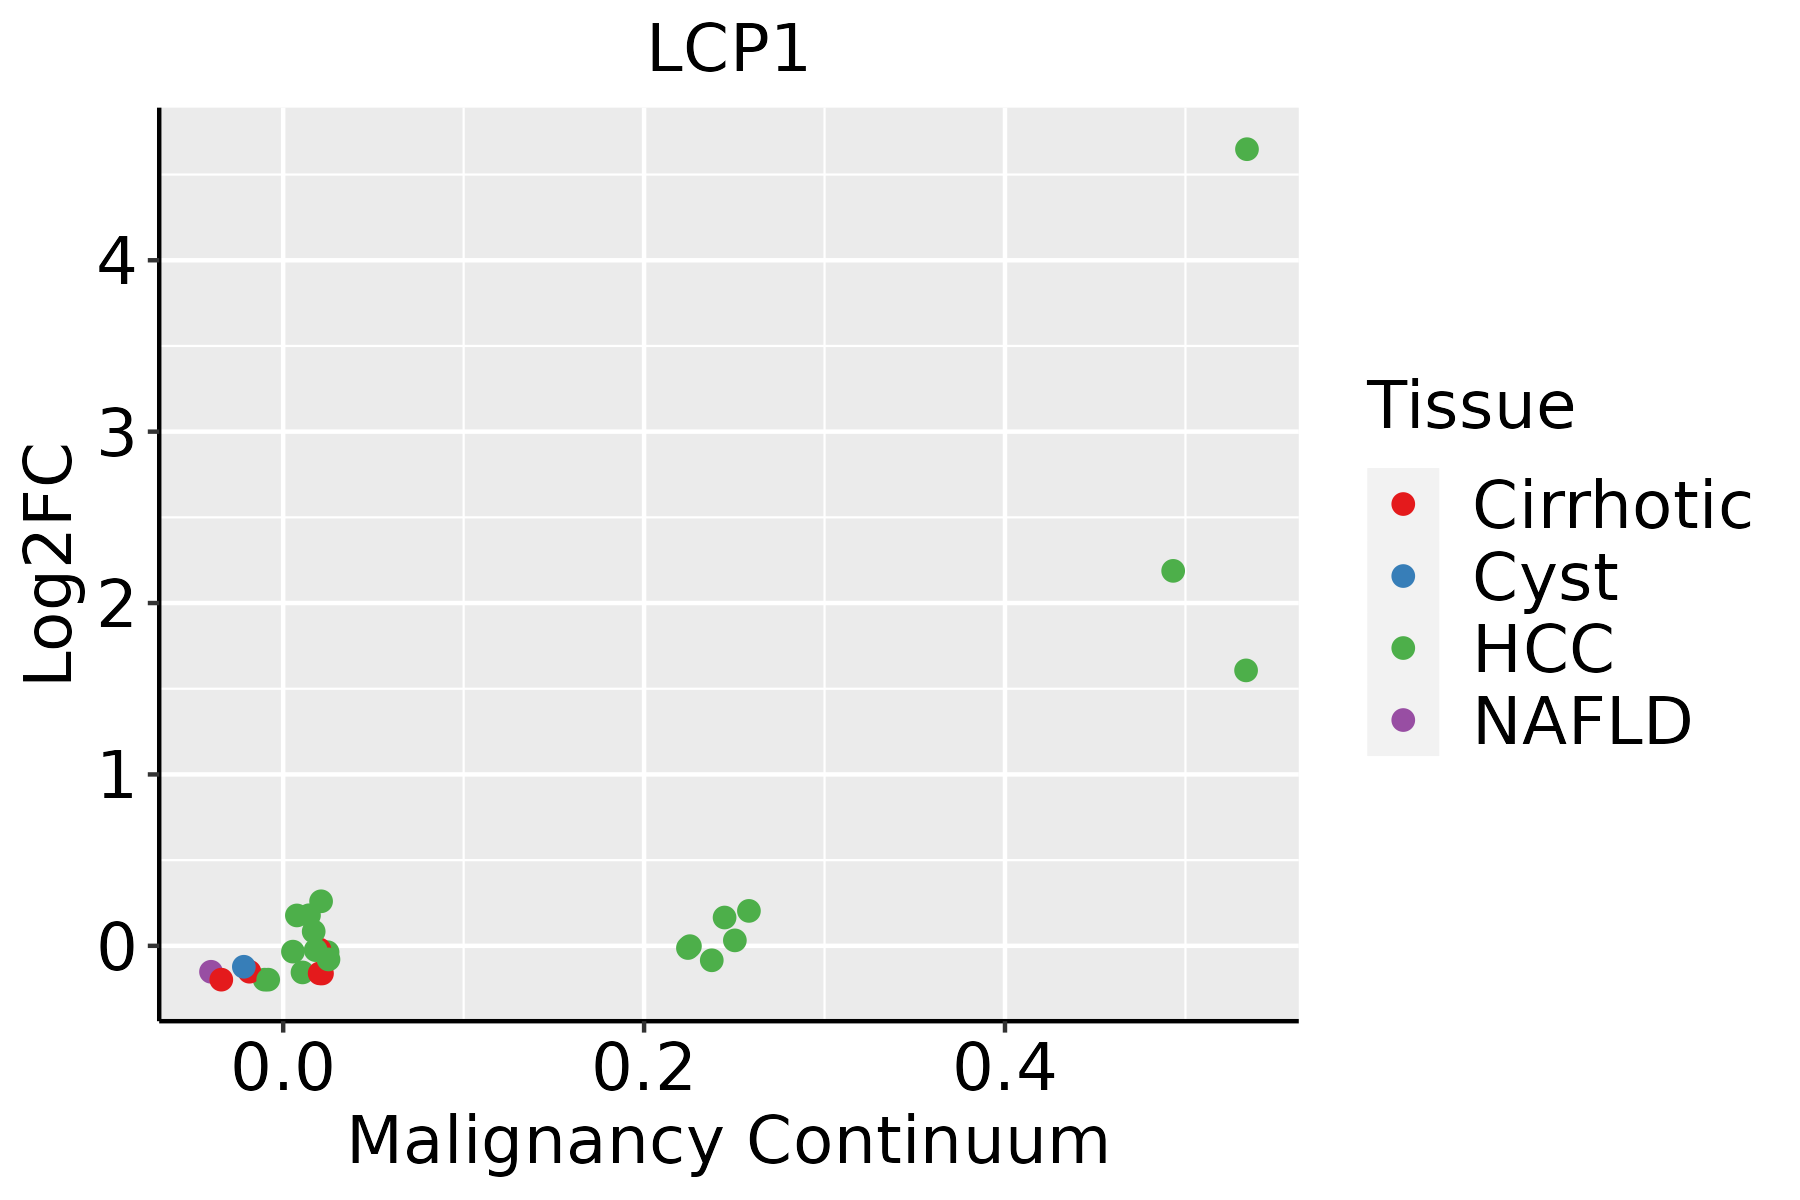 | HCC: Hepatocellular carcinoma |
| NAFLD: Non-alcoholic fatty liver disease | ||
| Oral Cavity | 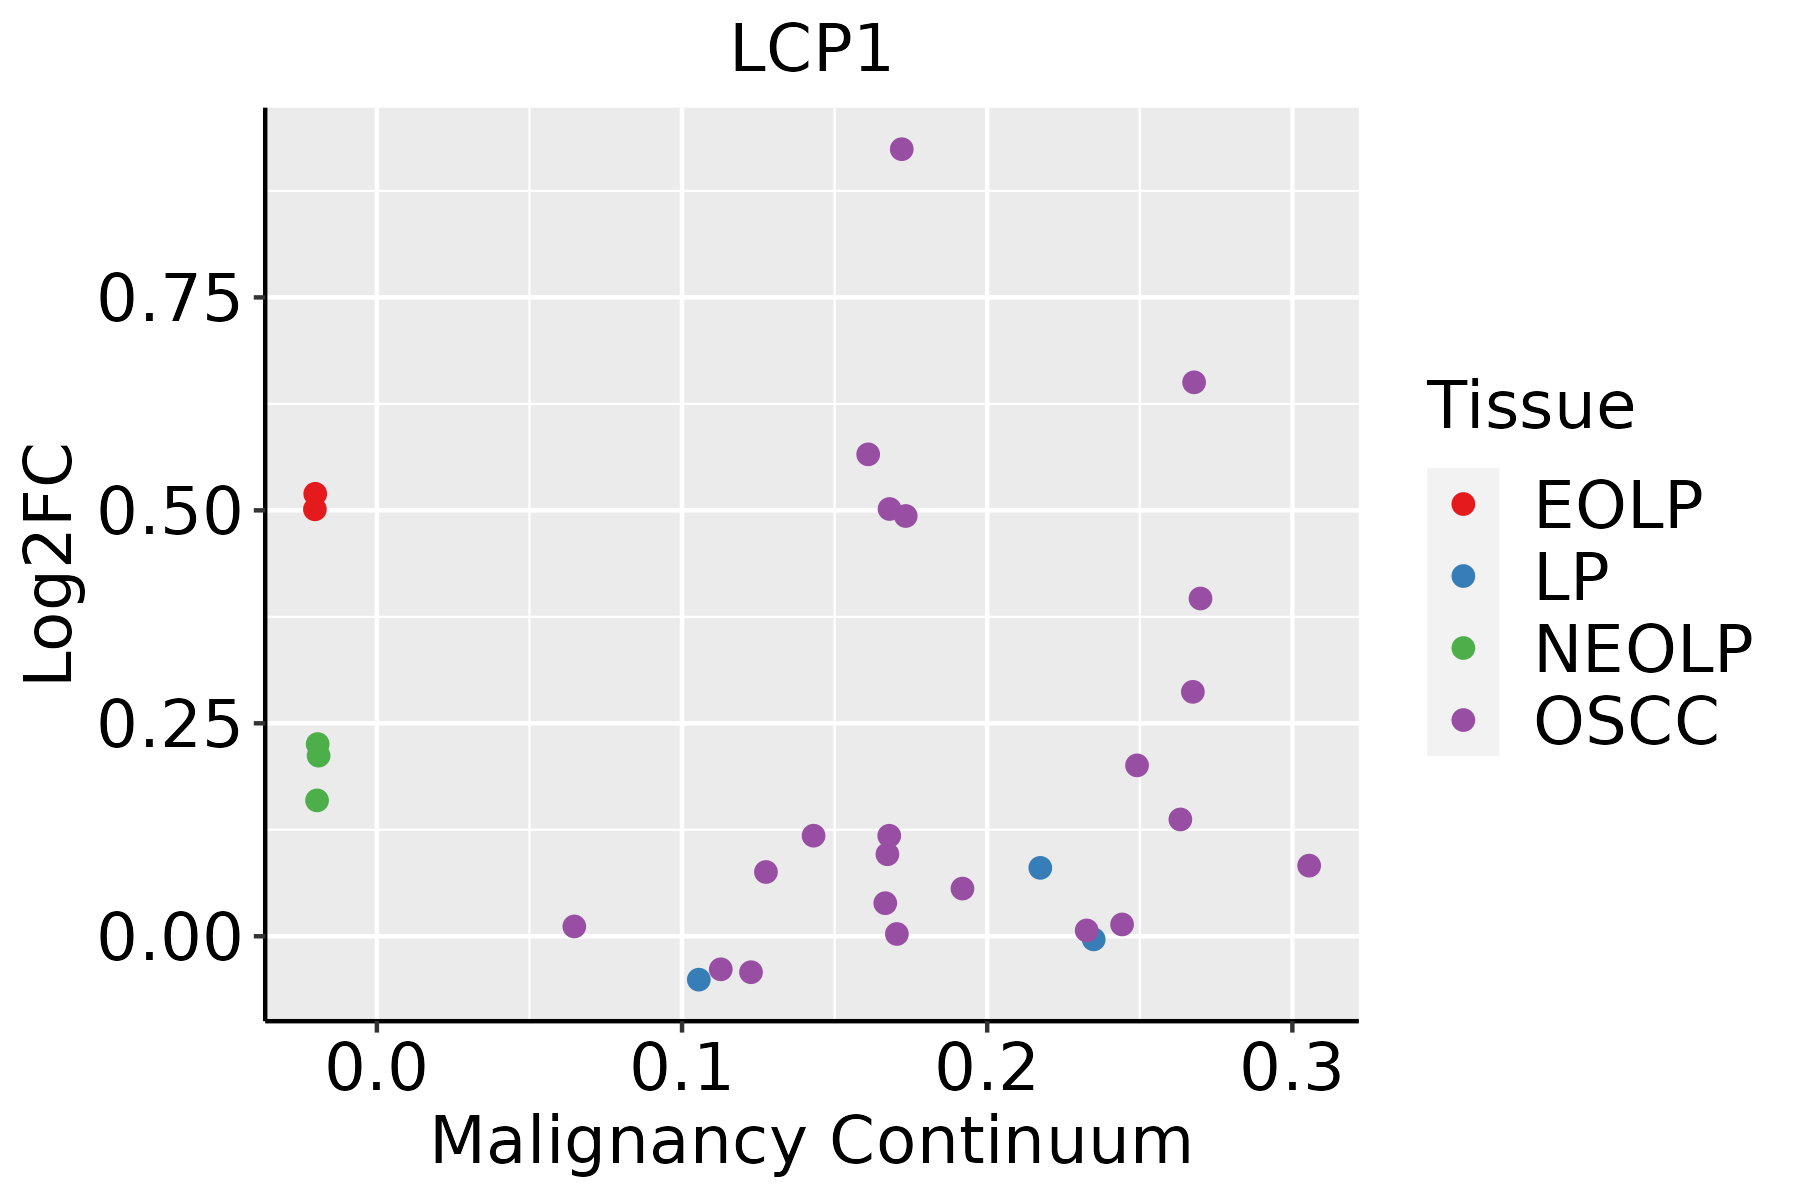 | EOLP: Erosive Oral lichen planus |
| LP: leukoplakia | ||
| NEOLP: Non-erosive oral lichen planus | ||
| OSCC: Oral squamous cell carcinoma | ||
| Prostate | 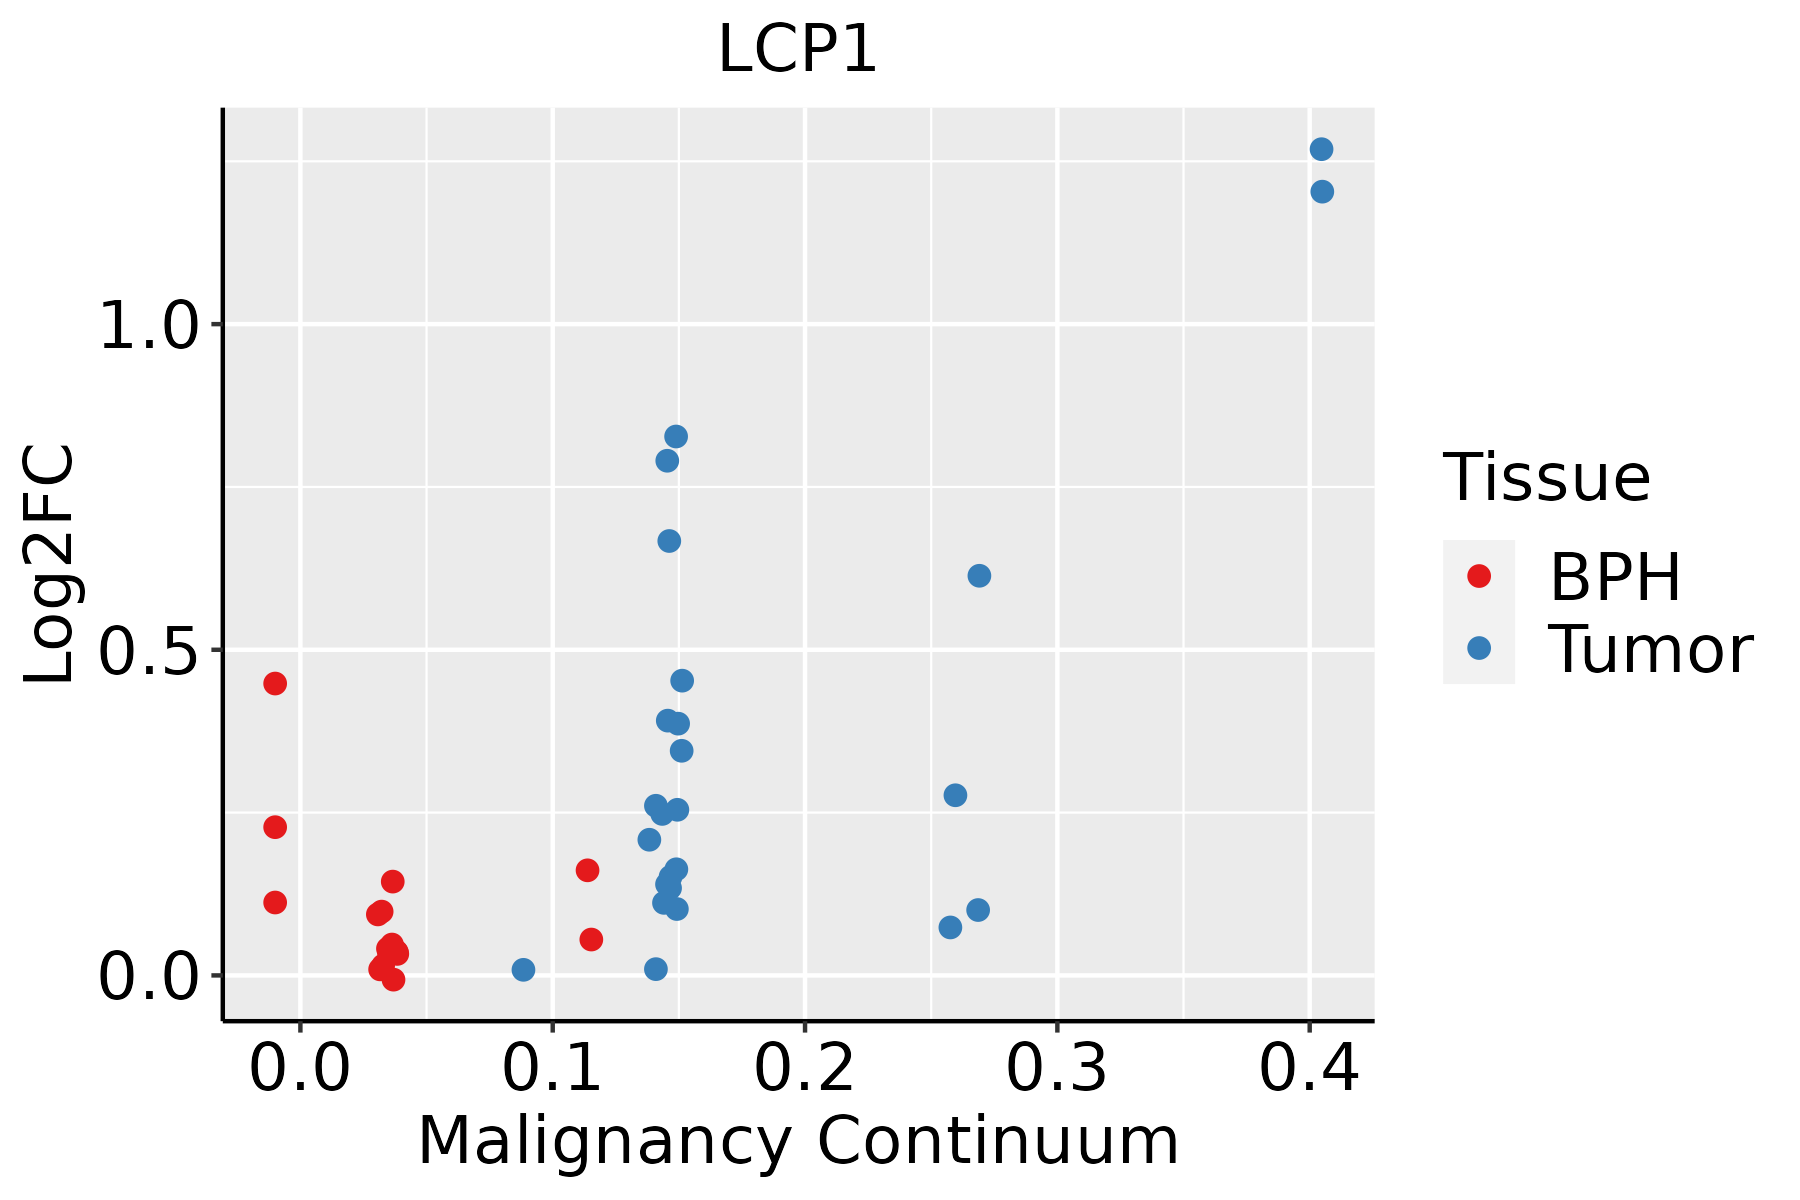 | BPH: Benign Prostatic Hyperplasia |
| ∗log2FC in expression of this searched gene in stem-like cells from each diseased tissue sample relative to stem-like cells in normal samples in each tissue plotted against the malignancy continuum. Samples are colored based on if they are from different disease stage. |
Top |
Malignant transformation related pathway analysis |
| Find out the enriched GO biological processes and KEGG pathways involved in transition from healthy to precancer to cancer |
| Tissue | Disease Stage | Enriched GO biological Processes |
| Colorectum | AD |  |
| Colorectum | SER |  |
| Colorectum | MSS |  |
| Colorectum | MSI-H |  |
| Colorectum | FAP |  |
| ∗Top 15 enriched GO BP terms are showed in the bar plot of each disease state in each tissue. Each row represents a significant GO biological process which is colored according to the -log10(p.adjust). |
| Page: 1 2 3 4 5 6 7 8 9 |
| GO ID | Tissue | Disease Stage | Description | Gene Ratio | Bg Ratio | pvalue | p.adjust | Count |
| GO:000701510 | Cervix | CC | actin filament organization | 109/2311 | 442/18723 | 4.92e-13 | 2.45e-10 | 109 |
| GO:00421108 | Cervix | CC | T cell activation | 107/2311 | 487/18723 | 1.24e-09 | 1.46e-07 | 107 |
| GO:004325410 | Cervix | CC | regulation of protein-containing complex assembly | 96/2311 | 428/18723 | 2.91e-09 | 3.05e-07 | 96 |
| GO:006157210 | Cervix | CC | actin filament bundle organization | 44/2311 | 161/18723 | 2.08e-07 | 9.34e-06 | 44 |
| GO:005101710 | Cervix | CC | actin filament bundle assembly | 43/2311 | 157/18723 | 2.66e-07 | 1.12e-05 | 43 |
| GO:003133410 | Cervix | CC | positive regulation of protein-containing complex assembly | 55/2311 | 237/18723 | 2.25e-06 | 6.73e-05 | 55 |
| GO:00323868 | Cervix | CC | regulation of intracellular transport | 71/2311 | 337/18723 | 3.70e-06 | 9.74e-05 | 71 |
| GO:00331579 | Cervix | CC | regulation of intracellular protein transport | 52/2311 | 229/18723 | 8.16e-06 | 1.88e-04 | 52 |
| GO:00310996 | Cervix | CC | regeneration | 46/2311 | 198/18723 | 1.43e-05 | 2.84e-04 | 46 |
| GO:002241110 | Cervix | CC | cellular component disassembly | 83/2311 | 443/18723 | 6.04e-05 | 8.68e-04 | 83 |
| GO:00308657 | Cervix | CC | cortical cytoskeleton organization | 19/2311 | 61/18723 | 8.72e-05 | 1.16e-03 | 19 |
| GO:19021153 | Cervix | CC | regulation of organelle assembly | 40/2311 | 186/18723 | 2.92e-04 | 3.15e-03 | 40 |
| GO:19021171 | Cervix | CC | positive regulation of organelle assembly | 19/2311 | 67/18723 | 3.42e-04 | 3.58e-03 | 19 |
| GO:00308667 | Cervix | CC | cortical actin cytoskeleton organization | 12/2311 | 40/18723 | 2.44e-03 | 1.71e-02 | 12 |
| GO:0002263 | Cervix | CC | cell activation involved in immune response | 50/2311 | 279/18723 | 4.16e-03 | 2.57e-02 | 50 |
| GO:0030198 | Cervix | CC | extracellular matrix organization | 52/2311 | 301/18723 | 7.43e-03 | 3.98e-02 | 52 |
| GO:0043062 | Cervix | CC | extracellular structure organization | 52/2311 | 302/18723 | 7.92e-03 | 4.17e-02 | 52 |
| GO:0022617 | Cervix | CC | extracellular matrix disassembly | 15/2311 | 63/18723 | 8.52e-03 | 4.40e-02 | 15 |
| GO:0045229 | Cervix | CC | external encapsulating structure organization | 52/2311 | 304/18723 | 9.00e-03 | 4.57e-02 | 52 |
| GO:00311005 | Cervix | CC | animal organ regeneration | 17/2311 | 76/18723 | 1.02e-02 | 4.94e-02 | 17 |
| Page: 1 2 3 4 5 6 7 8 9 |
| Pathway ID | Tissue | Disease Stage | Description | Gene Ratio | Bg Ratio | pvalue | p.adjust | qvalue | Count |
| Page: 1 |
Top |
Cell-cell communication analysis |
| Identification of potential cell-cell interactions between two cell types and their ligand-receptor pairs for different disease states |
| Ligand | Receptor | LRpair | Pathway | Tissue | Disease Stage |
| Page: 1 |
Top |
Single-cell gene regulatory network inference analysis |
| Find out the significant the regulons (TFs) and the target genes of each regulon across cell types for different disease states |
| TF | Cell Type | Tissue | Disease Stage | Target Gene | RSS | Regulon Activity |
| ∗The dot plots of a searched regulon are shown for all cell subpopulations in each disease state of each tissue based on the regulon specific score inferred using pySCENIC and by calculating the average expression. |
| Page: 1 |
Top |
Somatic mutation of malignant transformation related genes |
| Annotation of somatic variants for genes involved in malignant transformation |
| Hugo Symbol | Variant Class | Variant Classification | dbSNP RS | HGVSc | HGVSp | HGVSp Short | SWISSPROT | BIOTYPE | SIFT | PolyPhen | Tumor Sample Barcode | Tissue | Histology | Sex | Age | Stage | Therapy Types | Drugs | Outcome |
| LCP1 | SNV | Missense_Mutation | c.1763C>T | p.Ser588Phe | p.S588F | P13796 | protein_coding | deleterious(0) | probably_damaging(1) | TCGA-A8-A075-01 | Breast | breast invasive carcinoma | Female | <65 | I/II | Chemotherapy | epirubicin | CR | |
| LCP1 | SNV | Missense_Mutation | c.1831N>T | p.Met611Leu | p.M611L | P13796 | protein_coding | deleterious(0.02) | probably_damaging(0.952) | TCGA-B6-A0RE-01 | Breast | breast invasive carcinoma | Female | <65 | I/II | Unknown | Unknown | SD | |
| LCP1 | SNV | Missense_Mutation | c.236N>G | p.His79Arg | p.H79R | P13796 | protein_coding | tolerated(0.5) | benign(0.028) | TCGA-B6-A0X0-01 | Breast | breast invasive carcinoma | Female | <65 | I/II | Unknown | Unknown | SD | |
| LCP1 | SNV | Missense_Mutation | novel | c.1631N>T | p.Pro544Leu | p.P544L | P13796 | protein_coding | deleterious(0.03) | benign(0.094) | TCGA-BH-A5J0-01 | Breast | breast invasive carcinoma | Female | <65 | I/II | Unknown | Unknown | SD |
| LCP1 | SNV | Missense_Mutation | novel | c.751N>G | p.Leu251Val | p.L251V | P13796 | protein_coding | deleterious(0.03) | probably_damaging(0.997) | TCGA-S3-AA10-01 | Breast | breast invasive carcinoma | Female | >=65 | I/II | Chemotherapy | cytoxan | CR |
| LCP1 | deletion | Frame_Shift_Del | novel | c.1460delN | p.Asn487ThrfsTer8 | p.N487Tfs*8 | P13796 | protein_coding | TCGA-EW-A2FV-01 | Breast | breast invasive carcinoma | Female | <65 | III/IV | Chemotherapy | docetaxel | SD | ||
| LCP1 | deletion | Frame_Shift_Del | novel | c.97delN | p.Glu33SerfsTer2 | p.E33Sfs*2 | P13796 | protein_coding | TCGA-EW-A2FV-01 | Breast | breast invasive carcinoma | Female | <65 | III/IV | Chemotherapy | docetaxel | SD | ||
| LCP1 | SNV | Missense_Mutation | rs755322384 | c.1463N>A | p.Arg488His | p.R488H | P13796 | protein_coding | tolerated(0.16) | benign(0.005) | TCGA-EA-A410-01 | Cervix | cervical & endocervical cancer | Female | <65 | I/II | Unknown | Unknown | SD |
| LCP1 | SNV | Missense_Mutation | rs755322384 | c.1463G>A | p.Arg488His | p.R488H | P13796 | protein_coding | tolerated(0.16) | benign(0.005) | TCGA-A6-6781-01 | Colorectum | colon adenocarcinoma | Male | <65 | III/IV | Chemotherapy | oxaliplatin | SD |
| LCP1 | SNV | Missense_Mutation | rs755322384 | c.1463N>A | p.Arg488His | p.R488H | P13796 | protein_coding | tolerated(0.16) | benign(0.005) | TCGA-AA-3713-01 | Colorectum | colon adenocarcinoma | Male | >=65 | III/IV | Chemotherapy | 5-fluorouracil | PR |
| Page: 1 2 3 4 5 6 7 8 9 |
Top |
Related drugs of malignant transformation related genes |
| Identification of chemicals and drugs interact with genes involved in malignant transfromation |
| (DGIdb 4.0) |
| Entrez ID | Symbol | Category | Interaction Types | Drug Claim Name | Drug Name | PMIDs |
| Page: 1 |

Copyright 2023-Present -The University of Texas Health Science Center at Houston |