
|
|||||
|
 | |
| |
| |
| |
| |
| |
|
Gene: LAMTOR4 |
Gene summary for LAMTOR4 |
| Gene information | Species | Human | Gene symbol | LAMTOR4 | Gene ID | 389541 |
| Gene name | late endosomal/lysosomal adaptor, MAPK and MTOR activator 4 | |
| Gene Alias | C7orf59 | |
| Cytomap | 7q22.1 | |
| Gene Type | protein-coding | GO ID | GO:0001101 | UniProtAcc | Q0VGL1 |
Top |
Malignant transformation analysis |
| Identification of the aberrant gene expression in precancerous and cancerous lesions by comparing the gene expression of stem-like cells in diseased tissues with normal stem cells |
| Entrez ID | Symbol | Replicates | Species | Organ | Tissue | Adj P-value | Log2FC | Malignancy |
| 389541 | LAMTOR4 | HTA11_2992_2000001011 | Human | Colorectum | SER | 3.91e-06 | 5.01e-01 | -0.1706 |
| 389541 | LAMTOR4 | HTA11_5212_2000001011 | Human | Colorectum | AD | 1.66e-02 | 5.33e-01 | -0.2061 |
| 389541 | LAMTOR4 | HTA11_546_2000001011 | Human | Colorectum | AD | 4.03e-04 | 4.42e-01 | -0.0842 |
| 389541 | LAMTOR4 | HTA11_10623_2000001011 | Human | Colorectum | AD | 4.98e-02 | 5.29e-01 | -0.0177 |
| 389541 | LAMTOR4 | HTA11_6801_2000001011 | Human | Colorectum | SER | 3.65e-02 | 4.62e-01 | 0.0171 |
| 389541 | LAMTOR4 | HTA11_10711_2000001011 | Human | Colorectum | AD | 2.77e-03 | 3.66e-01 | 0.0338 |
| 389541 | LAMTOR4 | HTA11_7696_3000711011 | Human | Colorectum | AD | 4.92e-05 | 3.25e-01 | 0.0674 |
| 389541 | LAMTOR4 | HTA11_99999965104_69814 | Human | Colorectum | MSS | 1.85e-03 | 2.81e-01 | 0.281 |
| 389541 | LAMTOR4 | HTA11_99999971662_82457 | Human | Colorectum | MSS | 7.55e-06 | 3.25e-01 | 0.3859 |
| 389541 | LAMTOR4 | HTA11_99999974143_84620 | Human | Colorectum | MSS | 9.98e-07 | 3.28e-01 | 0.3005 |
| 389541 | LAMTOR4 | AEH-subject1 | Human | Endometrium | AEH | 1.05e-09 | -3.93e-01 | -0.3059 |
| 389541 | LAMTOR4 | AEH-subject2 | Human | Endometrium | AEH | 2.47e-15 | -4.00e-01 | -0.2525 |
| 389541 | LAMTOR4 | AEH-subject3 | Human | Endometrium | AEH | 5.53e-14 | -2.98e-01 | -0.2576 |
| 389541 | LAMTOR4 | AEH-subject4 | Human | Endometrium | AEH | 1.96e-19 | -4.89e-01 | -0.2657 |
| 389541 | LAMTOR4 | AEH-subject5 | Human | Endometrium | AEH | 1.22e-12 | -4.27e-01 | -0.2953 |
| 389541 | LAMTOR4 | EEC-subject1 | Human | Endometrium | EEC | 4.45e-27 | -4.86e-01 | -0.2682 |
| 389541 | LAMTOR4 | EEC-subject2 | Human | Endometrium | EEC | 7.13e-12 | -3.97e-01 | -0.2607 |
| 389541 | LAMTOR4 | EEC-subject3 | Human | Endometrium | EEC | 1.61e-59 | -5.48e-01 | -0.2525 |
| 389541 | LAMTOR4 | EEC-subject4 | Human | Endometrium | EEC | 1.71e-08 | -2.09e-01 | -0.2571 |
| 389541 | LAMTOR4 | EEC-subject5 | Human | Endometrium | EEC | 1.50e-09 | -2.88e-01 | -0.249 |
| Page: 1 2 3 4 5 6 7 8 9 10 11 12 |
| Tissue | Expression Dynamics | Abbreviation |
| Cervix |  | CC: Cervix cancer |
| HSIL_HPV: HPV-infected high-grade squamous intraepithelial lesions | ||
| N_HPV: HPV-infected normal cervix | ||
| Colorectum (GSE201348) |  | FAP: Familial adenomatous polyposis |
| CRC: Colorectal cancer | ||
| Colorectum (HTA11) |  | AD: Adenomas |
| SER: Sessile serrated lesions | ||
| MSI-H: Microsatellite-high colorectal cancer | ||
| MSS: Microsatellite stable colorectal cancer | ||
| Endometrium |  | AEH: Atypical endometrial hyperplasia |
| EEC: Endometrioid Cancer | ||
| Esophagus | 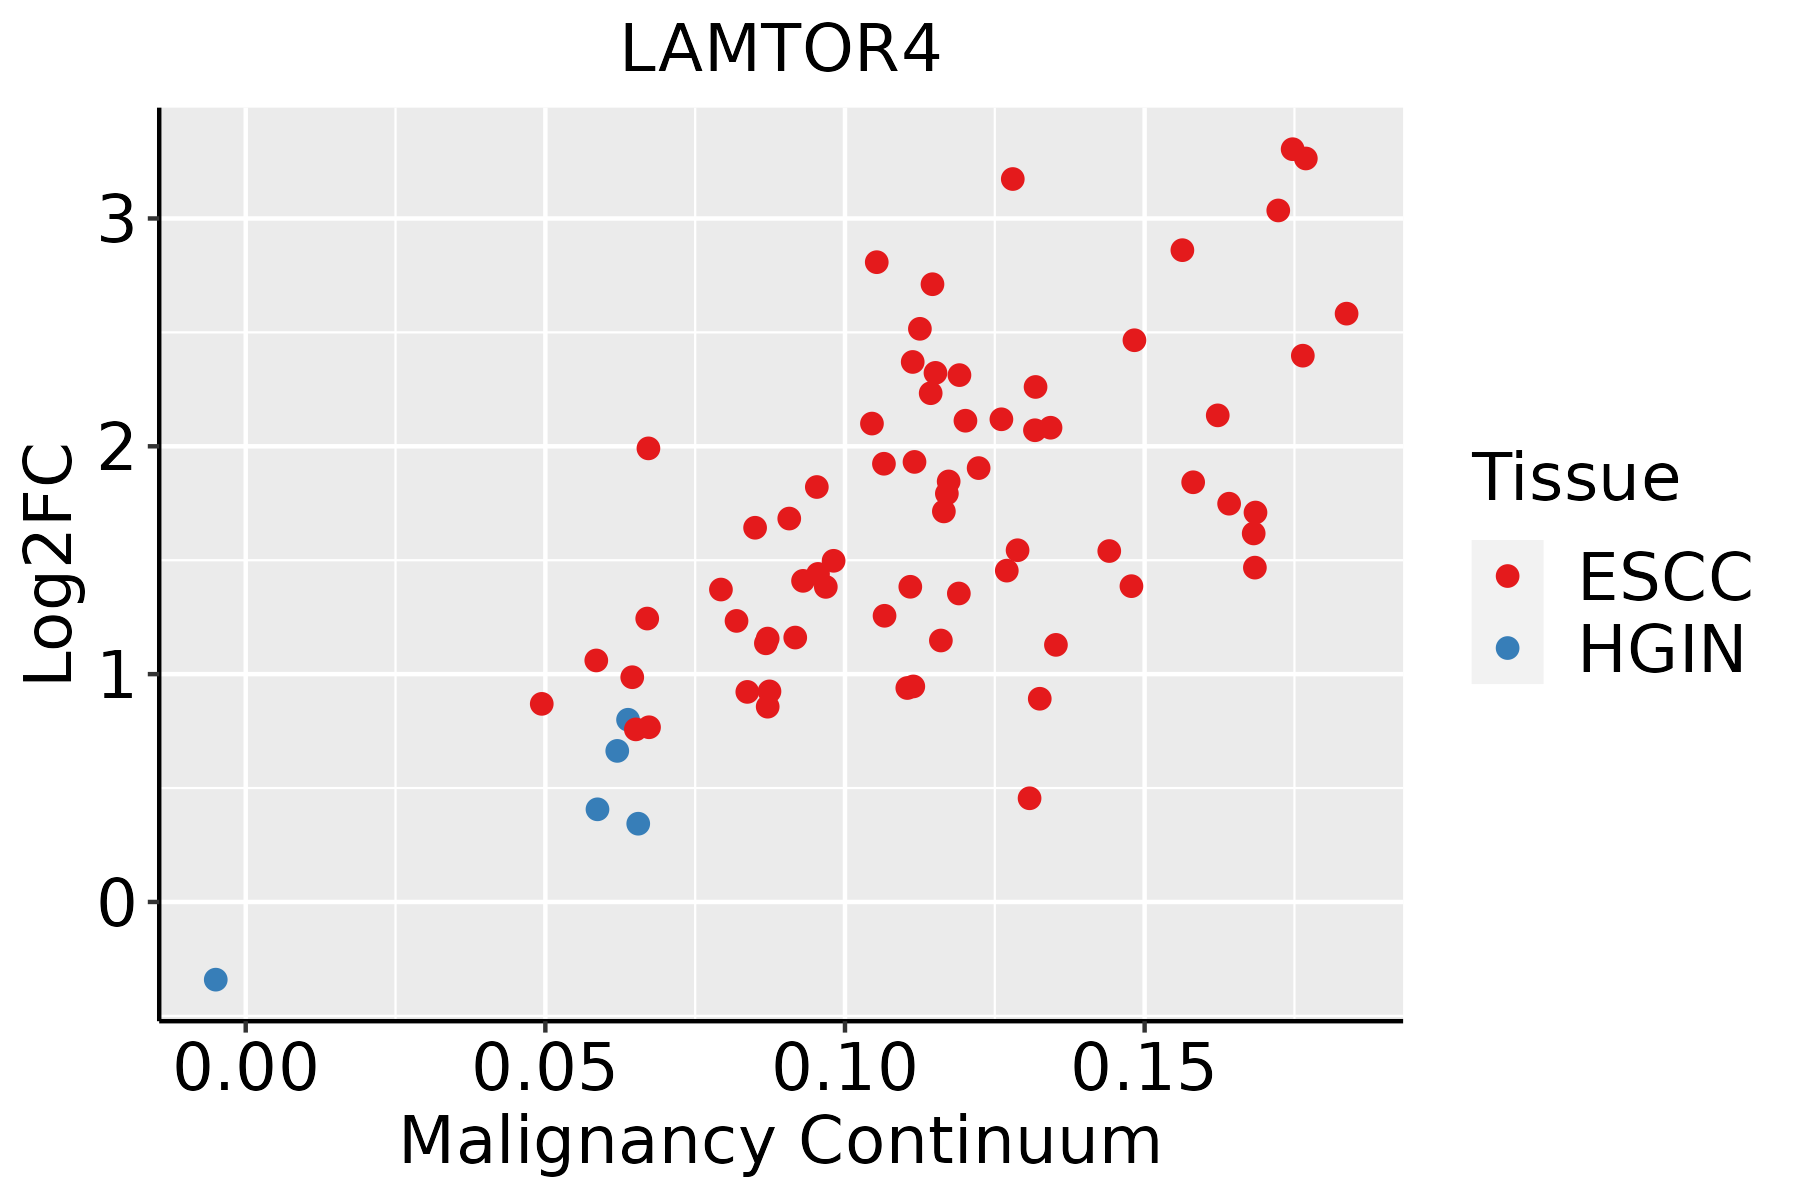 | ESCC: Esophageal squamous cell carcinoma |
| HGIN: High-grade intraepithelial neoplasias | ||
| LGIN: Low-grade intraepithelial neoplasias | ||
| GC | 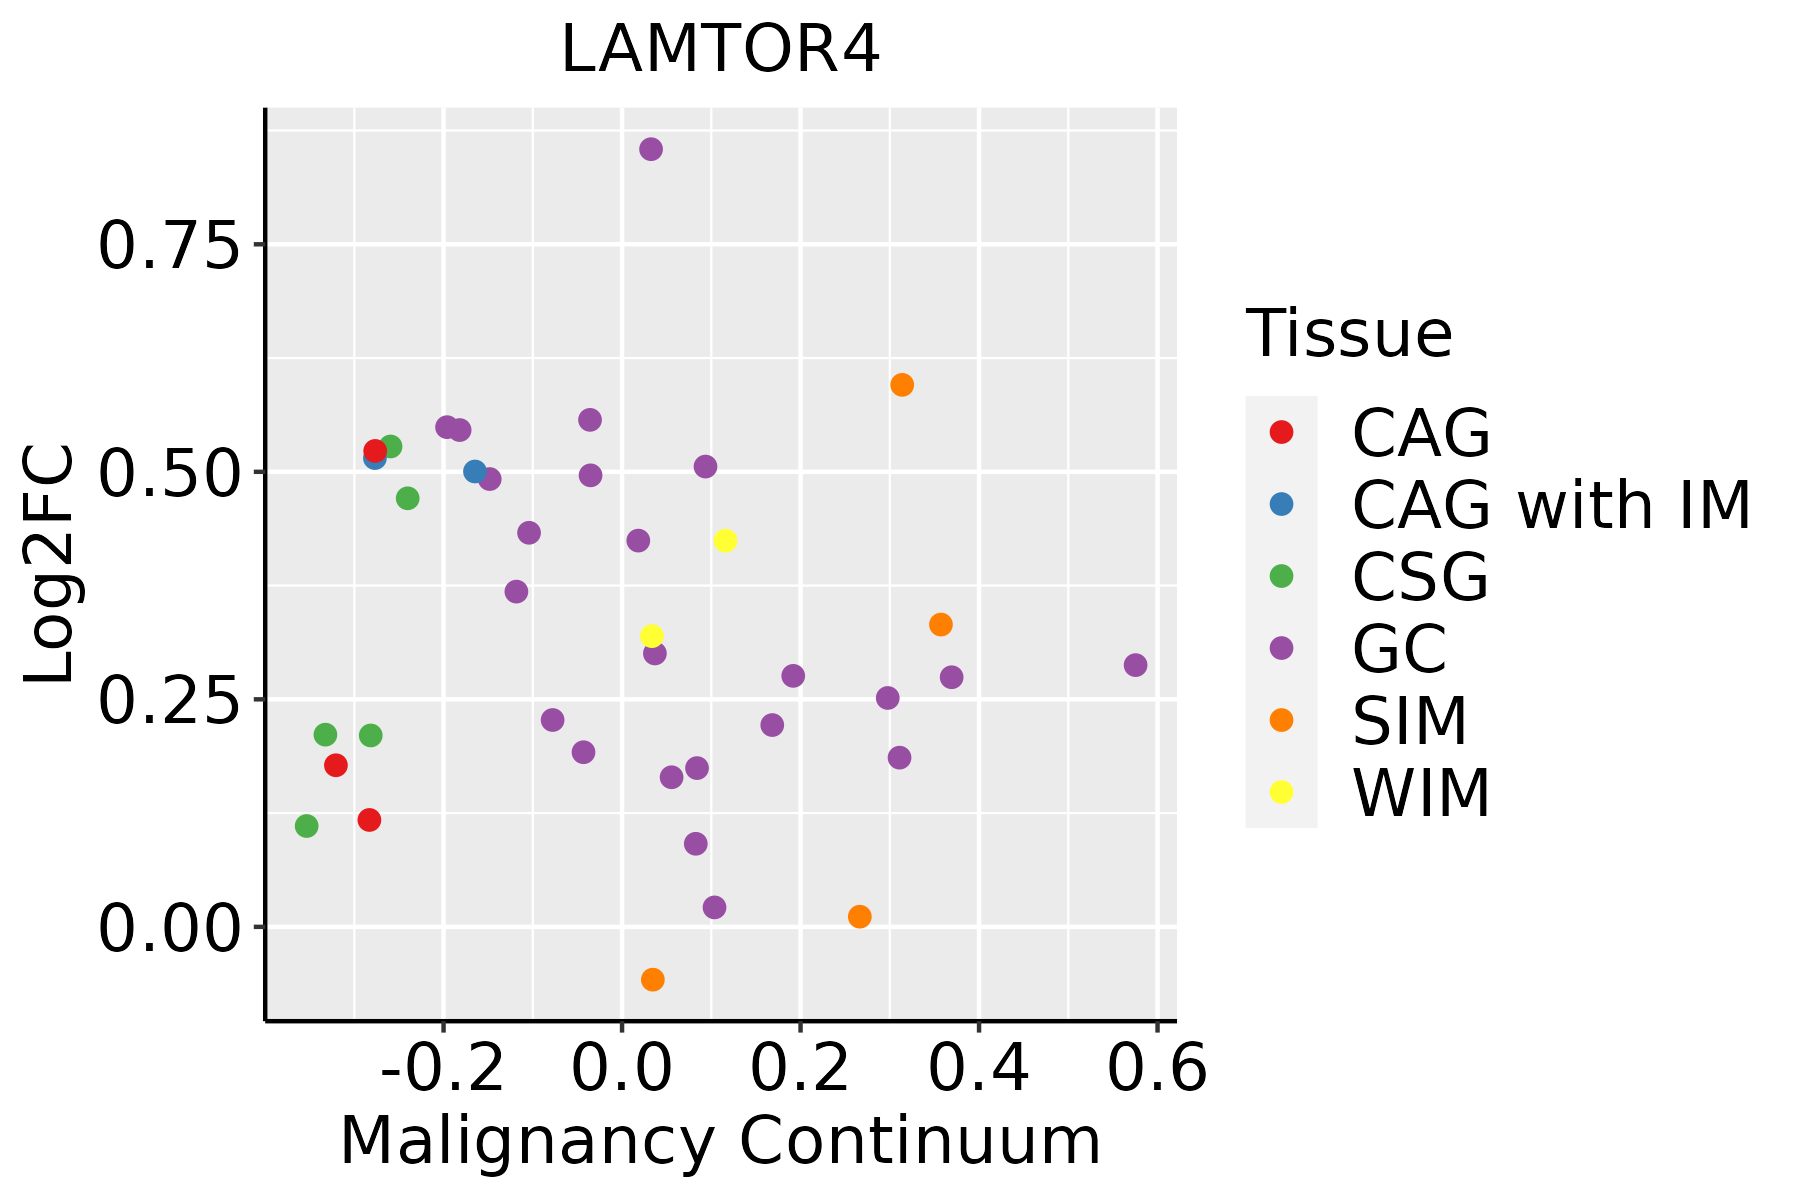 | CAG: Chronic atrophic gastritis |
| CAG with IM: Chronic atrophic gastritis with intestinal metaplasia | ||
| CSG: Chronic superficial gastritis | ||
| GC: Gastric cancer | ||
| SIM: Severe intestinal metaplasia | ||
| WIM: Wild intestinal metaplasia | ||
| Liver | 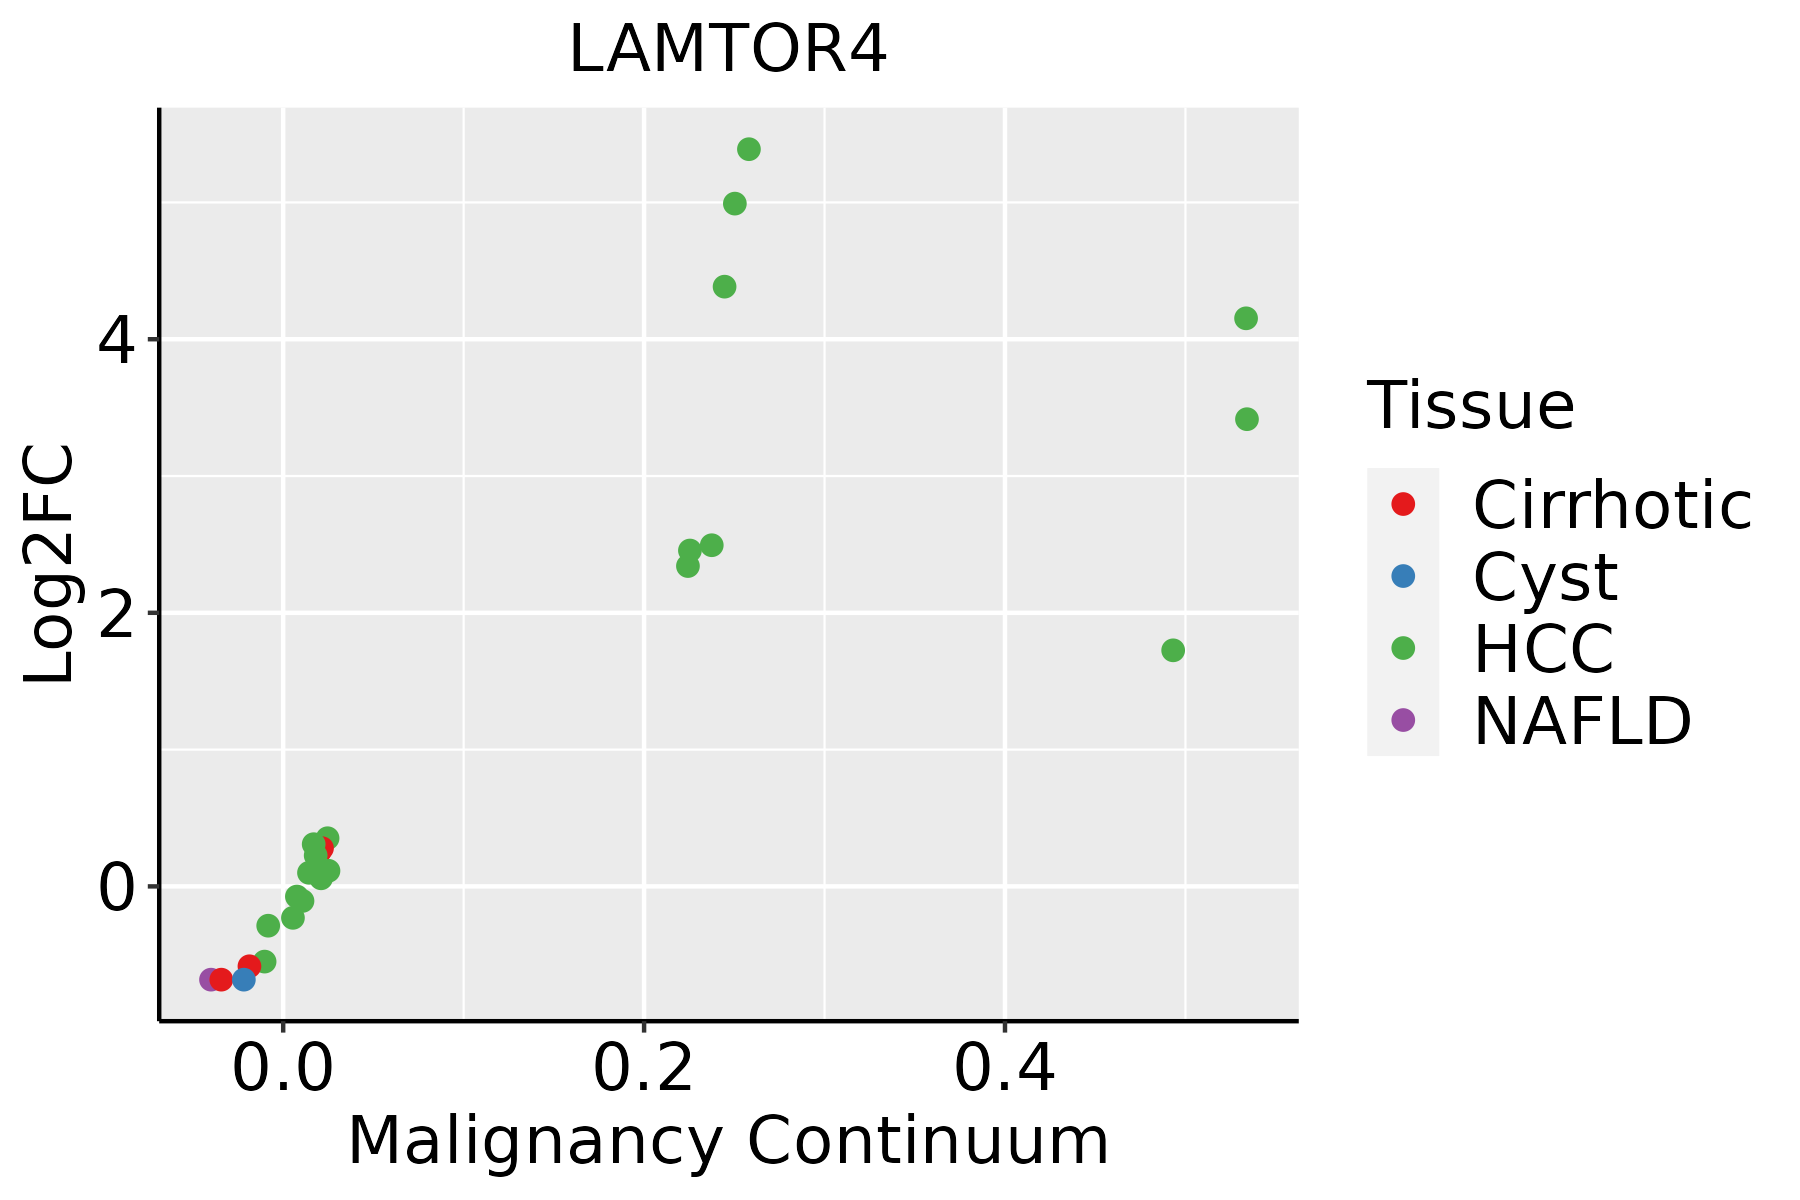 | HCC: Hepatocellular carcinoma |
| NAFLD: Non-alcoholic fatty liver disease | ||
| Oral Cavity |  | EOLP: Erosive Oral lichen planus |
| LP: leukoplakia | ||
| NEOLP: Non-erosive oral lichen planus | ||
| OSCC: Oral squamous cell carcinoma | ||
| Prostate |  | BPH: Benign Prostatic Hyperplasia |
| Skin | 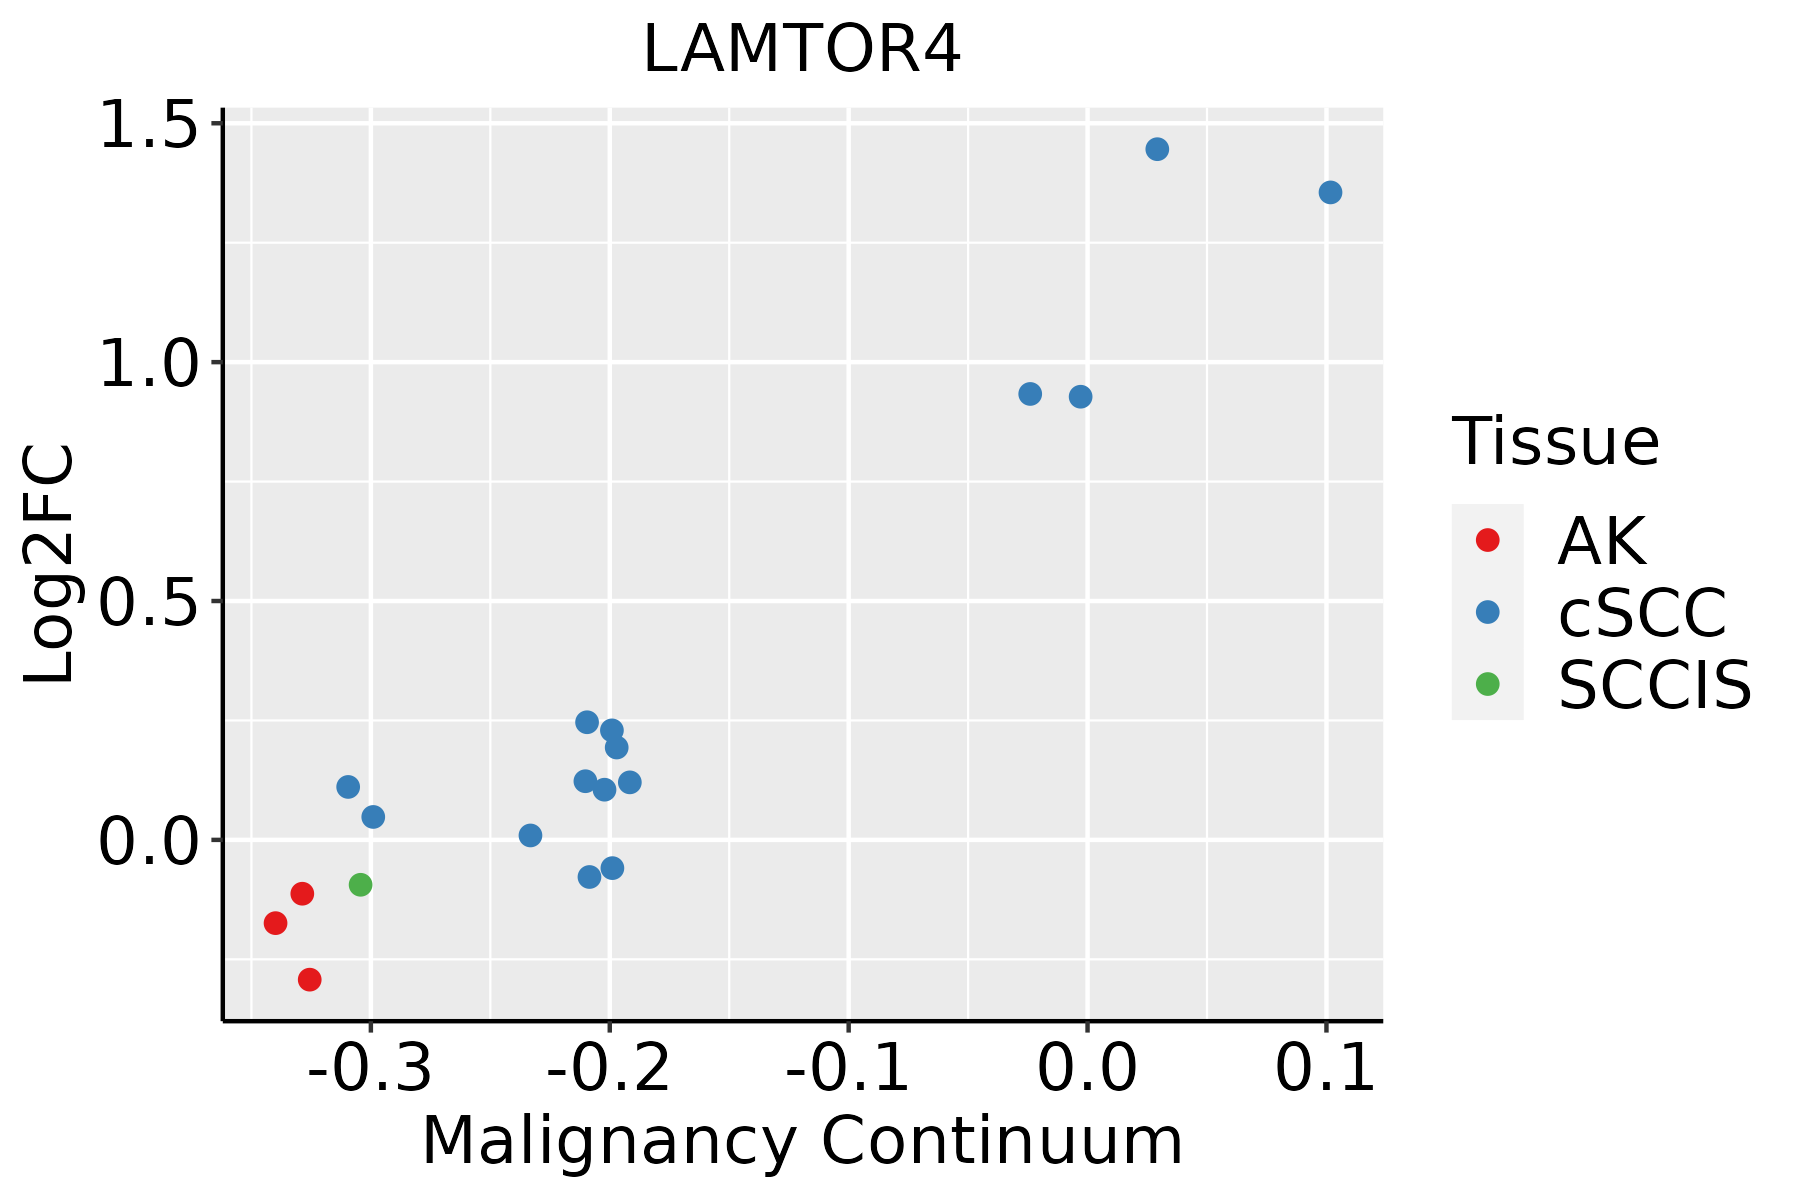 | AK: Actinic keratosis |
| cSCC: Cutaneous squamous cell carcinoma | ||
| SCCIS:squamous cell carcinoma in situ | ||
| Thyroid |  | ATC: Anaplastic thyroid cancer |
| HT: Hashimoto's thyroiditis | ||
| PTC: Papillary thyroid cancer |
| ∗log2FC in expression of this searched gene in stem-like cells from each diseased tissue sample relative to stem-like cells in normal samples in each tissue plotted against the malignancy continuum. Samples are colored based on if they are from different disease stage. |
Top |
Malignant transformation related pathway analysis |
| Find out the enriched GO biological processes and KEGG pathways involved in transition from healthy to precancer to cancer |
| Tissue | Disease Stage | Enriched GO biological Processes |
| Colorectum | AD |  |
| Colorectum | SER |  |
| Colorectum | MSS |  |
| Colorectum | MSI-H |  |
| Colorectum | FAP |  |
| ∗Top 15 enriched GO BP terms are showed in the bar plot of each disease state in each tissue. Each row represents a significant GO biological process which is colored according to the -log10(p.adjust). |
| Page: 1 2 3 4 5 6 7 8 9 |
| GO ID | Tissue | Disease Stage | Description | Gene Ratio | Bg Ratio | pvalue | p.adjust | Count |
| GO:00325359 | Cervix | CC | regulation of cellular component size | 76/2311 | 383/18723 | 1.66e-05 | 3.21e-04 | 76 |
| GO:00726655 | Cervix | CC | protein localization to vacuole | 20/2311 | 67/18723 | 1.12e-04 | 1.40e-03 | 20 |
| GO:00011016 | Cervix | CC | response to acid chemical | 31/2311 | 135/18723 | 4.16e-04 | 4.22e-03 | 31 |
| GO:00712292 | Cervix | CC | cellular response to acid chemical | 20/2311 | 80/18723 | 1.40e-03 | 1.10e-02 | 20 |
| GO:00712301 | Cervix | CC | cellular response to amino acid stimulus | 18/2311 | 71/18723 | 2.01e-03 | 1.47e-02 | 18 |
| GO:00614623 | Cervix | CC | protein localization to lysosome | 13/2311 | 46/18723 | 2.95e-03 | 1.94e-02 | 13 |
| GO:00432004 | Cervix | CC | response to amino acid | 25/2311 | 116/18723 | 3.59e-03 | 2.30e-02 | 25 |
| GO:003253515 | Cervix | HSIL_HPV | regulation of cellular component size | 27/737 | 383/18723 | 2.63e-03 | 2.54e-02 | 27 |
| GO:0032535 | Colorectum | AD | regulation of cellular component size | 142/3918 | 383/18723 | 1.74e-13 | 3.41e-11 | 142 |
| GO:0072665 | Colorectum | AD | protein localization to vacuole | 27/3918 | 67/18723 | 2.40e-04 | 3.04e-03 | 27 |
| GO:0008361 | Colorectum | AD | regulation of cell size | 56/3918 | 181/18723 | 9.61e-04 | 9.07e-03 | 56 |
| GO:0061462 | Colorectum | AD | protein localization to lysosome | 19/3918 | 46/18723 | 1.36e-03 | 1.19e-02 | 19 |
| GO:00325351 | Colorectum | SER | regulation of cellular component size | 115/2897 | 383/18723 | 3.04e-13 | 1.10e-10 | 115 |
| GO:00726651 | Colorectum | SER | protein localization to vacuole | 19/2897 | 67/18723 | 5.14e-03 | 3.93e-02 | 19 |
| GO:00325352 | Colorectum | MSS | regulation of cellular component size | 127/3467 | 383/18723 | 3.44e-12 | 5.79e-10 | 127 |
| GO:00726652 | Colorectum | MSS | protein localization to vacuole | 23/3467 | 67/18723 | 1.51e-03 | 1.39e-02 | 23 |
| GO:00083611 | Colorectum | MSS | regulation of cell size | 50/3467 | 181/18723 | 1.65e-03 | 1.49e-02 | 50 |
| GO:0031929 | Colorectum | MSS | TOR signaling | 35/3467 | 126/18723 | 6.91e-03 | 4.44e-02 | 35 |
| GO:003253510 | Endometrium | AEH | regulation of cellular component size | 78/2100 | 383/18723 | 1.10e-07 | 5.29e-06 | 78 |
| GO:00083616 | Endometrium | AEH | regulation of cell size | 38/2100 | 181/18723 | 9.69e-05 | 1.40e-03 | 38 |
| Page: 1 2 3 4 5 6 7 8 |
| Pathway ID | Tissue | Disease Stage | Description | Gene Ratio | Bg Ratio | pvalue | p.adjust | qvalue | Count |
| hsa04150 | Colorectum | MSS | mTOR signaling pathway | 47/1875 | 156/8465 | 1.19e-02 | 3.99e-02 | 2.44e-02 | 47 |
| hsa041501 | Colorectum | MSS | mTOR signaling pathway | 47/1875 | 156/8465 | 1.19e-02 | 3.99e-02 | 2.44e-02 | 47 |
| hsa041505 | Esophagus | ESCC | mTOR signaling pathway | 98/4205 | 156/8465 | 5.81e-04 | 1.95e-03 | 9.97e-04 | 98 |
| hsa0415013 | Esophagus | ESCC | mTOR signaling pathway | 98/4205 | 156/8465 | 5.81e-04 | 1.95e-03 | 9.97e-04 | 98 |
| hsa041502 | Liver | HCC | mTOR signaling pathway | 95/4020 | 156/8465 | 4.70e-04 | 1.99e-03 | 1.11e-03 | 95 |
| hsa0415011 | Liver | HCC | mTOR signaling pathway | 95/4020 | 156/8465 | 4.70e-04 | 1.99e-03 | 1.11e-03 | 95 |
| hsa041504 | Oral cavity | OSCC | mTOR signaling pathway | 90/3704 | 156/8465 | 2.87e-04 | 9.15e-04 | 4.66e-04 | 90 |
| hsa0415012 | Oral cavity | OSCC | mTOR signaling pathway | 90/3704 | 156/8465 | 2.87e-04 | 9.15e-04 | 4.66e-04 | 90 |
| Page: 1 |
Top |
Cell-cell communication analysis |
| Identification of potential cell-cell interactions between two cell types and their ligand-receptor pairs for different disease states |
| Ligand | Receptor | LRpair | Pathway | Tissue | Disease Stage |
| Page: 1 |
Top |
Single-cell gene regulatory network inference analysis |
| Find out the significant the regulons (TFs) and the target genes of each regulon across cell types for different disease states |
| TF | Cell Type | Tissue | Disease Stage | Target Gene | RSS | Regulon Activity |
| ∗The dot plots of a searched regulon are shown for all cell subpopulations in each disease state of each tissue based on the regulon specific score inferred using pySCENIC and by calculating the average expression. |
| Page: 1 |
Top |
Somatic mutation of malignant transformation related genes |
| Annotation of somatic variants for genes involved in malignant transformation |
| Hugo Symbol | Variant Class | Variant Classification | dbSNP RS | HGVSc | HGVSp | HGVSp Short | SWISSPROT | BIOTYPE | SIFT | PolyPhen | Tumor Sample Barcode | Tissue | Histology | Sex | Age | Stage | Therapy Types | Drugs | Outcome |
| LAMTOR4 | SNV | Missense_Mutation | c.49N>C | p.Gly17Arg | p.G17R | Q0VGL1 | protein_coding | deleterious(0) | probably_damaging(1) | TCGA-C5-A2LX-01 | Cervix | cervical & endocervical cancer | Female | <65 | I/II | Chemotherapy | cisplatin | SD | |
| LAMTOR4 | SNV | Missense_Mutation | novel | c.194N>A | p.Arg65His | p.R65H | Q0VGL1 | protein_coding | tolerated(0.06) | benign(0.067) | TCGA-VS-A8EJ-01 | Cervix | cervical & endocervical cancer | Female | <65 | I/II | Chemotherapy | cisplatin | PD |
| LAMTOR4 | SNV | Missense_Mutation | novel | c.287N>T | p.Pro96Leu | p.P96L | Q0VGL1 | protein_coding | tolerated(0.06) | probably_damaging(0.998) | TCGA-AX-A1CE-01 | Endometrium | uterine corpus endometrioid carcinoma | Female | <65 | I/II | Unspecific | Paclitaxel | SD |
| LAMTOR4 | SNV | Missense_Mutation | c.76N>T | p.Val26Leu | p.V26L | Q0VGL1 | protein_coding | deleterious(0.03) | benign(0.269) | TCGA-B5-A3FA-01 | Endometrium | uterine corpus endometrioid carcinoma | Female | >=65 | I/II | Unknown | Unknown | SD | |
| LAMTOR4 | SNV | Missense_Mutation | novel | c.203N>G | p.Val68Gly | p.V68G | Q0VGL1 | protein_coding | deleterious(0.01) | benign(0.022) | TCGA-BS-A0UV-01 | Endometrium | uterine corpus endometrioid carcinoma | Female | <65 | III/IV | Unknown | Unknown | SD |
| LAMTOR4 | SNV | Missense_Mutation | c.248N>T | p.Arg83Met | p.R83M | Q0VGL1 | protein_coding | deleterious(0) | benign(0.416) | TCGA-D1-A103-01 | Endometrium | uterine corpus endometrioid carcinoma | Female | >=65 | I/II | Unknown | Unknown | SD |
| Page: 1 |
Top |
Related drugs of malignant transformation related genes |
| Identification of chemicals and drugs interact with genes involved in malignant transfromation |
| (DGIdb 4.0) |
| Entrez ID | Symbol | Category | Interaction Types | Drug Claim Name | Drug Name | PMIDs |
| Page: 1 |

Copyright 2023-Present -The University of Texas Health Science Center at Houston |