
|
|||||
|
 | |
| |
| |
| |
| |
| |
|
Gene: L3MBTL2 |
Gene summary for L3MBTL2 |
| Gene information | Species | Human | Gene symbol | L3MBTL2 | Gene ID | 83746 |
| Gene name | L3MBTL histone methyl-lysine binding protein 2 | |
| Gene Alias | H-l(3)mbt-l | |
| Cytomap | 22q13.2 | |
| Gene Type | protein-coding | GO ID | GO:0006139 | UniProtAcc | A0A0S2Z5X6 |
Top |
Malignant transformation analysis |
| Identification of the aberrant gene expression in precancerous and cancerous lesions by comparing the gene expression of stem-like cells in diseased tissues with normal stem cells |
| Entrez ID | Symbol | Replicates | Species | Organ | Tissue | Adj P-value | Log2FC | Malignancy |
| 83746 | L3MBTL2 | P26T-E | Human | Esophagus | ESCC | 3.89e-12 | 2.55e-01 | 0.1276 |
| 83746 | L3MBTL2 | P27T-E | Human | Esophagus | ESCC | 1.12e-09 | 1.73e-01 | 0.1055 |
| 83746 | L3MBTL2 | P28T-E | Human | Esophagus | ESCC | 4.44e-08 | 1.59e-01 | 0.1149 |
| 83746 | L3MBTL2 | P30T-E | Human | Esophagus | ESCC | 9.82e-15 | 4.96e-01 | 0.137 |
| 83746 | L3MBTL2 | P31T-E | Human | Esophagus | ESCC | 4.44e-08 | 1.42e-01 | 0.1251 |
| 83746 | L3MBTL2 | P32T-E | Human | Esophagus | ESCC | 1.76e-16 | 2.98e-01 | 0.1666 |
| 83746 | L3MBTL2 | P36T-E | Human | Esophagus | ESCC | 2.83e-10 | 2.64e-01 | 0.1187 |
| 83746 | L3MBTL2 | P37T-E | Human | Esophagus | ESCC | 4.58e-10 | 1.94e-01 | 0.1371 |
| 83746 | L3MBTL2 | P39T-E | Human | Esophagus | ESCC | 9.56e-08 | 1.35e-01 | 0.0894 |
| 83746 | L3MBTL2 | P40T-E | Human | Esophagus | ESCC | 9.27e-07 | 1.83e-01 | 0.109 |
| 83746 | L3MBTL2 | P42T-E | Human | Esophagus | ESCC | 4.03e-09 | 2.38e-01 | 0.1175 |
| 83746 | L3MBTL2 | P44T-E | Human | Esophagus | ESCC | 9.66e-05 | 1.53e-01 | 0.1096 |
| 83746 | L3MBTL2 | P47T-E | Human | Esophagus | ESCC | 2.46e-12 | 1.51e-01 | 0.1067 |
| 83746 | L3MBTL2 | P48T-E | Human | Esophagus | ESCC | 4.40e-09 | 1.48e-01 | 0.0959 |
| 83746 | L3MBTL2 | P49T-E | Human | Esophagus | ESCC | 4.28e-04 | 5.26e-01 | 0.1768 |
| 83746 | L3MBTL2 | P52T-E | Human | Esophagus | ESCC | 3.33e-21 | 3.48e-01 | 0.1555 |
| 83746 | L3MBTL2 | P54T-E | Human | Esophagus | ESCC | 8.96e-05 | 1.44e-01 | 0.0975 |
| 83746 | L3MBTL2 | P56T-E | Human | Esophagus | ESCC | 3.11e-04 | 6.18e-01 | 0.1613 |
| 83746 | L3MBTL2 | P57T-E | Human | Esophagus | ESCC | 2.02e-06 | 1.44e-01 | 0.0926 |
| 83746 | L3MBTL2 | P61T-E | Human | Esophagus | ESCC | 1.11e-15 | 3.42e-01 | 0.099 |
| Page: 1 2 3 |
| Tissue | Expression Dynamics | Abbreviation |
| Esophagus | 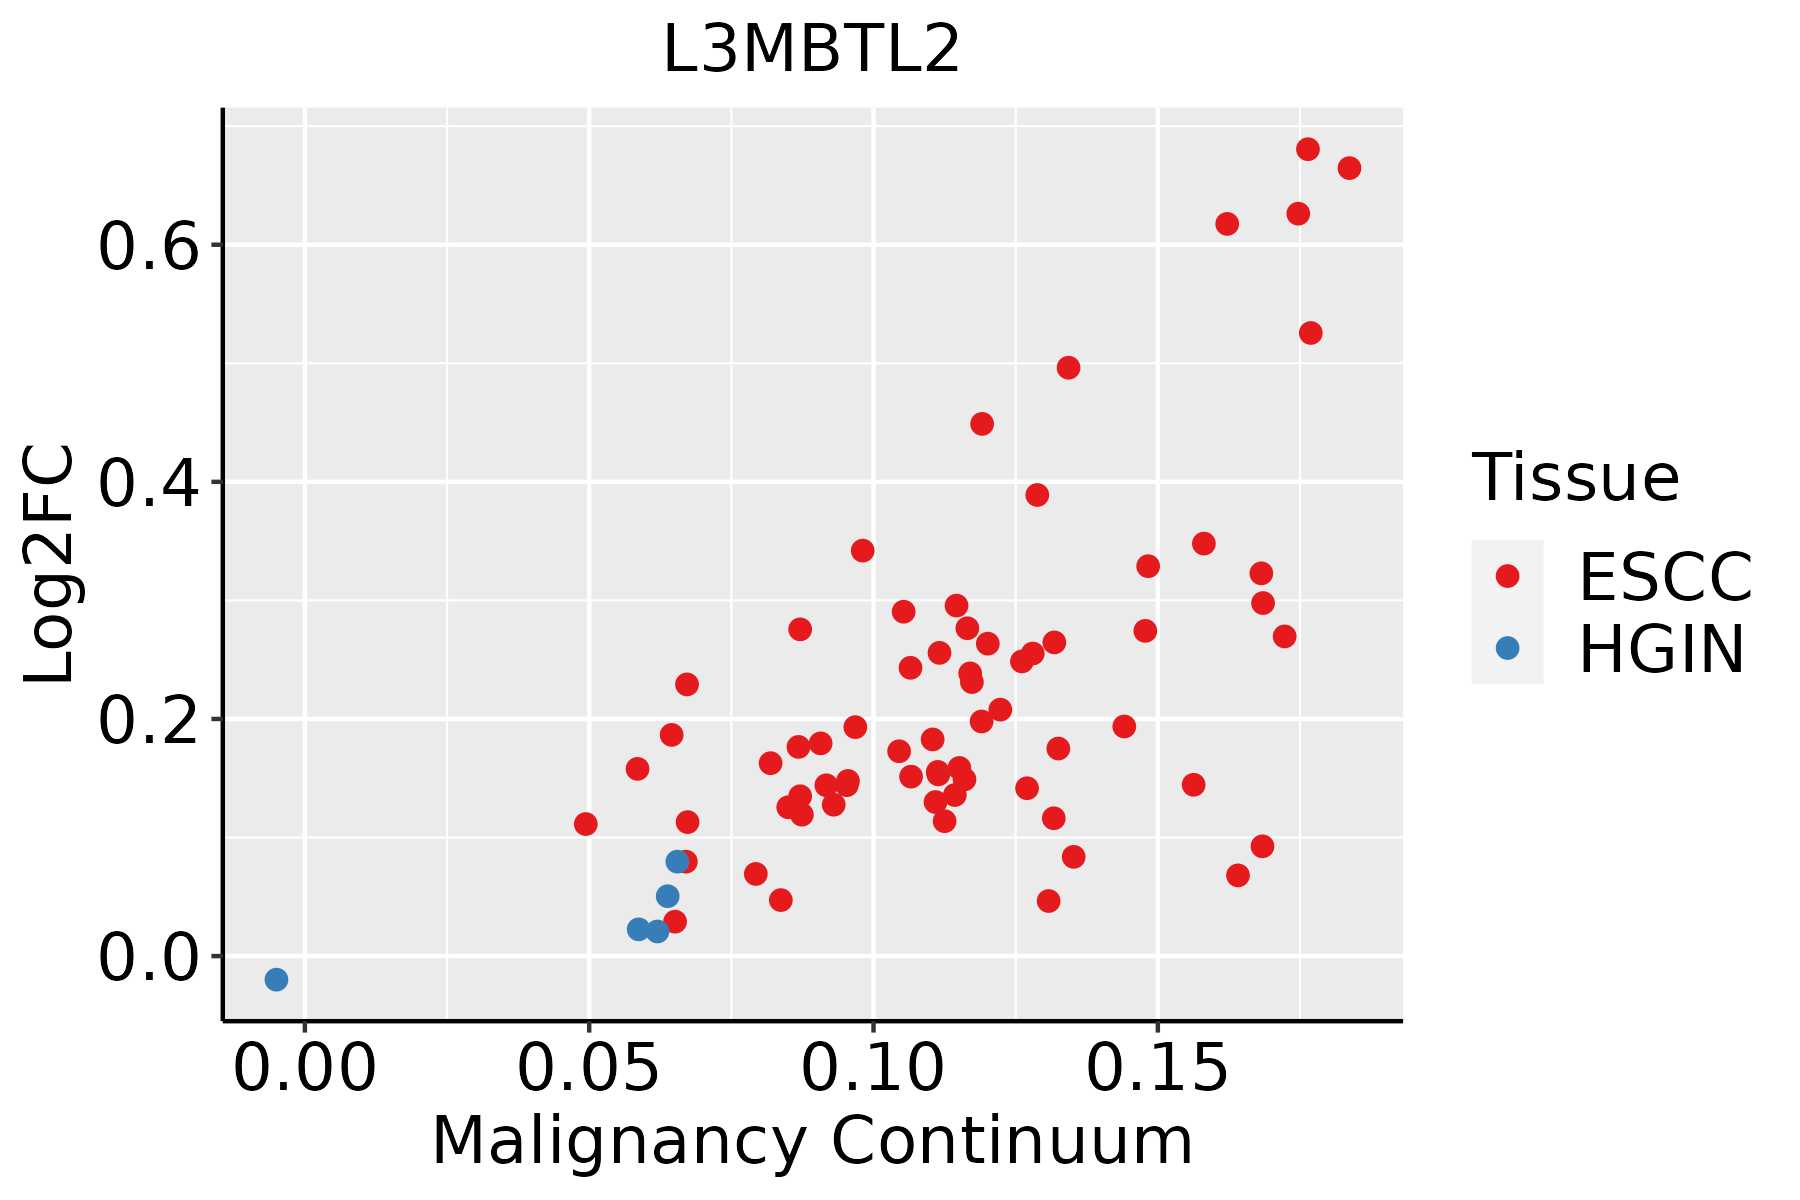 | ESCC: Esophageal squamous cell carcinoma |
| HGIN: High-grade intraepithelial neoplasias | ||
| LGIN: Low-grade intraepithelial neoplasias |
| ∗log2FC in expression of this searched gene in stem-like cells from each diseased tissue sample relative to stem-like cells in normal samples in each tissue plotted against the malignancy continuum. Samples are colored based on if they are from different disease stage. |
Top |
Malignant transformation related pathway analysis |
| Find out the enriched GO biological processes and KEGG pathways involved in transition from healthy to precancer to cancer |
| Tissue | Disease Stage | Enriched GO biological Processes |
| Colorectum | AD |  |
| Colorectum | SER |  |
| Colorectum | MSS |  |
| Colorectum | MSI-H |  |
| Colorectum | FAP |  |
| ∗Top 15 enriched GO BP terms are showed in the bar plot of each disease state in each tissue. Each row represents a significant GO biological process which is colored according to the -log10(p.adjust). |
| Page: 1 2 3 4 5 6 7 8 9 |
| GO ID | Tissue | Disease Stage | Description | Gene Ratio | Bg Ratio | pvalue | p.adjust | Count |
| GO:000632517 | Esophagus | ESCC | chromatin organization | 240/8552 | 409/18723 | 6.52e-08 | 1.14e-06 | 240 |
| Page: 1 |
| Pathway ID | Tissue | Disease Stage | Description | Gene Ratio | Bg Ratio | pvalue | p.adjust | qvalue | Count |
| Page: 1 |
Top |
Cell-cell communication analysis |
| Identification of potential cell-cell interactions between two cell types and their ligand-receptor pairs for different disease states |
| Ligand | Receptor | LRpair | Pathway | Tissue | Disease Stage |
| Page: 1 |
Top |
Single-cell gene regulatory network inference analysis |
| Find out the significant the regulons (TFs) and the target genes of each regulon across cell types for different disease states |
| TF | Cell Type | Tissue | Disease Stage | Target Gene | RSS | Regulon Activity |
| ∗The dot plots of a searched regulon are shown for all cell subpopulations in each disease state of each tissue based on the regulon specific score inferred using pySCENIC and by calculating the average expression. |
| Page: 1 |
Top |
Somatic mutation of malignant transformation related genes |
| Annotation of somatic variants for genes involved in malignant transformation |
| Hugo Symbol | Variant Class | Variant Classification | dbSNP RS | HGVSc | HGVSp | HGVSp Short | SWISSPROT | BIOTYPE | SIFT | PolyPhen | Tumor Sample Barcode | Tissue | Histology | Sex | Age | Stage | Therapy Types | Drugs | Outcome |
| L3MBTL2 | SNV | Missense_Mutation | rs200870155 | c.905N>G | p.Val302Gly | p.V302G | Q969R5 | protein_coding | deleterious(0) | possibly_damaging(0.76) | TCGA-AC-A23H-01 | Breast | breast invasive carcinoma | Female | >=65 | I/II | Unknown | Unknown | PD |
| L3MBTL2 | SNV | Missense_Mutation | novel | c.373G>A | p.Ala125Thr | p.A125T | Q969R5 | protein_coding | tolerated(0.08) | benign(0.418) | TCGA-AN-A04A-01 | Breast | breast invasive carcinoma | Female | <65 | III/IV | Unknown | Unknown | SD |
| L3MBTL2 | SNV | Missense_Mutation | rs781625142 | c.1670N>T | p.Thr557Met | p.T557M | Q969R5 | protein_coding | deleterious(0) | probably_damaging(0.989) | TCGA-AO-A0J4-01 | Breast | breast invasive carcinoma | Female | <65 | I/II | Chemotherapy | doxorubicin | SD |
| L3MBTL2 | SNV | Missense_Mutation | rs200870155 | c.905N>G | p.Val302Gly | p.V302G | Q969R5 | protein_coding | deleterious(0) | possibly_damaging(0.76) | TCGA-AO-A12H-01 | Breast | breast invasive carcinoma | Female | >=65 | I/II | Hormone Therapy | arimidex | SD |
| L3MBTL2 | SNV | Missense_Mutation | rs200870155 | c.905T>G | p.Val302Gly | p.V302G | Q969R5 | protein_coding | deleterious(0) | possibly_damaging(0.76) | TCGA-AO-A1KS-01 | Breast | breast invasive carcinoma | Female | >=65 | I/II | Hormone Therapy | arimidex | SD |
| L3MBTL2 | SNV | Missense_Mutation | rs200870155 | c.905N>G | p.Val302Gly | p.V302G | Q969R5 | protein_coding | deleterious(0) | possibly_damaging(0.76) | TCGA-AQ-A1H3-01 | Breast | breast invasive carcinoma | Female | <65 | III/IV | Chemotherapy | adriamycin | SD |
| L3MBTL2 | SNV | Missense_Mutation | rs753075698 | c.175N>T | p.Arg59Trp | p.R59W | Q969R5 | protein_coding | deleterious(0.01) | probably_damaging(0.985) | TCGA-BH-A0DL-01 | Breast | breast invasive carcinoma | Female | <65 | I/II | Chemotherapy | cytoxan | CR |
| L3MBTL2 | SNV | Missense_Mutation | rs200870155 | c.905T>G | p.Val302Gly | p.V302G | Q969R5 | protein_coding | deleterious(0) | possibly_damaging(0.76) | TCGA-E9-A227-01 | Breast | breast invasive carcinoma | Female | <65 | I/II | Chemotherapy | taxotere | CR |
| L3MBTL2 | SNV | Missense_Mutation | c.169G>A | p.Glu57Lys | p.E57K | Q969R5 | protein_coding | tolerated(0.67) | benign(0.037) | TCGA-Q1-A6DT-01 | Cervix | cervical & endocervical cancer | Female | <65 | I/II | Unknown | Unknown | PD | |
| L3MBTL2 | SNV | Missense_Mutation | rs555547448 | c.1564N>A | p.Ala522Thr | p.A522T | Q969R5 | protein_coding | deleterious(0) | possibly_damaging(0.869) | TCGA-A6-2672-01 | Colorectum | colon adenocarcinoma | Female | >=65 | III/IV | Unknown | Unknown | SD |
| Page: 1 2 3 4 5 6 7 |
Top |
Related drugs of malignant transformation related genes |
| Identification of chemicals and drugs interact with genes involved in malignant transfromation |
| (DGIdb 4.0) |
| Entrez ID | Symbol | Category | Interaction Types | Drug Claim Name | Drug Name | PMIDs |
| Page: 1 |

Copyright 2023-Present -The University of Texas Health Science Center at Houston |