Schematic overview of the cellular and molecular mechanisms involved in the cancer progression, including the proposed cellular and molecular mechanisms in cancer cells trajectory. AT1: alveolar type 1 cells; AT2: alveolar type 2 cells; AAH: atypical adenomatous hyperplasia; AIS: adenocarcinoma in situ; MIA: minimally invasive adenocarcinoma; IA: invasive adenocarcinoma; EMT: epithelial-mesenchymal transition

Home

Download

Statistics

Help

Contact

Center for Computational Systems Medicine
leaf

Gene summary

leaf

Malignant transformation analysis

leaf

Malignant transformation related pathway analysis

leaf

Cell-cell communication analysis

leaf

Single-cell gene regulatory network inference analysis

leaf

Somatic mutation of malignant transformation related genes

leaf

Related drugs of malignant transformation related genes

Gene: KRTCAP2

Gene summary for KRTCAP2

check button Gene summary.

Gene informationSpeciesHuman
Gene symbol

KRTCAP2

Gene ID

200185

Gene namekeratinocyte associated protein 2
Gene AliasKCP2
Cytomap1q22
Gene Typeprotein-coding
GO ID

GO:0006464

UniProtAcc

Q8N6L1


Top

Malignant transformation analysis

check button Identification of the aberrant gene expression in precancerous and cancerous lesions by comparing the gene expression of stem-like cells in diseased tissues with normal stem cells
check button Malignant transformation involving gene list.
Entrez IDSymbolReplicatesSpeciesOrganTissueAdj P-valueLog2FCMalignancy
200185KRTCAP2NCCBC3HumanBreastDCIS2.13e-022.51e-020.1198
200185KRTCAP2NCCBC5HumanBreastDCIS1.00e-09-5.16e-020.2046
200185KRTCAP2P1HumanBreastIDC2.02e-15-4.11e-010.1527
200185KRTCAP2DCIS2HumanBreastDCIS2.09e-36-1.98e-010.0085
200185KRTCAP2CA_HPV_1HumanCervixCC2.33e-07-1.67e-010.0264
200185KRTCAP2HSIL_HPV_2HumanCervixHSIL_HPV1.25e-021.75e-010.0208
200185KRTCAP2CCI_1HumanCervixCC1.64e-10-6.51e-010.528
200185KRTCAP2CCI_2HumanCervixCC7.70e-05-5.86e-010.5249
200185KRTCAP2CCI_3HumanCervixCC4.90e-14-6.51e-010.516
200185KRTCAP2CCII_1HumanCervixCC6.06e-14-6.17e-010.3249
200185KRTCAP2sample3HumanCervixCC1.65e-165.14e-010.1387
200185KRTCAP2L1HumanCervixCC6.27e-076.79e-020.0802
200185KRTCAP2T3HumanCervixCC1.46e-265.07e-010.1389
200185KRTCAP2AEH-subject1HumanEndometriumAEH1.02e-06-1.40e-01-0.3059
200185KRTCAP2AEH-subject2HumanEndometriumAEH2.19e-06-2.23e-01-0.2525
200185KRTCAP2AEH-subject3HumanEndometriumAEH2.27e-11-1.79e-01-0.2576
200185KRTCAP2AEH-subject4HumanEndometriumAEH3.19e-09-3.15e-01-0.2657
200185KRTCAP2AEH-subject5HumanEndometriumAEH5.25e-07-7.74e-02-0.2953
200185KRTCAP2EEC-subject1HumanEndometriumEEC1.36e-12-1.86e-01-0.2682
200185KRTCAP2EEC-subject2HumanEndometriumEEC8.63e-12-2.64e-01-0.2607
Page: 1 2 3 4 5 6 7 8 9 10 11 12 13 14 

check button Transcriptomic changes along malignancy continuum.
TissueExpression DynamicsAbbreviation
BreastThe image shows the transcriptomic changes along malignancy continuum.log2FC in expression of this searched gene in stem-like cells from each diseased tissue sample relative to stem-like cells in normal samples in each tissue plotted against the malignancy continuum. Samples are colored based on if they are from different disease stage.
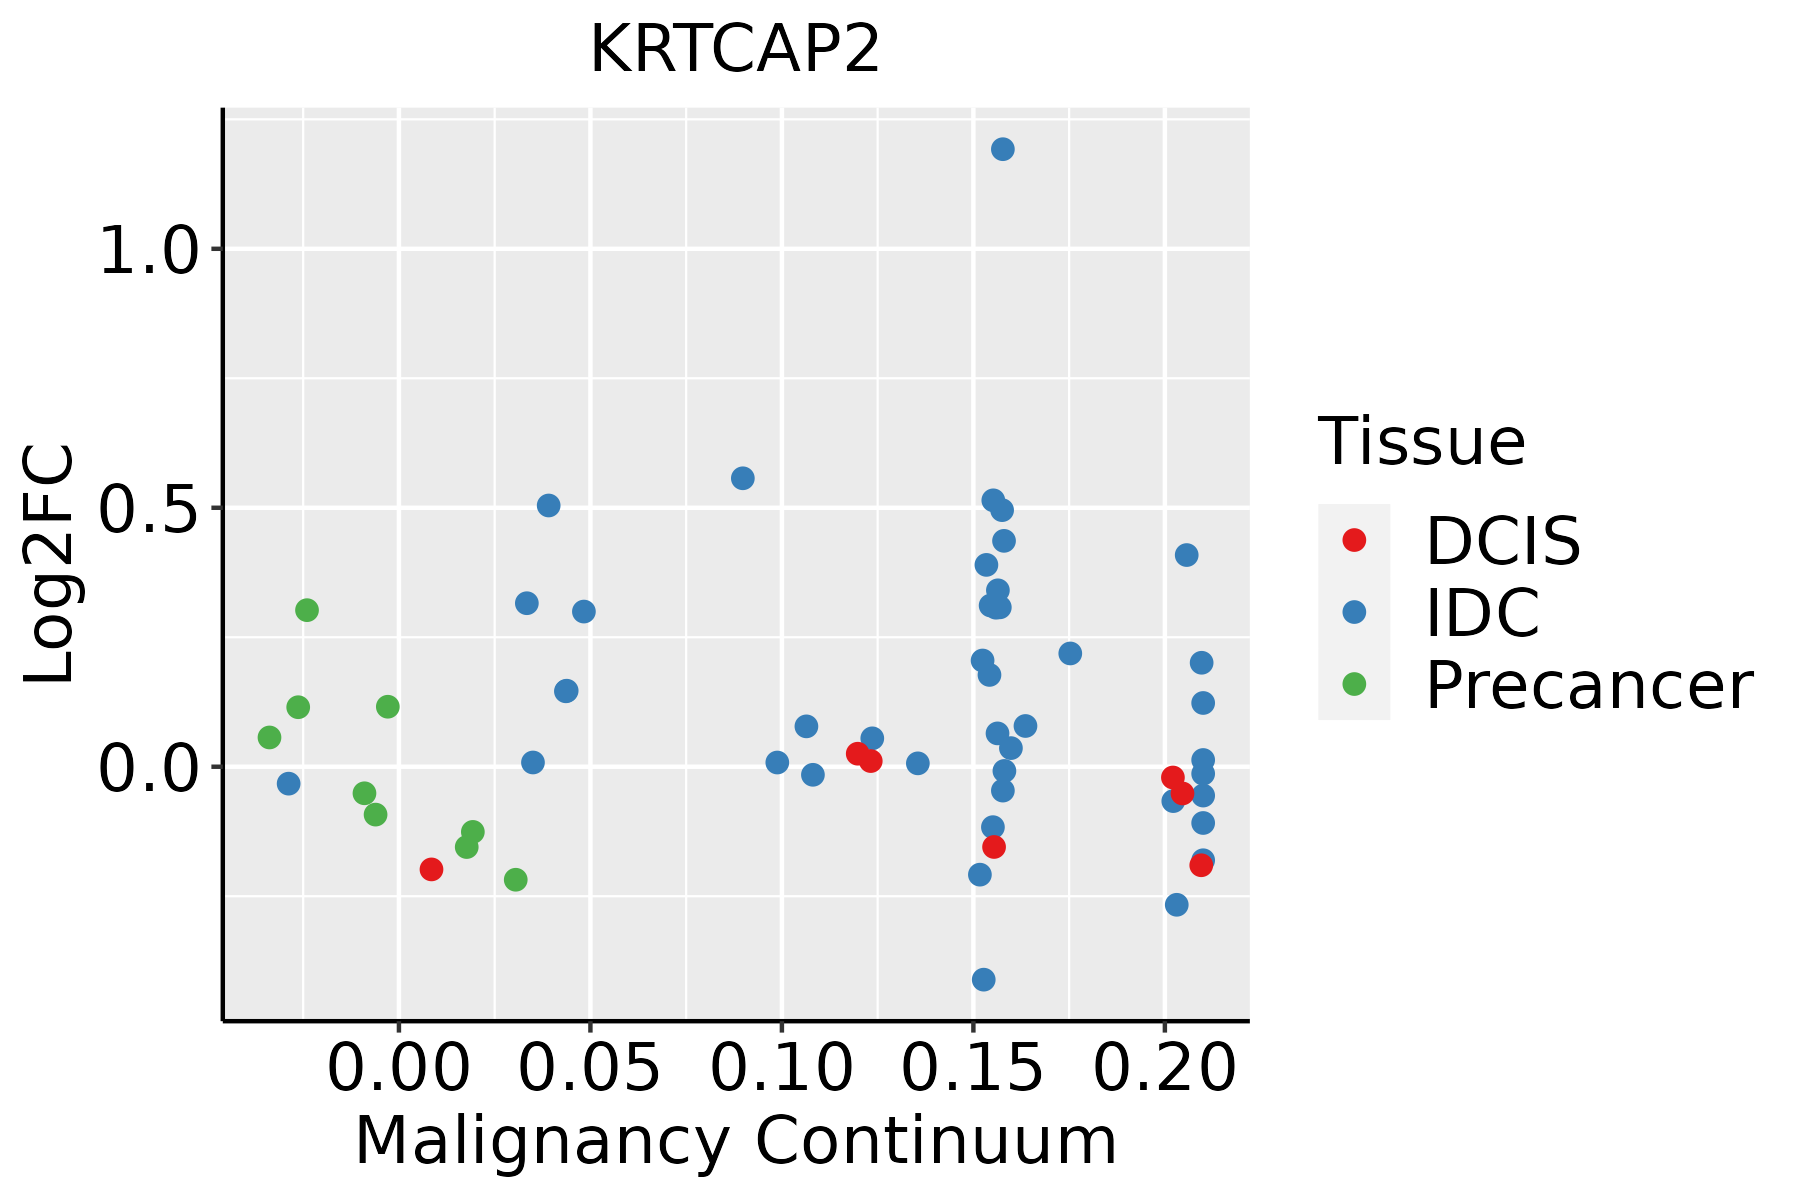
IDC: Invasive ductal carcinoma
DCIS: Ductal carcinoma in situ
Precancer(BRCA1-mut): Precancerous lesion from BRCA1 mutation carriers
CervixThe image shows the transcriptomic changes along malignancy continuum.log2FC in expression of this searched gene in stem-like cells from each diseased tissue sample relative to stem-like cells in normal samples in each tissue plotted against the malignancy continuum. Samples are colored based on if they are from different disease stage.CC: Cervix cancer
HSIL_HPV: HPV-infected high-grade squamous intraepithelial lesions
N_HPV: HPV-infected normal cervix
EndometriumThe image shows the transcriptomic changes along malignancy continuum.log2FC in expression of this searched gene in stem-like cells from each diseased tissue sample relative to stem-like cells in normal samples in each tissue plotted against the malignancy continuum. Samples are colored based on if they are from different disease stage.
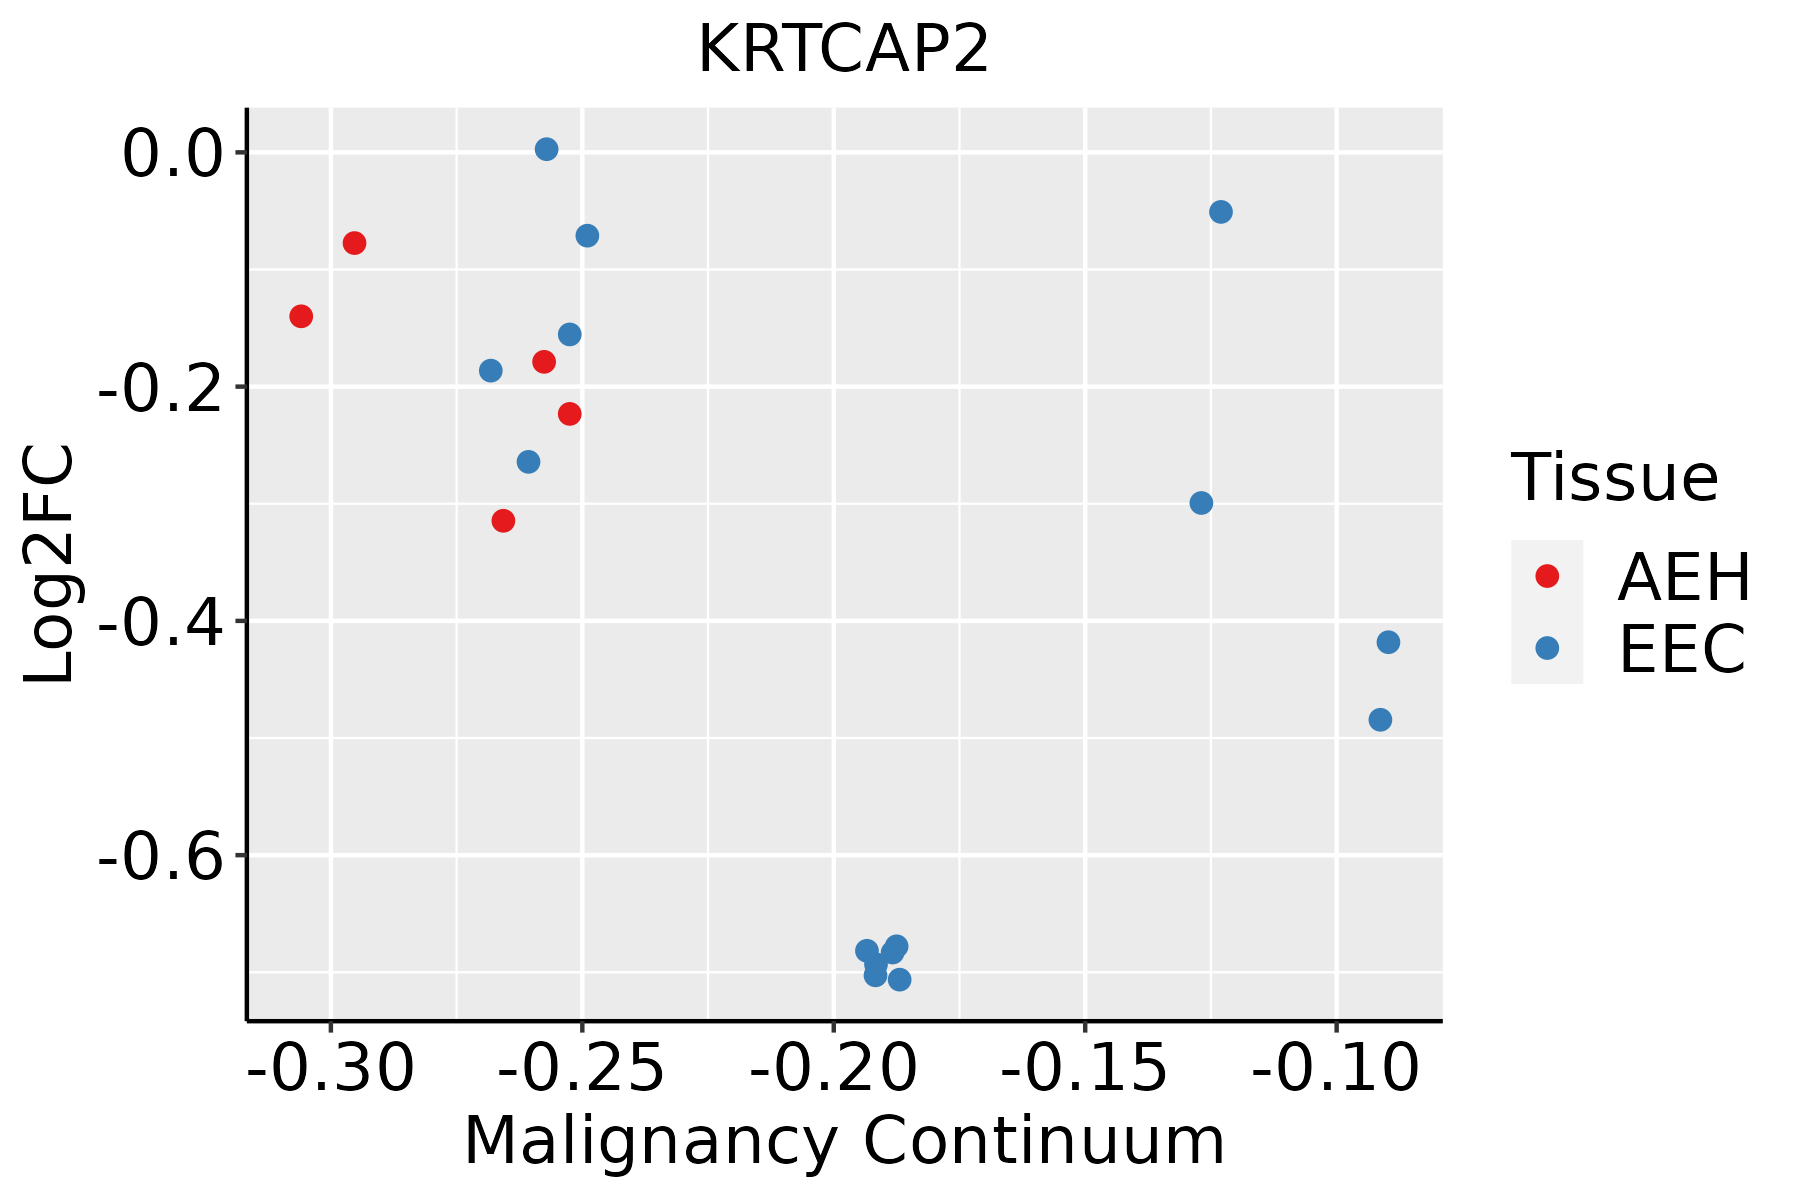
AEH: Atypical endometrial hyperplasia
EEC: Endometrioid Cancer
EsophagusThe image shows the transcriptomic changes along malignancy continuum.log2FC in expression of this searched gene in stem-like cells from each diseased tissue sample relative to stem-like cells in normal samples in each tissue plotted against the malignancy continuum. Samples are colored based on if they are from different disease stage.
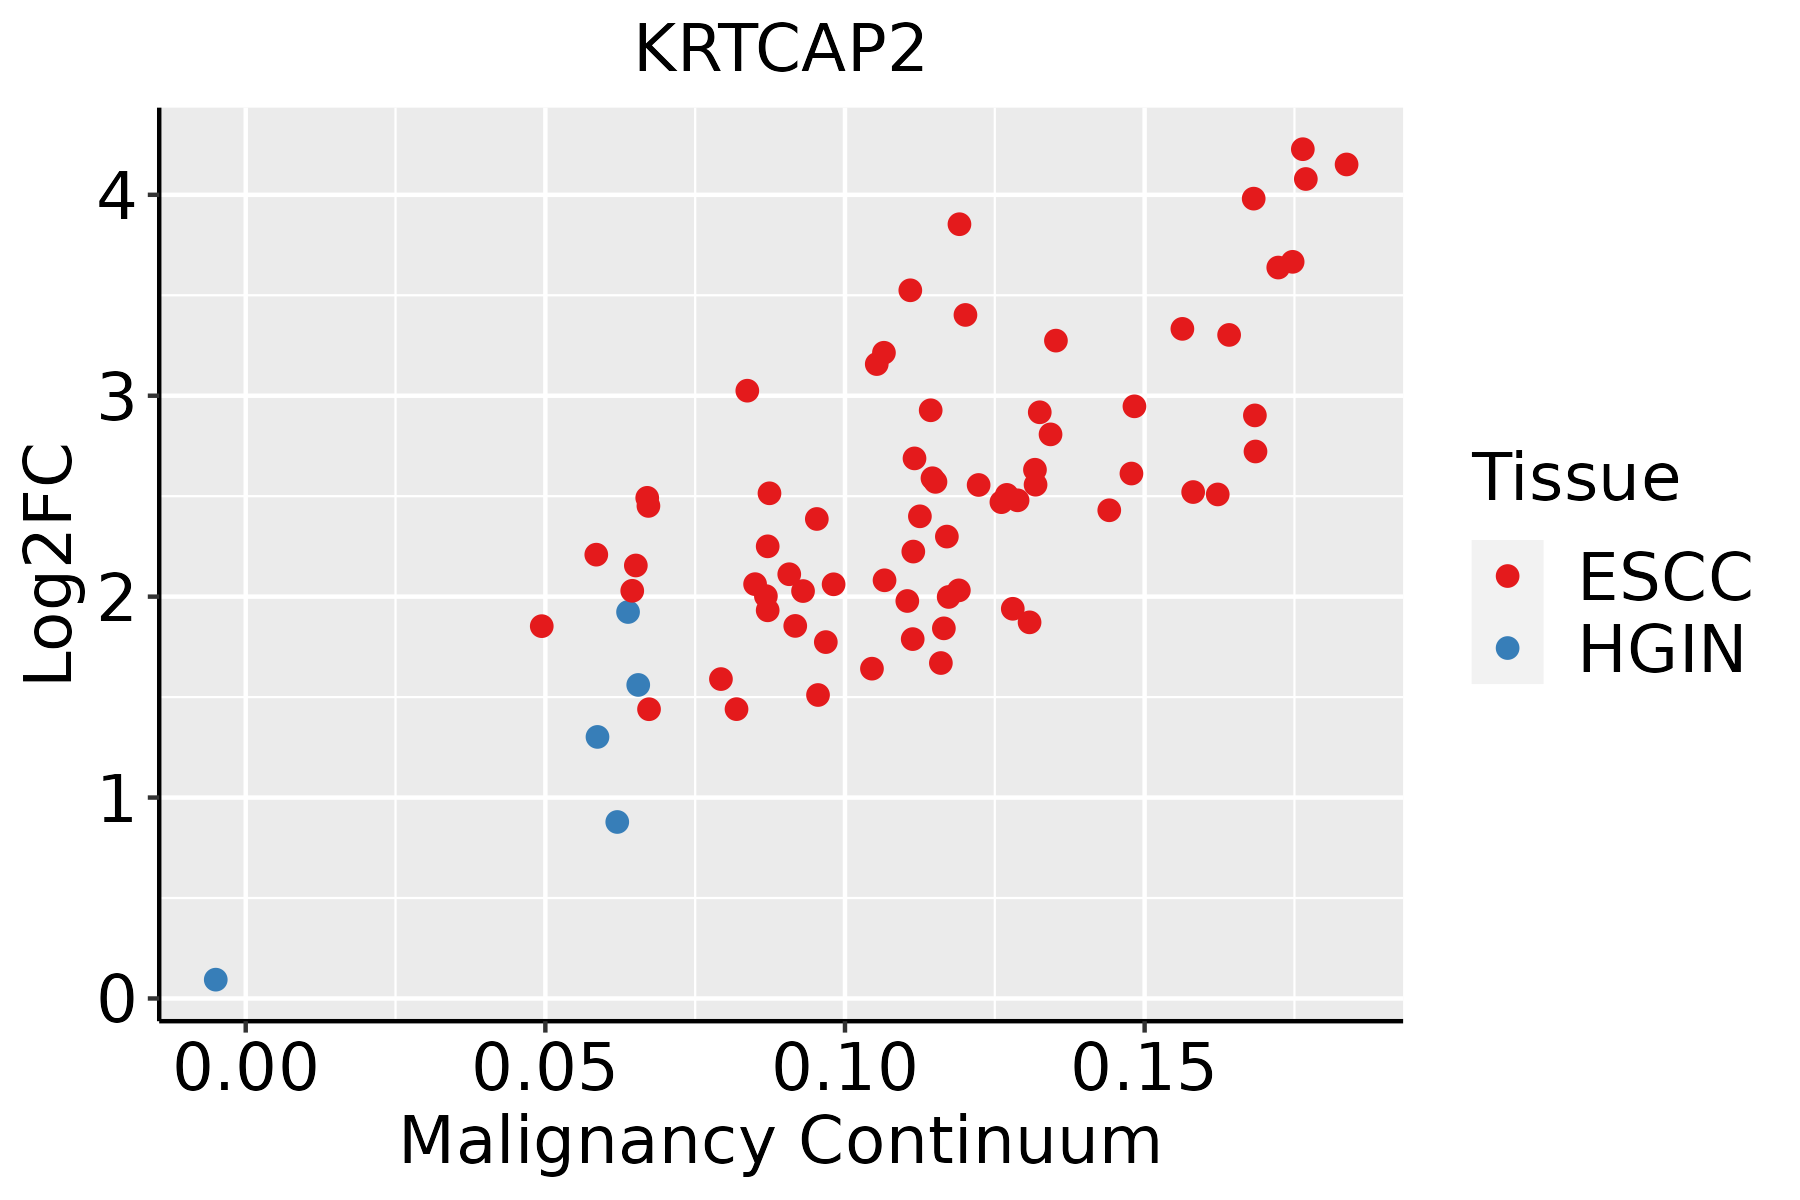
ESCC: Esophageal squamous cell carcinoma
HGIN: High-grade intraepithelial neoplasias
LGIN: Low-grade intraepithelial neoplasias
GCThe image shows the transcriptomic changes along malignancy continuum.log2FC in expression of this searched gene in stem-like cells from each diseased tissue sample relative to stem-like cells in normal samples in each tissue plotted against the malignancy continuum. Samples are colored based on if they are from different disease stage.
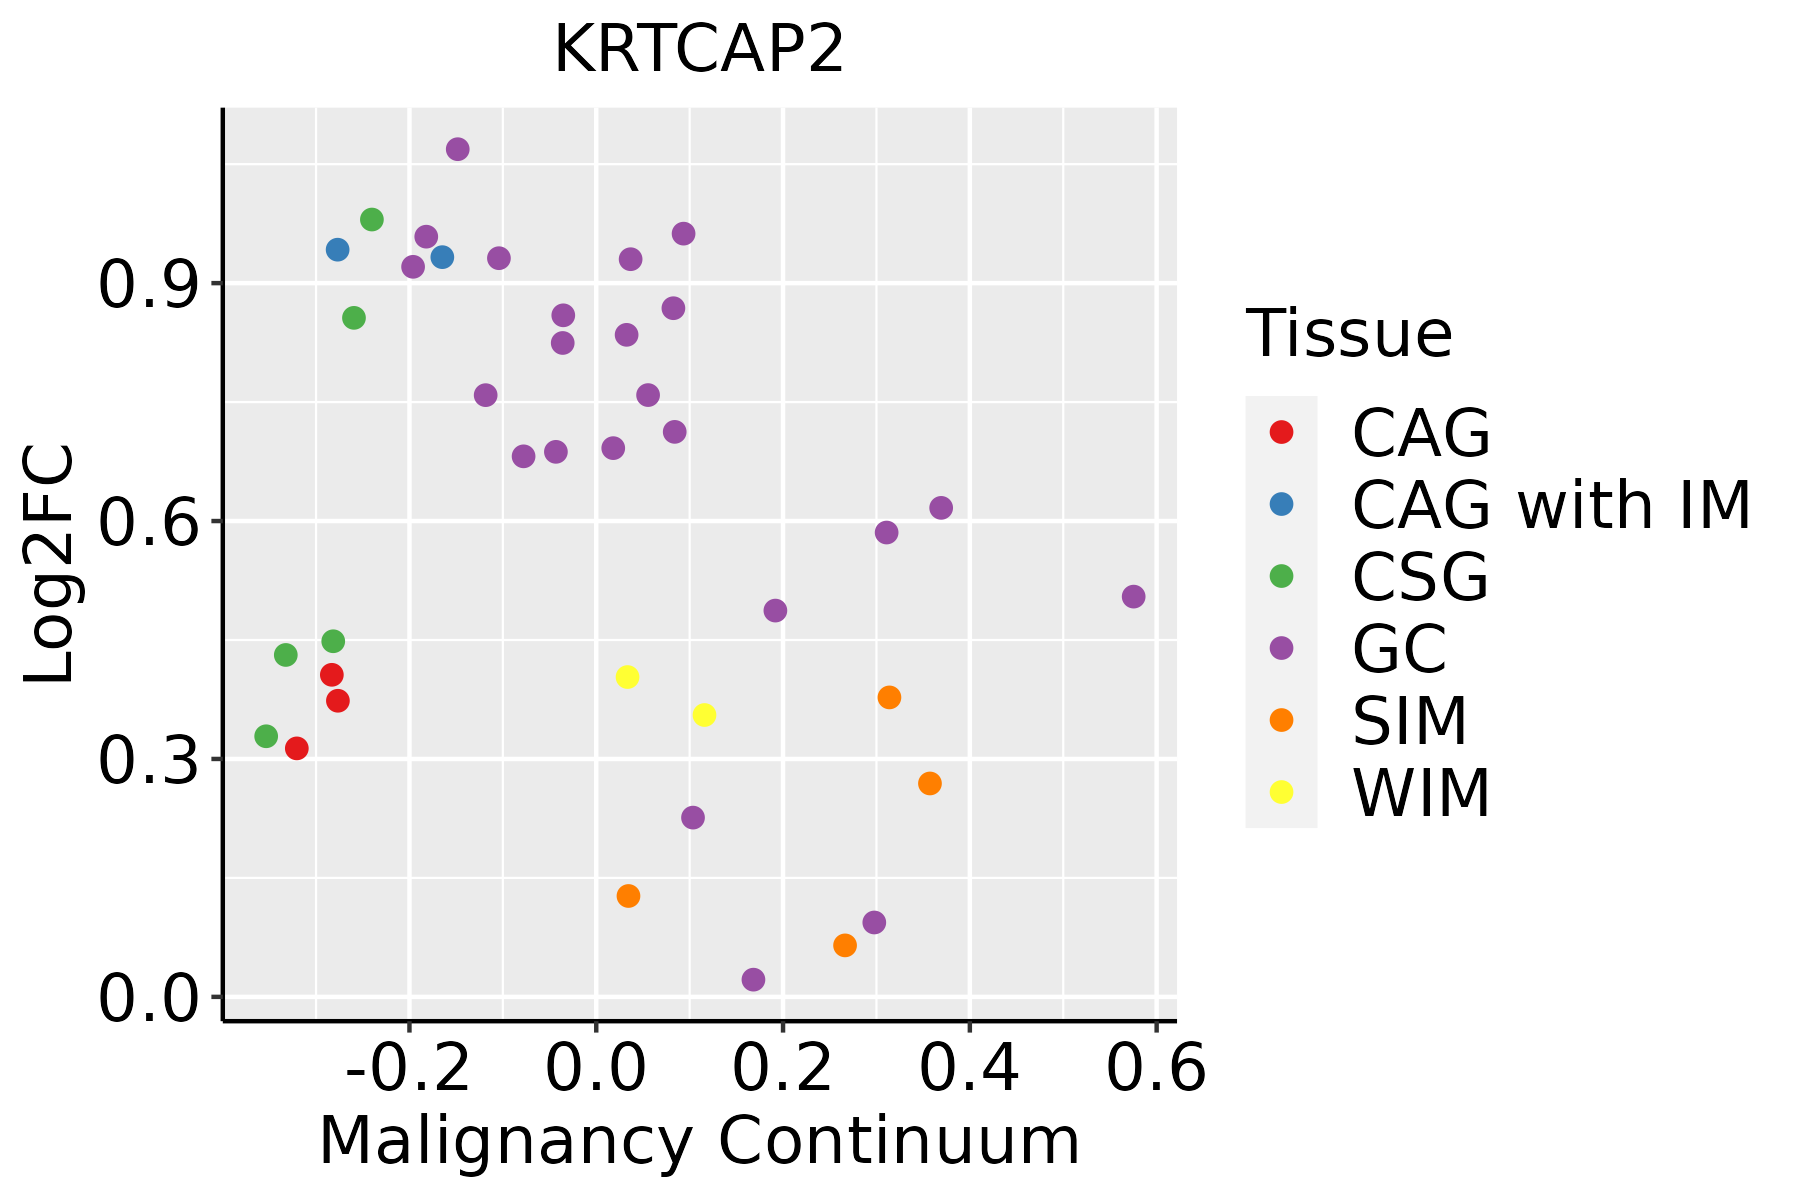
CAG: Chronic atrophic gastritis
CAG with IM: Chronic atrophic gastritis with intestinal metaplasia
CSG: Chronic superficial gastritis
GC: Gastric cancer
SIM: Severe intestinal metaplasia
WIM: Wild intestinal metaplasia
LiverThe image shows the transcriptomic changes along malignancy continuum.log2FC in expression of this searched gene in stem-like cells from each diseased tissue sample relative to stem-like cells in normal samples in each tissue plotted against the malignancy continuum. Samples are colored based on if they are from different disease stage.
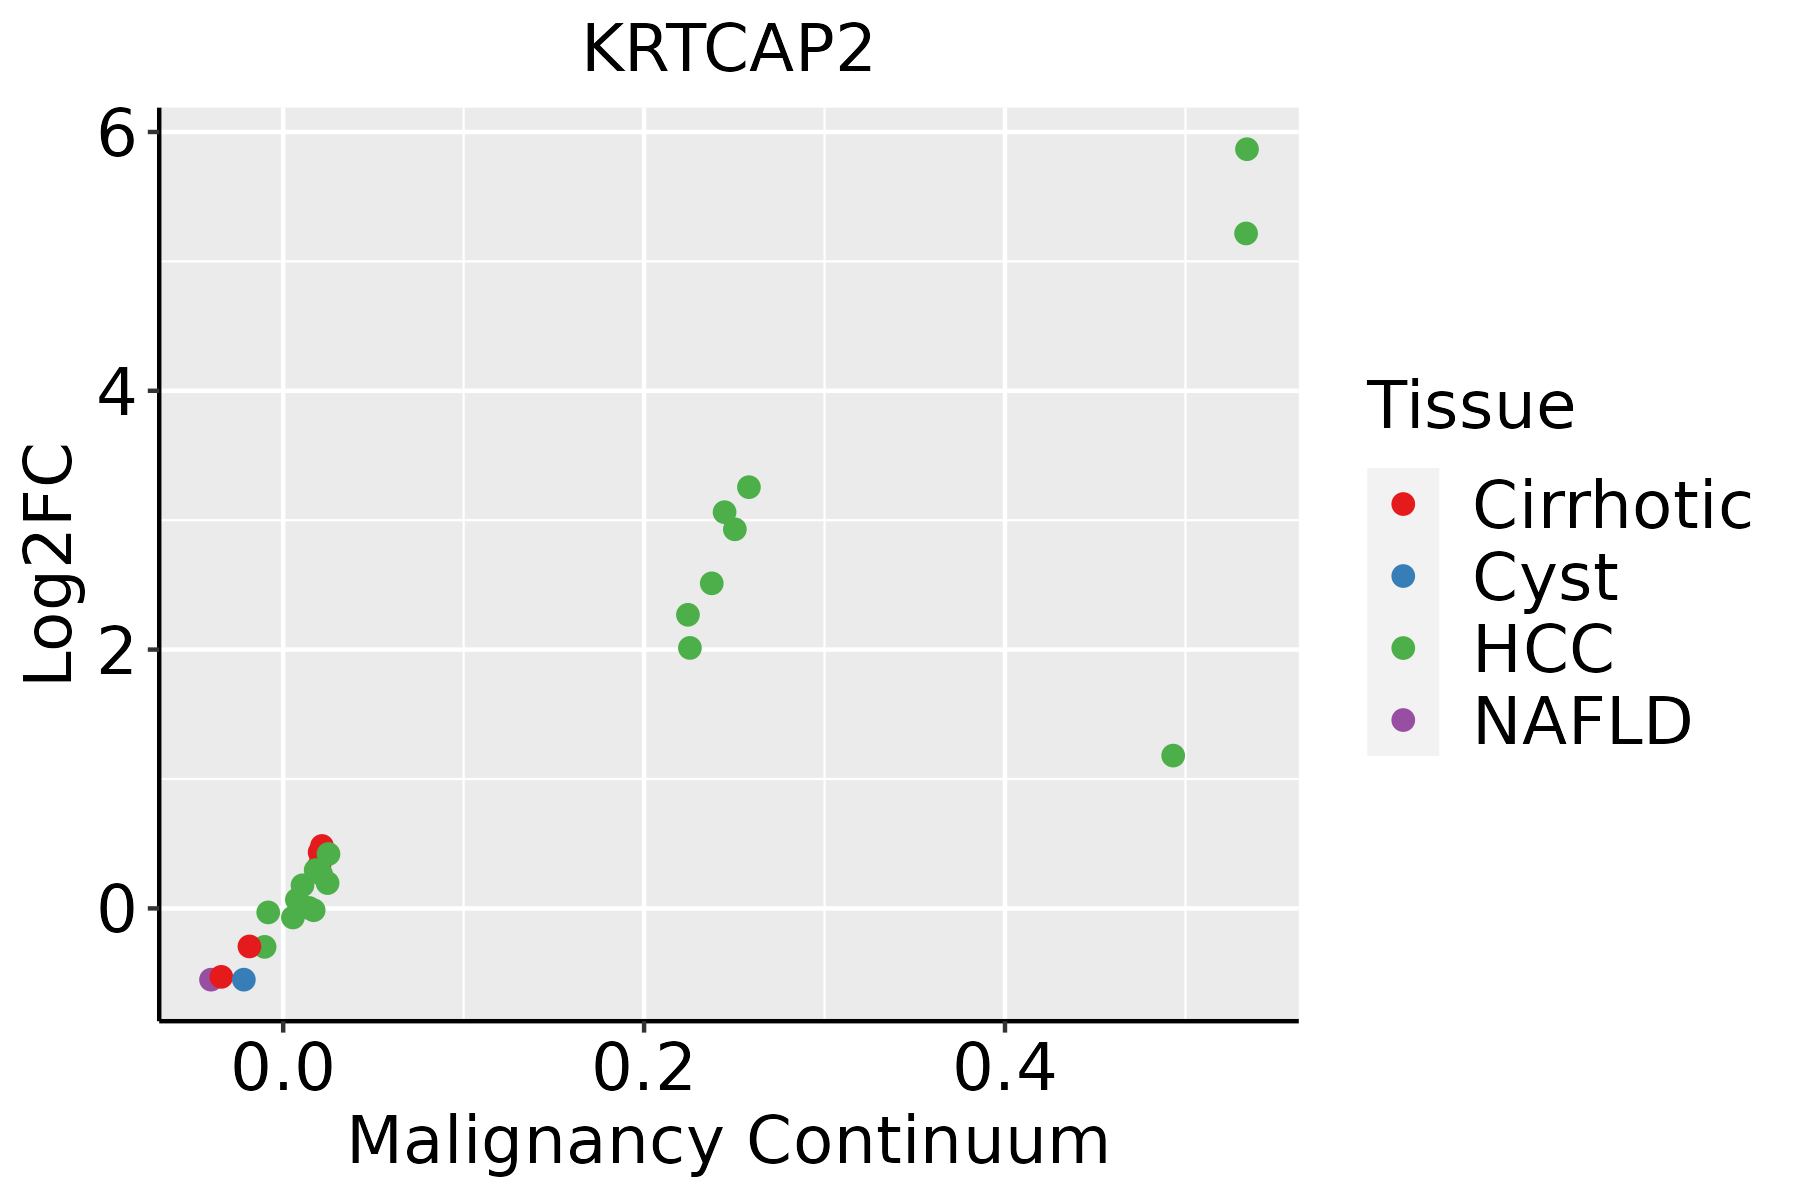
HCC: Hepatocellular carcinoma
NAFLD: Non-alcoholic fatty liver disease
LungThe image shows the transcriptomic changes along malignancy continuum.log2FC in expression of this searched gene in stem-like cells from each diseased tissue sample relative to stem-like cells in normal samples in each tissue plotted against the malignancy continuum. Samples are colored based on if they are from different disease stage.
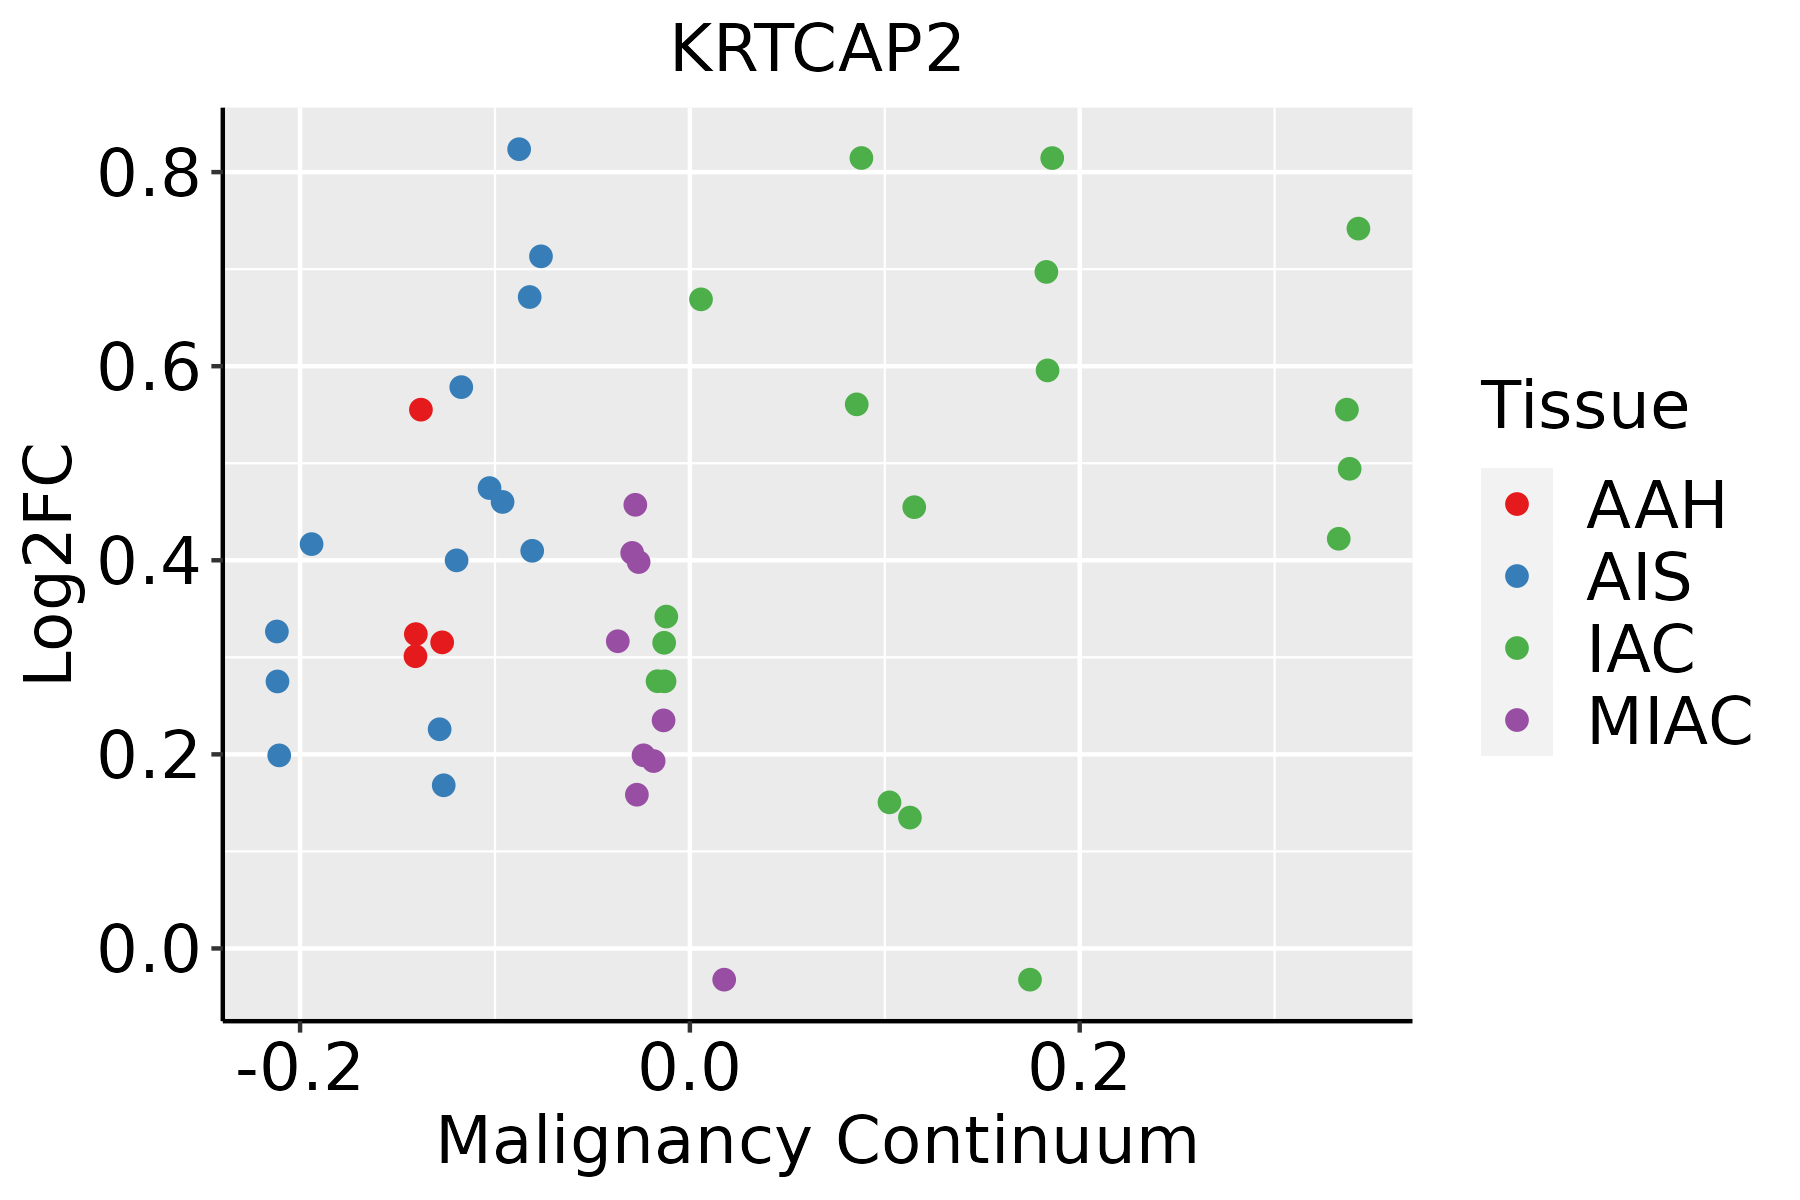
AAH: Atypical adenomatous hyperplasia
AIS: Adenocarcinoma in situ
IAC: Invasive lung adenocarcinoma
MIA: Minimally invasive adenocarcinoma
Oral CavityThe image shows the transcriptomic changes along malignancy continuum.log2FC in expression of this searched gene in stem-like cells from each diseased tissue sample relative to stem-like cells in normal samples in each tissue plotted against the malignancy continuum. Samples are colored based on if they are from different disease stage.
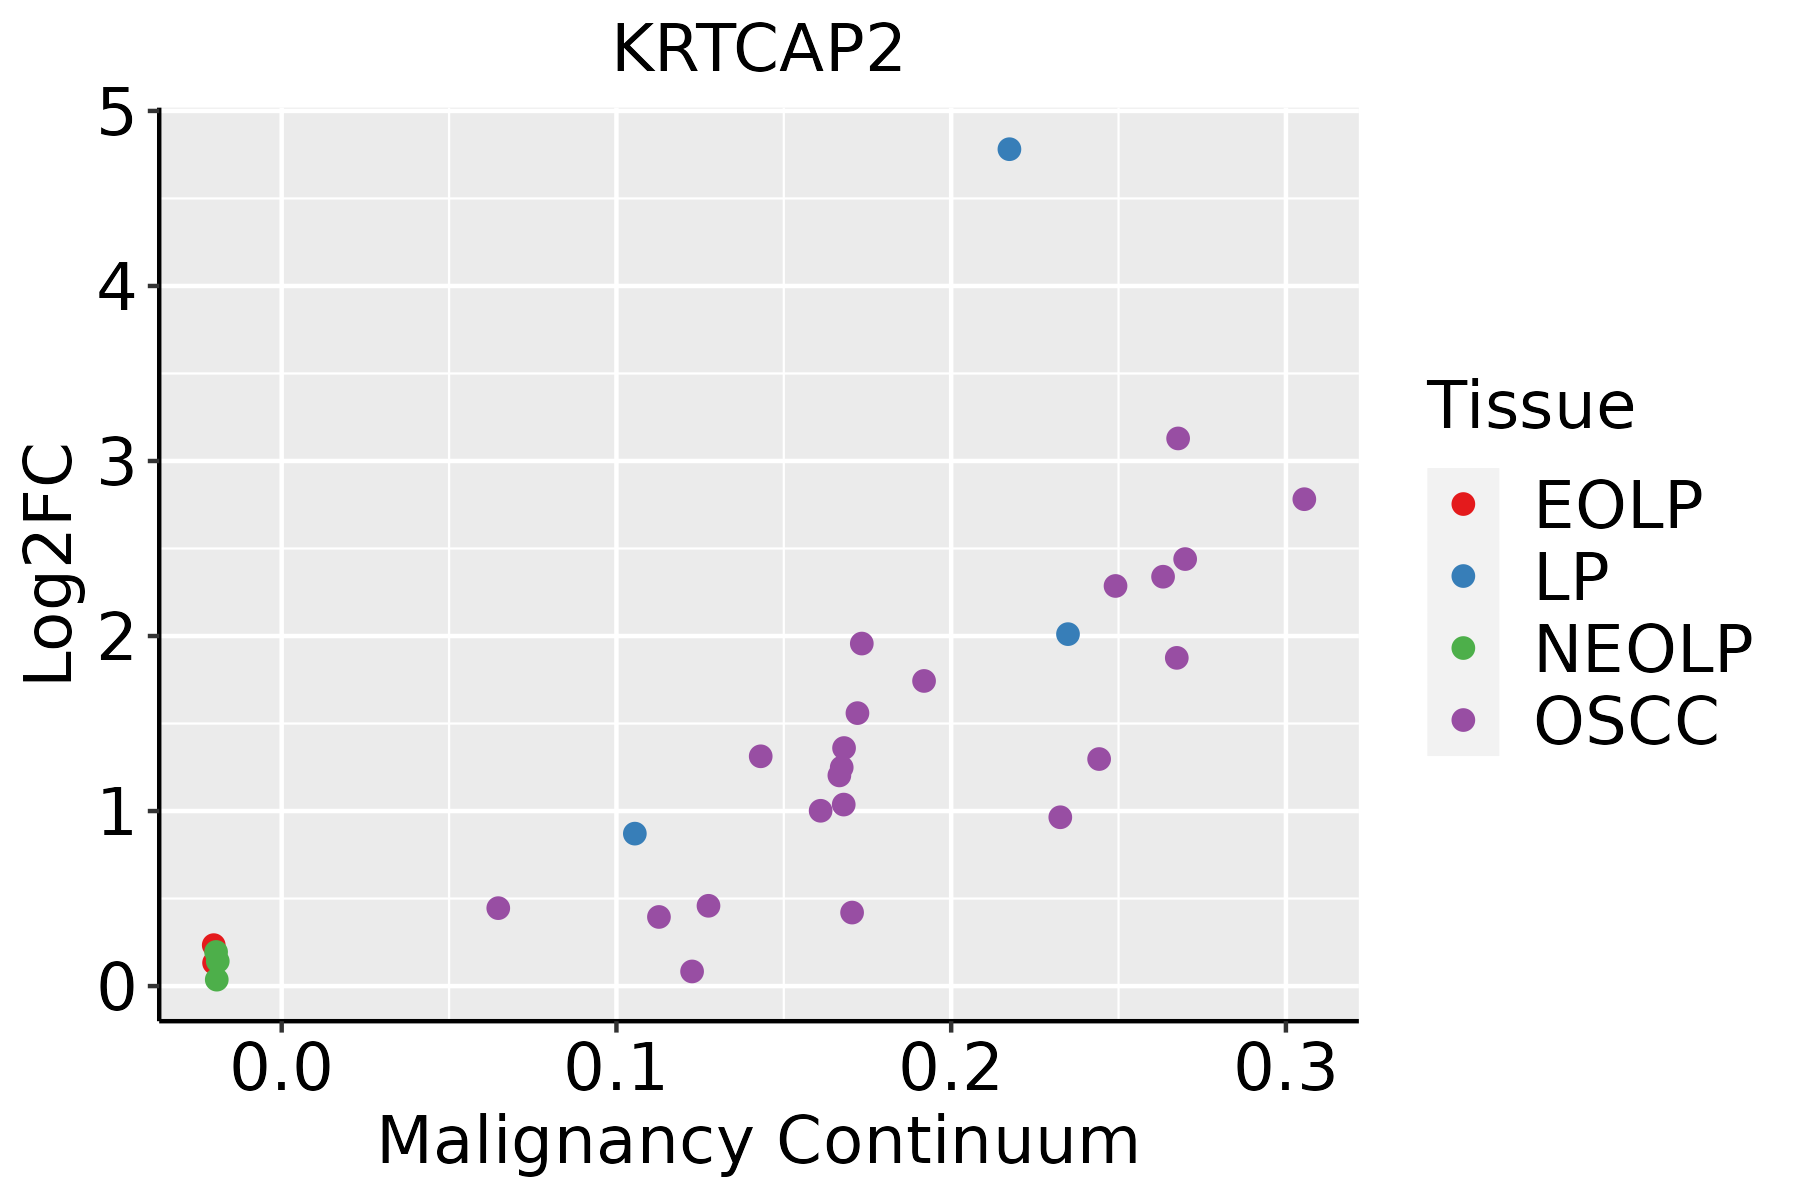
EOLP: Erosive Oral lichen planus
LP: leukoplakia
NEOLP: Non-erosive oral lichen planus
OSCC: Oral squamous cell carcinoma
ProstateThe image shows the transcriptomic changes along malignancy continuum.log2FC in expression of this searched gene in stem-like cells from each diseased tissue sample relative to stem-like cells in normal samples in each tissue plotted against the malignancy continuum. Samples are colored based on if they are from different disease stage.
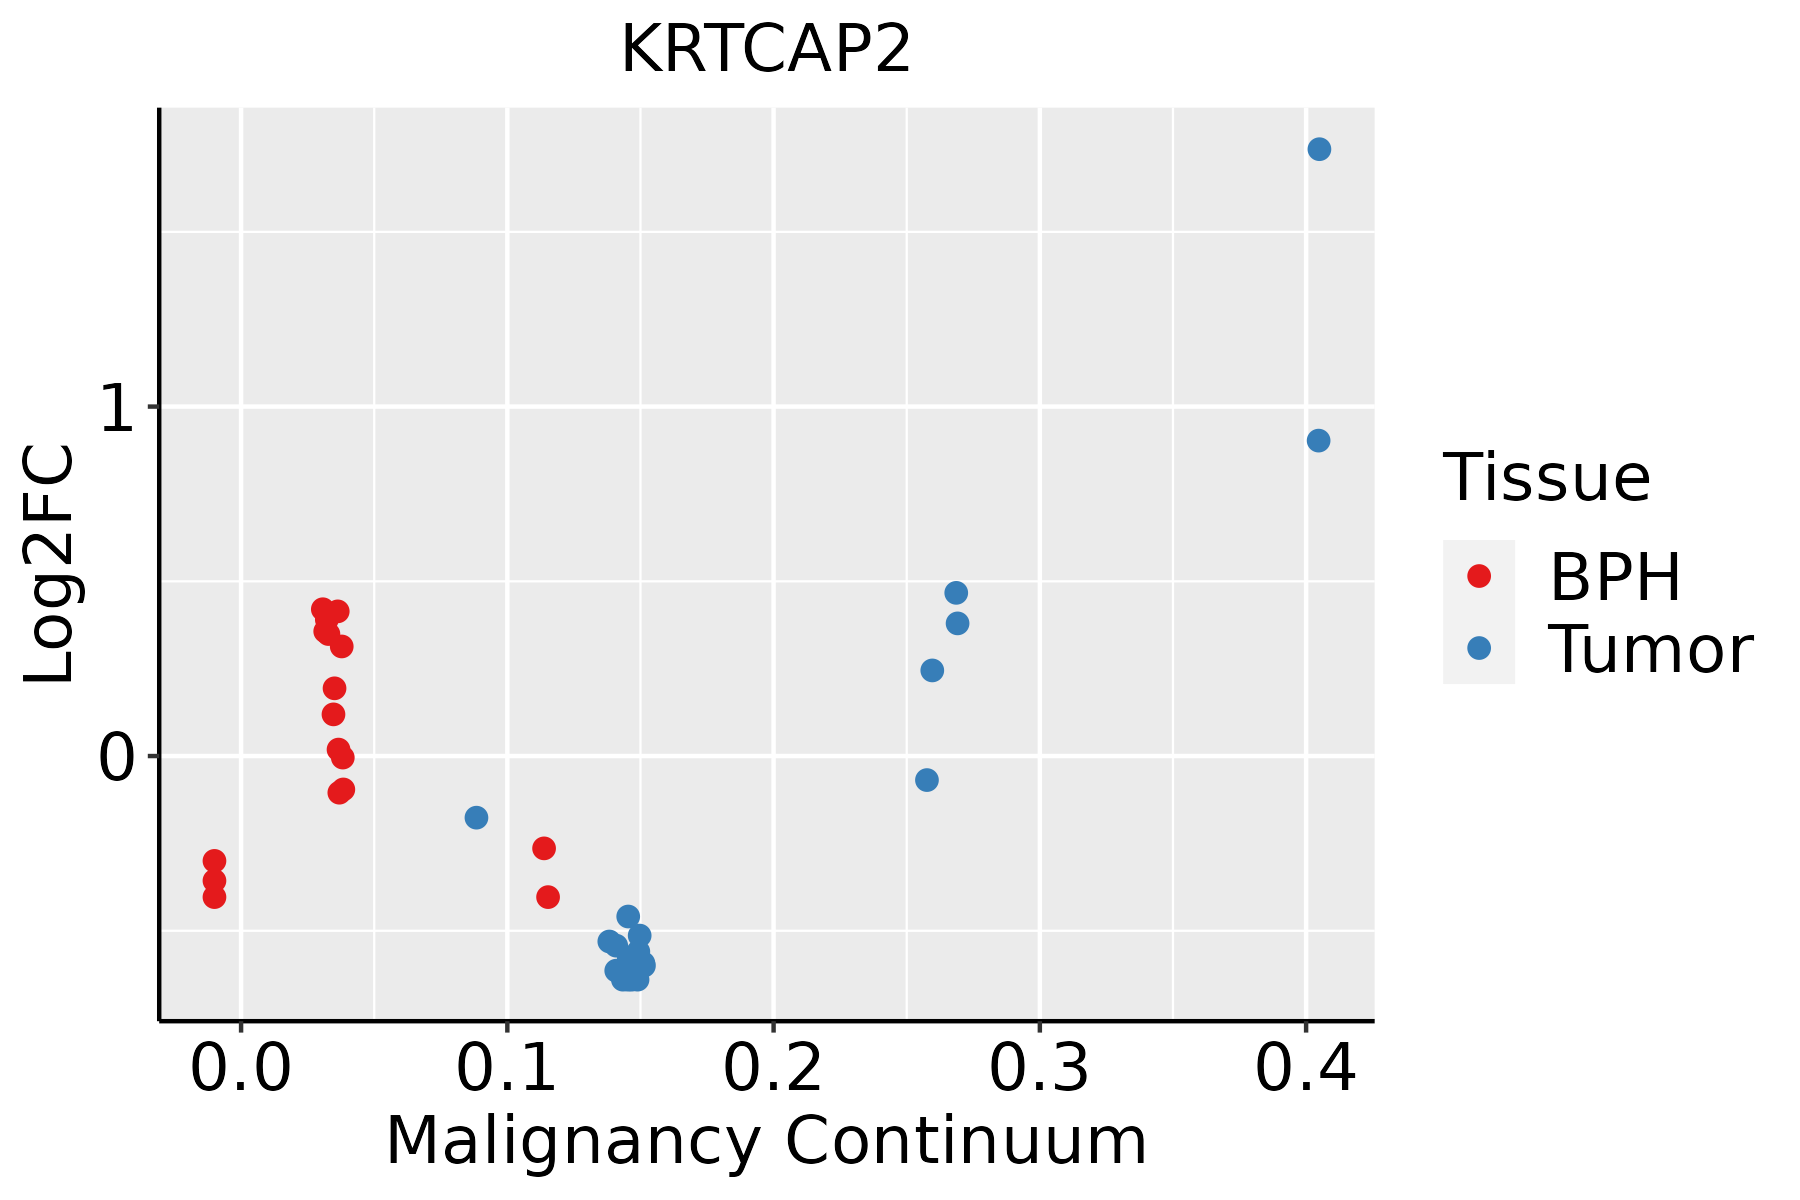
BPH: Benign Prostatic Hyperplasia
SkinThe image shows the transcriptomic changes along malignancy continuum.log2FC in expression of this searched gene in stem-like cells from each diseased tissue sample relative to stem-like cells in normal samples in each tissue plotted against the malignancy continuum. Samples are colored based on if they are from different disease stage.AK: Actinic keratosis
cSCC: Cutaneous squamous cell carcinoma
SCCIS:squamous cell carcinoma in situ
ThyroidThe image shows the transcriptomic changes along malignancy continuum.log2FC in expression of this searched gene in stem-like cells from each diseased tissue sample relative to stem-like cells in normal samples in each tissue plotted against the malignancy continuum. Samples are colored based on if they are from different disease stage.ATC: Anaplastic thyroid cancer
HT: Hashimoto's thyroiditis
PTC: Papillary thyroid cancer
∗log2FC in expression of this searched gene in stem-like cells from each diseased tissue sample relative to stem-like cells in normal samples in each tissue plotted against the malignancy continuum. Samples are colored based on if they are from different disease stage.

Top

Malignant transformation related pathway analysis

check buttonFind out the enriched GO biological processes and KEGG pathways involved in transition from healthy to precancer to cancer
check button Figure of enriched GO biological processes.
TissueDisease StageEnriched GO biological Processes
ColorectumADGO analysis - Figure of enriched GO biological processes: Top 15 enriched GO BP terms are showed in the bar plot of each disease state in each tissue. Each row represents a significant GO biological process which is colored according to the -log10(p.adjust).
ColorectumSERGO analysis - Figure of enriched GO biological processes: Top 15 enriched GO BP terms are showed in the bar plot of each disease state in each tissue. Each row represents a significant GO biological process which is colored according to the -log10(p.adjust).
ColorectumMSSGO analysis - Figure of enriched GO biological processes: Top 15 enriched GO BP terms are showed in the bar plot of each disease state in each tissue. Each row represents a significant GO biological process which is colored according to the -log10(p.adjust).
ColorectumMSI-HGO analysis - Figure of enriched GO biological processes: Top 15 enriched GO BP terms are showed in the bar plot of each disease state in each tissue. Each row represents a significant GO biological process which is colored according to the -log10(p.adjust).
ColorectumFAPGO analysis - Figure of enriched GO biological processes: Top 15 enriched GO BP terms are showed in the bar plot of each disease state in each tissue. Each row represents a significant GO biological process which is colored according to the -log10(p.adjust).
∗Top 15 enriched GO BP terms are showed in the bar plot of each disease state in each tissue. Each row represents a significant GO biological process which is colored according to the -log10(p.adjust).
Page: 1 2 3 4 5 6 7 8 9 

check button Enriched GO biological processes.
GO IDTissueDisease StageDescriptionGene RatioBg Ratiopvaluep.adjustCount
GO:00064876EsophagusHGINprotein N-linked glycosylation17/258765/187236.04e-034.87e-0217
GO:000648714EsophagusESCCprotein N-linked glycosylation51/855265/187236.41e-081.13e-0651
GO:00091002EsophagusESCCglycoprotein metabolic process226/8552387/187232.64e-073.94e-06226
GO:00700854EsophagusESCCglycosylation144/8552240/187235.12e-065.38e-05144
GO:00064865EsophagusESCCprotein glycosylation135/8552226/187231.36e-051.24e-04135
GO:00434135EsophagusESCCmacromolecule glycosylation135/8552226/187231.36e-051.24e-04135
GO:00091012EsophagusESCCglycoprotein biosynthetic process181/8552317/187232.54e-052.15e-04181
GO:00064873LiverCirrhoticprotein N-linked glycosylation30/463465/187231.40e-041.36e-0330
GO:000648711LiverHCCprotein N-linked glycosylation48/795865/187232.85e-075.00e-0648
GO:00064862LiverHCCprotein glycosylation122/7958226/187233.11e-042.21e-03122
GO:00434132LiverHCCmacromolecule glycosylation122/7958226/187233.11e-042.21e-03122
GO:00700852LiverHCCglycosylation128/7958240/187234.35e-042.92e-03128
GO:0009100LiverHCCglycoprotein metabolic process193/7958387/187231.89e-039.62e-03193
GO:00064863LungAISprotein glycosylation35/1849226/187234.93e-034.27e-0235
GO:00434133LungAISmacromolecule glycosylation35/1849226/187234.93e-034.27e-0235
GO:00064875Oral cavityOSCCprotein N-linked glycosylation44/730565/187232.63e-063.26e-0544
GO:00091001Oral cavityOSCCglycoprotein metabolic process185/7305387/187232.37e-041.54e-03185
GO:00091011Oral cavityOSCCglycoprotein biosynthetic process151/7305317/187231.01e-035.26e-03151
GO:00064864Oral cavityOSCCprotein glycosylation111/7305226/187231.22e-036.10e-03111
GO:00434134Oral cavityOSCCmacromolecule glycosylation111/7305226/187231.22e-036.10e-03111
Page: 1 2 

check button Enriched KEGG pathways.
Pathway IDTissueDisease StageDescriptionGene RatioBg Ratiopvaluep.adjustqvalueCount
Page: 1 

Top

Cell-cell communication analysis

check buttonIdentification of potential cell-cell interactions between two cell types and their ligand-receptor pairs for different disease states
LigandReceptorLRpairPathwayTissueDisease Stage
Page: 1 

Top

Single-cell gene regulatory network inference analysis

check buttonFind out the significant the regulons (TFs) and the target genes of each regulon across cell types for different disease states
TFCell TypeTissueDisease StageTarget GeneRSSRegulon Activity
∗The dot plots of a searched regulon are shown for all cell subpopulations in each disease state of each tissue based on the regulon specific score inferred using pySCENIC and by calculating the average expression.
Page: 1 

Top

Somatic mutation of malignant transformation related genes

check buttonAnnotation of somatic variants for genes involved in malignant transformation
Hugo SymbolVariant ClassVariant ClassificationdbSNP RSHGVScHGVSpHGVSp ShortSWISSPROTBIOTYPESIFTPolyPhenTumor Sample BarcodeTissueHistologySexAgeStageTherapy TypesDrugsOutcome
KRTCAP2insertionIn_Frame_Insnovelc.402_403insGCTATGGACTCACGTCTGCCTCCTGGAAGCCAGCGGCACCCTCCTp.Ile134_Asn135insAlaMetAspSerArgLeuProProGlySerGlnArgHisProProp.I134_N135insAMDSRLPPGSQRHPPQ8N6L1protein_codingTCGA-A2-A0EO-01Breastbreast invasive carcinomaFemale<65I/IIHormone TherapytamoxiphenSD
KRTCAP2insertionFrame_Shift_Insnovelc.365_366insTTGGp.Cys123TrpfsTer48p.C123Wfs*48Q8N6L1protein_codingTCGA-A8-A09E-01Breastbreast invasive carcinomaFemale>=65III/IVHormone TherapyanastrozoleSD
KRTCAP2SNVMissense_Mutationc.463N>Gp.Thr155Alap.T155AQ8N6L1protein_codingtolerated(0.26)benign(0.114)TCGA-AA-3713-01Colorectumcolon adenocarcinomaMale>=65III/IVChemotherapy5-fluorouracilPR
KRTCAP2SNVMissense_Mutationrs372181365c.350N>Ap.Arg117Glnp.R117QQ8N6L1protein_codingdeleterious(0)probably_damaging(0.997)TCGA-EI-6882-01Colorectumrectum adenocarcinomaMale<65I/IIUnknownUnknownSD
KRTCAP2SNVMissense_Mutationc.255G>Tp.Glu85Aspp.E85DQ8N6L1protein_codingdeleterious(0.01)probably_damaging(0.992)TCGA-AP-A056-01Endometriumuterine corpus endometrioid carcinomaFemale<65I/IIUnknownUnknownSD
KRTCAP2SNVMissense_Mutationc.482N>Tp.Arg161Ilep.R161IQ8N6L1protein_codingdeleterious(0)possibly_damaging(0.758)TCGA-AP-A0LM-01Endometriumuterine corpus endometrioid carcinomaFemale<65III/IVChemotherapycisplatinSD
KRTCAP2SNVMissense_Mutationc.482G>Ap.Arg161Lysp.R161KQ8N6L1protein_codingtolerated(0.43)benign(0.017)TCGA-B5-A0JY-01Endometriumuterine corpus endometrioid carcinomaFemale<65III/IVChemotherapydoxorubicinSD
KRTCAP2SNVMissense_Mutationrs768462233c.212N>Tp.Ser71Leup.S71LQ8N6L1protein_codingdeleterious(0)probably_damaging(0.998)TCGA-D1-A17B-01Endometriumuterine corpus endometrioid carcinomaFemale>=65I/IIUnknownUnknownSD
KRTCAP2SNVMissense_Mutationc.288N>Tp.Lys96Asnp.K96NQ8N6L1protein_codingdeleterious(0)probably_damaging(0.998)TCGA-FI-A2EW-01Endometriumuterine corpus endometrioid carcinomaFemale>=65I/IIChemotherapycarboplatinumPD
KRTCAP2SNVMissense_Mutationc.275N>Tp.Gly92Valp.G92VQ8N6L1protein_codingdeleterious(0)probably_damaging(1)TCGA-DD-A3A9-01Liverliver hepatocellular carcinomaFemale<65I/IIUnknownUnknownPD
Page: 1 2 

Top

Related drugs of malignant transformation related genes

check buttonIdentification of chemicals and drugs interact with genes involved in malignant transfromation
(DGIdb 4.0)
Entrez IDSymbolCategoryInteraction TypesDrug Claim NameDrug NamePMIDs
Page: 1