
|
|||||
|
 | |
| |
| |
| |
| |
| |
|
Gene: KLF12 |
Gene summary for KLF12 |
| Gene information | Species | Human | Gene symbol | KLF12 | Gene ID | 11278 |
| Gene name | Kruppel like factor 12 | |
| Gene Alias | AP-2rep | |
| Cytomap | 13q22.1 | |
| Gene Type | protein-coding | GO ID | GO:0000122 | UniProtAcc | Q8WWI3 |
Top |
Malignant transformation analysis |
| Identification of the aberrant gene expression in precancerous and cancerous lesions by comparing the gene expression of stem-like cells in diseased tissues with normal stem cells |
| Entrez ID | Symbol | Replicates | Species | Organ | Tissue | Adj P-value | Log2FC | Malignancy |
| 11278 | KLF12 | A015-C-002 | Human | Colorectum | FAP | 6.44e-09 | -4.56e-01 | -0.0763 |
| 11278 | KLF12 | A001-C-203 | Human | Colorectum | FAP | 2.43e-03 | -9.28e-02 | -0.0481 |
| 11278 | KLF12 | A002-C-116 | Human | Colorectum | FAP | 4.45e-16 | -4.46e-01 | -0.0452 |
| 11278 | KLF12 | A014-C-008 | Human | Colorectum | FAP | 1.25e-08 | -4.74e-01 | -0.191 |
| 11278 | KLF12 | A018-E-020 | Human | Colorectum | FAP | 4.06e-13 | -4.02e-01 | -0.2034 |
| 11278 | KLF12 | F034 | Human | Colorectum | FAP | 6.84e-12 | -3.59e-01 | -0.0665 |
| 11278 | KLF12 | F072B | Human | Colorectum | FAP | 1.04e-15 | -5.07e-01 | 0.257 |
| 11278 | KLF12 | CRC-3-11773 | Human | Colorectum | CRC | 1.23e-28 | -5.90e-01 | 0.2564 |
| 11278 | KLF12 | NAFLD1 | Human | Liver | NAFLD | 3.06e-17 | 1.36e+00 | -0.04 |
| 11278 | KLF12 | S41 | Human | Liver | Cirrhotic | 4.10e-07 | 7.78e-01 | -0.0343 |
| 11278 | KLF12 | S43 | Human | Liver | Cirrhotic | 3.64e-02 | -2.10e-01 | -0.0187 |
| 11278 | KLF12 | HCC1_Meng | Human | Liver | HCC | 1.40e-16 | -2.42e-01 | 0.0246 |
| 11278 | KLF12 | HCC2_Meng | Human | Liver | HCC | 2.87e-05 | -2.64e-01 | 0.0107 |
| 11278 | KLF12 | cirrhotic1 | Human | Liver | Cirrhotic | 4.50e-06 | -2.57e-01 | 0.0202 |
| 11278 | KLF12 | cirrhotic2 | Human | Liver | Cirrhotic | 5.89e-06 | -2.53e-01 | 0.0201 |
| 11278 | KLF12 | HCC1 | Human | Liver | HCC | 2.01e-04 | 3.63e+00 | 0.5336 |
| 11278 | KLF12 | HCC2 | Human | Liver | HCC | 7.11e-06 | 2.47e+00 | 0.5341 |
| 11278 | KLF12 | Pt13.a | Human | Liver | HCC | 2.38e-02 | -2.14e-01 | 0.021 |
| 11278 | KLF12 | Pt13.b | Human | Liver | HCC | 2.09e-09 | -1.40e-01 | 0.0251 |
| 11278 | KLF12 | Pt14.d | Human | Liver | HCC | 4.57e-03 | -2.11e-01 | 0.0143 |
| Page: 1 2 3 4 |
| Tissue | Expression Dynamics | Abbreviation |
| Colorectum (GSE201348) |  | FAP: Familial adenomatous polyposis |
| CRC: Colorectal cancer | ||
| Colorectum (HTA11) | 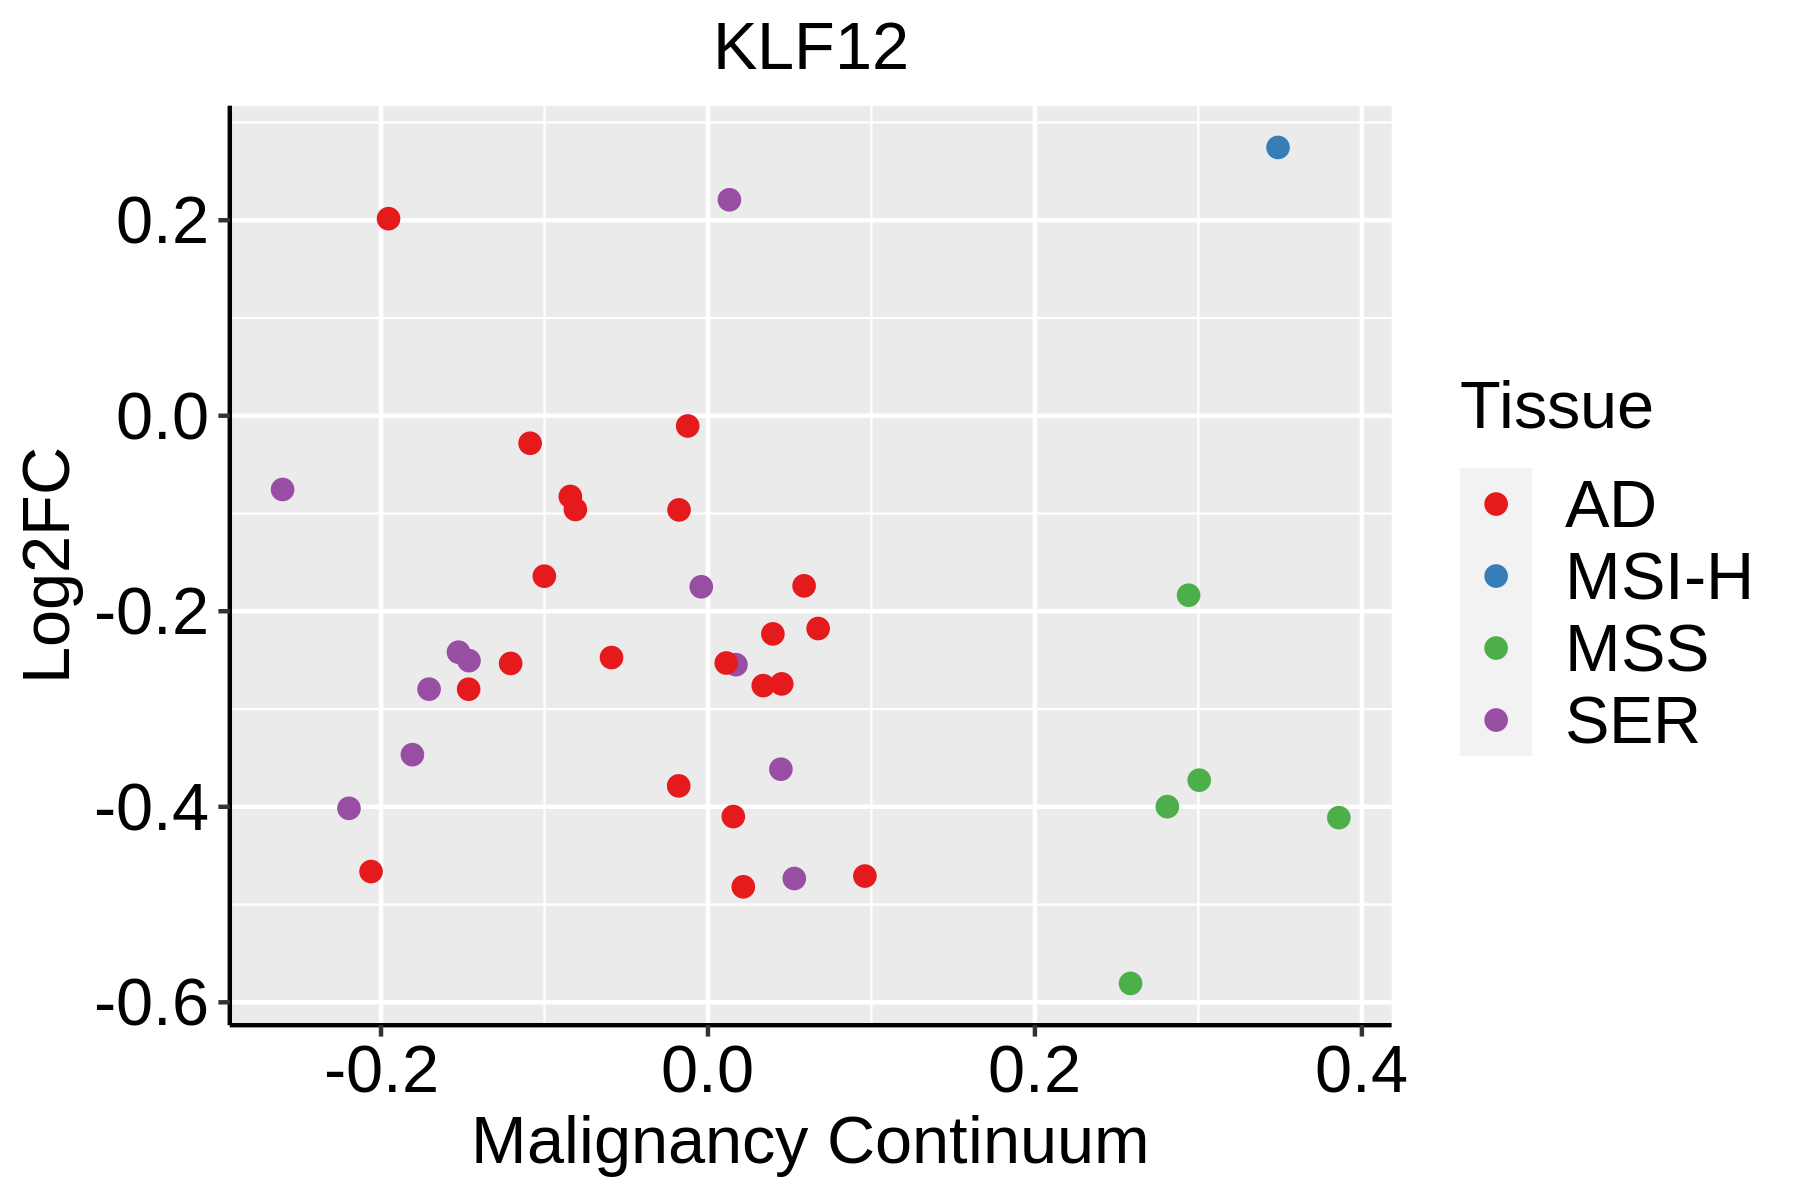 | AD: Adenomas |
| SER: Sessile serrated lesions | ||
| MSI-H: Microsatellite-high colorectal cancer | ||
| MSS: Microsatellite stable colorectal cancer | ||
| Liver | 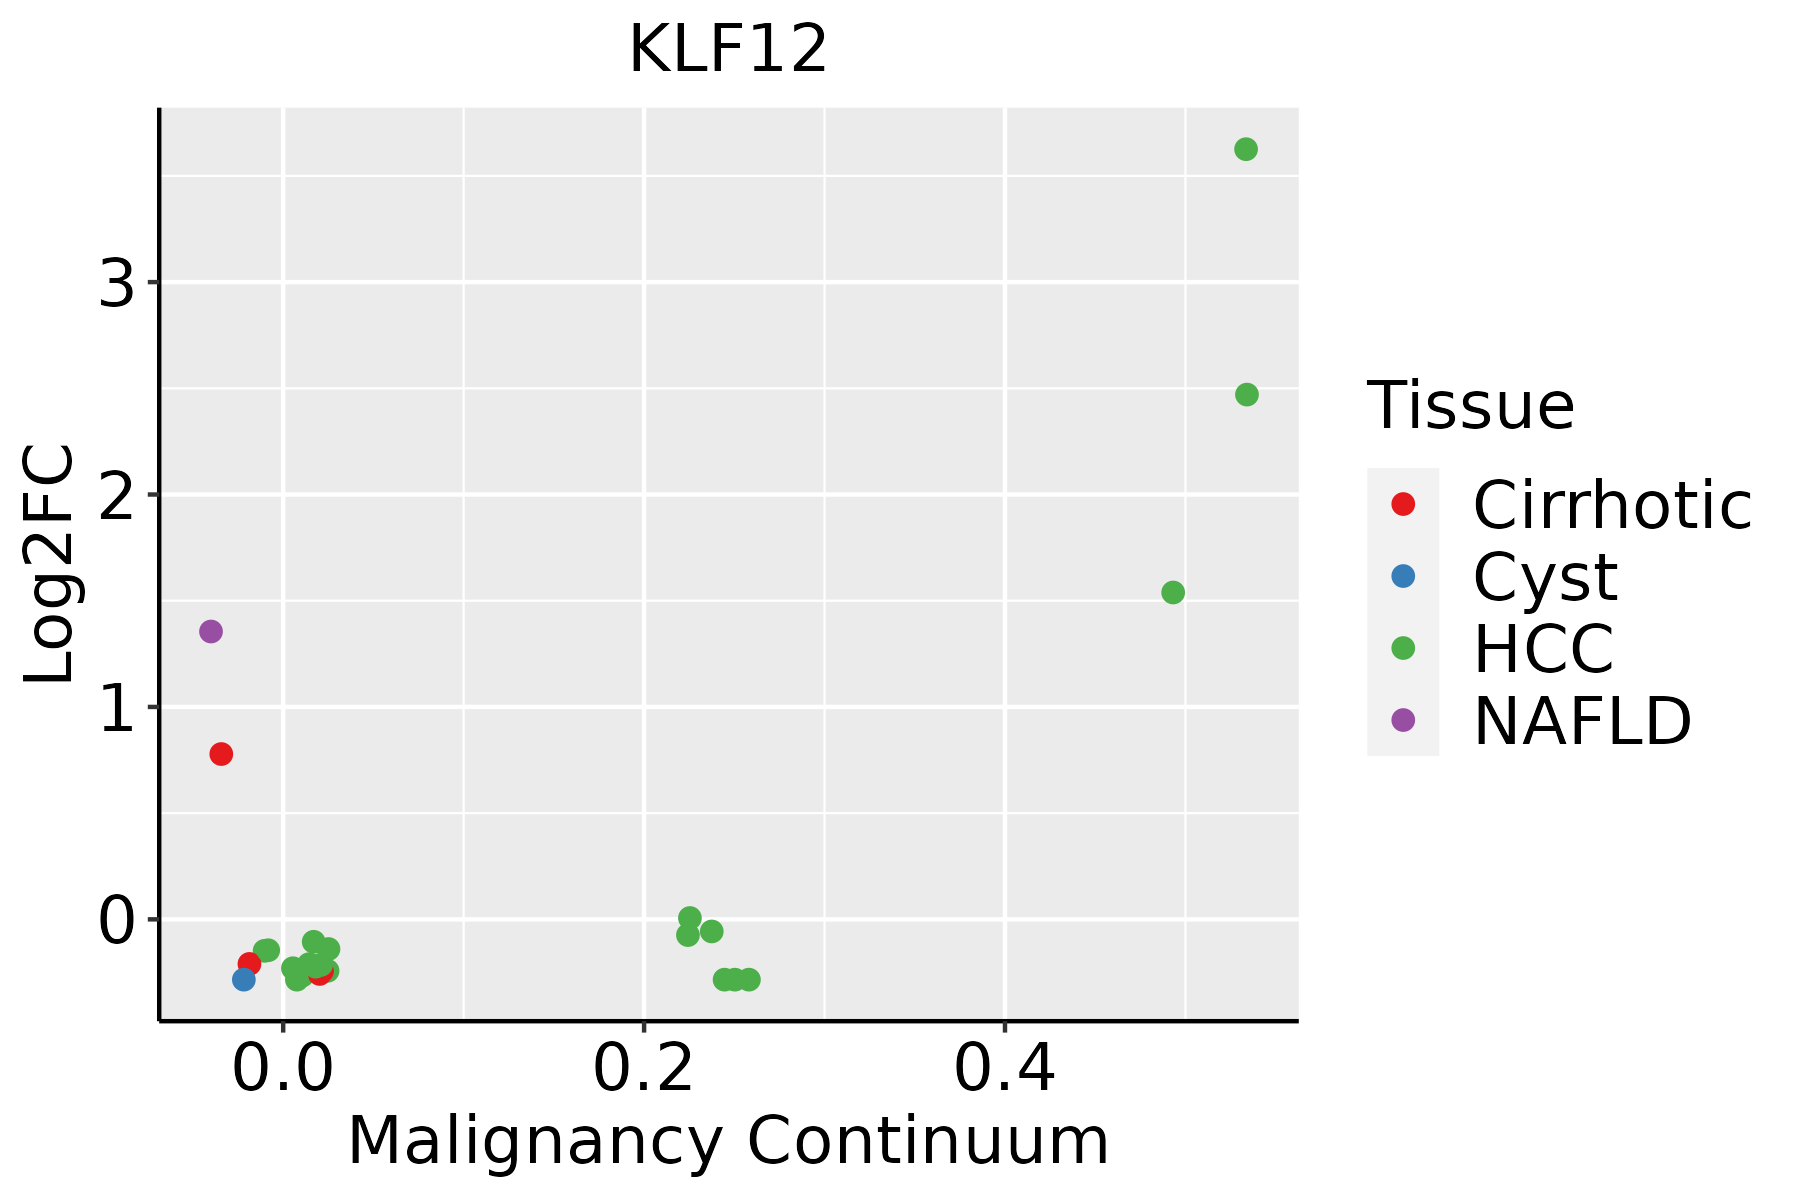 | HCC: Hepatocellular carcinoma |
| NAFLD: Non-alcoholic fatty liver disease | ||
| Lung |  | AAH: Atypical adenomatous hyperplasia |
| AIS: Adenocarcinoma in situ | ||
| IAC: Invasive lung adenocarcinoma | ||
| MIA: Minimally invasive adenocarcinoma | ||
| Thyroid | 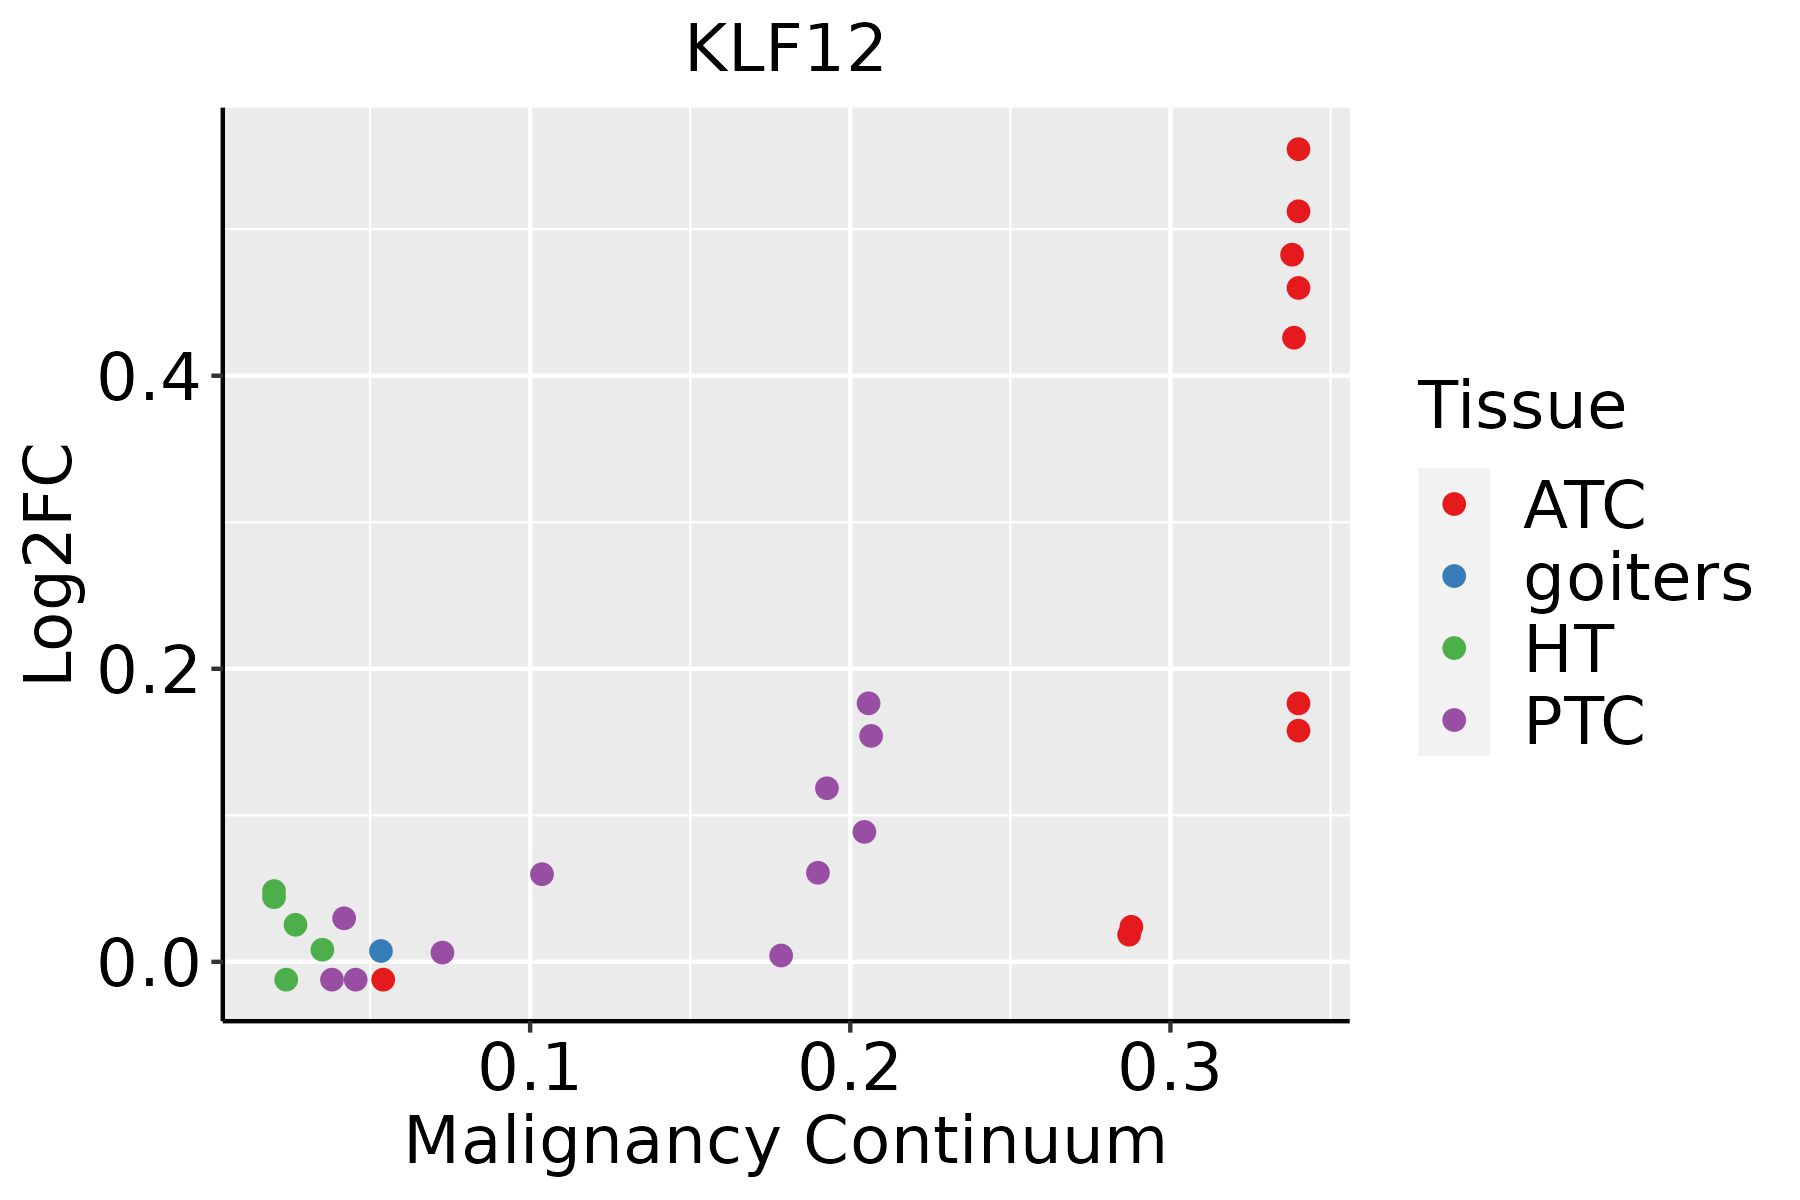 | ATC: Anaplastic thyroid cancer |
| HT: Hashimoto's thyroiditis | ||
| PTC: Papillary thyroid cancer |
| ∗log2FC in expression of this searched gene in stem-like cells from each diseased tissue sample relative to stem-like cells in normal samples in each tissue plotted against the malignancy continuum. Samples are colored based on if they are from different disease stage. |
Top |
Malignant transformation related pathway analysis |
| Find out the enriched GO biological processes and KEGG pathways involved in transition from healthy to precancer to cancer |
| Tissue | Disease Stage | Enriched GO biological Processes |
| Colorectum | AD |  |
| Colorectum | SER |  |
| Colorectum | MSS |  |
| Colorectum | MSI-H |  |
| Colorectum | FAP |  |
| ∗Top 15 enriched GO BP terms are showed in the bar plot of each disease state in each tissue. Each row represents a significant GO biological process which is colored according to the -log10(p.adjust). |
| Page: 1 2 3 4 5 6 7 8 9 |
| GO ID | Tissue | Disease Stage | Description | Gene Ratio | Bg Ratio | pvalue | p.adjust | Count |
| Page: 1 |
| Pathway ID | Tissue | Disease Stage | Description | Gene Ratio | Bg Ratio | pvalue | p.adjust | qvalue | Count |
| Page: 1 |
Top |
Cell-cell communication analysis |
| Identification of potential cell-cell interactions between two cell types and their ligand-receptor pairs for different disease states |
| Ligand | Receptor | LRpair | Pathway | Tissue | Disease Stage |
| Page: 1 |
Top |
Single-cell gene regulatory network inference analysis |
| Find out the significant the regulons (TFs) and the target genes of each regulon across cell types for different disease states |
| TF | Cell Type | Tissue | Disease Stage | Target Gene | RSS | Regulon Activity |
| KLF12 | CD8TEXINT | Breast | ADJ | TRIB2,GIMAP5,TCF7, etc. | 7.84e-02 |  |
| KLF12 | CD8TEFF | Breast | ADJ | TRIB2,GIMAP5,TCF7, etc. | 1.45e-01 | |
| KLF12 | CD4TN | Breast | DCIS | TRIB2,GIMAP5,TCF7, etc. | 2.23e-01 |  |
| KLF12 | CD8TEXINT | Breast | Healthy | TRIB2,GIMAP5,TCF7, etc. | 1.34e-01 |  |
| KLF12 | TREG | Breast | Healthy | TRIB2,GIMAP5,TCF7, etc. | 4.77e-02 | |
| KLF12 | CD4TN | Breast | IDC | TRIB2,GIMAP5,TCF7, etc. | 1.06e-01 |  |
| KLF12 | CD8TEXINT | Breast | IDC | TRIB2,GIMAP5,TCF7, etc. | 6.09e-02 | |
| KLF12 | KER | Cervix | CC | LHFPL6,ARHGAP15,STAT4, etc. | 2.06e-02 |  |
| KLF12 | BAS | Cervix | HSIL_HPV | LHFPL6,ARHGAP15,STAT4, etc. | 1.55e-01 |  |
| KLF12 | BAS | Cervix | N_HPV | LHFPL6,ARHGAP15,STAT4, etc. | 1.79e-01 |  |
| ∗The dot plots of a searched regulon are shown for all cell subpopulations in each disease state of each tissue based on the regulon specific score inferred using pySCENIC and by calculating the average expression. |
| Page: 1 2 3 4 |
Top |
Somatic mutation of malignant transformation related genes |
| Annotation of somatic variants for genes involved in malignant transformation |
| Hugo Symbol | Variant Class | Variant Classification | dbSNP RS | HGVSc | HGVSp | HGVSp Short | SWISSPROT | BIOTYPE | SIFT | PolyPhen | Tumor Sample Barcode | Tissue | Histology | Sex | Age | Stage | Therapy Types | Drugs | Outcome |
| KLF12 | SNV | Missense_Mutation | novel | c.1054N>A | p.Glu352Lys | p.E352K | Q9Y4X4 | protein_coding | deleterious(0.01) | benign(0.048) | TCGA-A2-A0CR-01 | Breast | breast invasive carcinoma | Female | <65 | I/II | Chemotherapy | adriamycin | CR |
| KLF12 | SNV | Missense_Mutation | rs762948057 | c.44C>T | p.Thr15Ile | p.T15I | Q9Y4X4 | protein_coding | tolerated_low_confidence(0.19) | benign(0) | TCGA-AN-A04A-01 | Breast | breast invasive carcinoma | Female | <65 | III/IV | Unknown | Unknown | SD |
| KLF12 | SNV | Missense_Mutation | novel | c.964G>C | p.Glu322Gln | p.E322Q | Q9Y4X4 | protein_coding | deleterious(0.05) | possibly_damaging(0.607) | TCGA-BH-A28O-01 | Breast | breast invasive carcinoma | Female | <65 | III/IV | Chemotherapy | cytoxan | CR |
| KLF12 | insertion | Frame_Shift_Ins | novel | c.907_908insCGGTAAAACATGGCTCACAGCAAGCAAGTCCAGTCCA | p.Gln303ProfsTer17 | p.Q303Pfs*17 | Q9Y4X4 | protein_coding | TCGA-A8-A06P-01 | Breast | breast invasive carcinoma | Female | <65 | III/IV | Unspecific | SD | |||
| KLF12 | SNV | Missense_Mutation | rs375091947 | c.634N>A | p.Val212Met | p.V212M | Q9Y4X4 | protein_coding | deleterious(0.03) | benign(0.178) | TCGA-VS-A8QA-01 | Cervix | cervical & endocervical cancer | Female | <65 | I/II | Unknown | Unknown | SD |
| KLF12 | SNV | Missense_Mutation | novel | c.452N>T | p.Ser151Phe | p.S151F | Q9Y4X4 | protein_coding | deleterious(0) | possibly_damaging(0.462) | TCGA-VS-A959-01 | Cervix | cervical & endocervical cancer | Female | >=65 | I/II | Unknown | Unknown | SD |
| KLF12 | SNV | Missense_Mutation | c.1156N>G | p.Phe386Val | p.F386V | Q9Y4X4 | protein_coding | deleterious(0) | probably_damaging(0.999) | TCGA-A6-2686-01 | Colorectum | colon adenocarcinoma | Female | >=65 | I/II | Unknown | Unknown | SD | |
| KLF12 | SNV | Missense_Mutation | novel | c.389N>C | p.Ile130Thr | p.I130T | Q9Y4X4 | protein_coding | tolerated(0.22) | possibly_damaging(0.84) | TCGA-AA-3811-01 | Colorectum | colon adenocarcinoma | Female | >=65 | III/IV | Unknown | Unknown | PD |
| KLF12 | SNV | Missense_Mutation | c.250N>G | p.Leu84Val | p.L84V | Q9Y4X4 | protein_coding | deleterious(0) | possibly_damaging(0.899) | TCGA-AA-3842-01 | Colorectum | colon adenocarcinoma | Male | <65 | III/IV | Chemotherapy | folinic | PD | |
| KLF12 | SNV | Missense_Mutation | novel | c.1075N>A | p.Ala359Thr | p.A359T | Q9Y4X4 | protein_coding | deleterious(0.02) | benign(0.221) | TCGA-AA-3949-01 | Colorectum | colon adenocarcinoma | Female | >=65 | III/IV | Unknown | Unknown | SD |
| Page: 1 2 3 4 5 6 |
Top |
Related drugs of malignant transformation related genes |
| Identification of chemicals and drugs interact with genes involved in malignant transfromation |
| (DGIdb 4.0) |
| Entrez ID | Symbol | Category | Interaction Types | Drug Claim Name | Drug Name | PMIDs |
| Page: 1 |

Copyright 2023-Present -The University of Texas Health Science Center at Houston |