
|
|||||
|
 | |
| |
| |
| |
| |
| |
|
Gene: KLC3 |
Gene summary for KLC3 |
| Gene information | Species | Human | Gene symbol | KLC3 | Gene ID | 147700 |
| Gene name | kinesin light chain 3 | |
| Gene Alias | KLC2 | |
| Cytomap | 19q13.32 | |
| Gene Type | protein-coding | GO ID | GO:0006810 | UniProtAcc | A0A024R0V3 |
Top |
Malignant transformation analysis |
| Identification of the aberrant gene expression in precancerous and cancerous lesions by comparing the gene expression of stem-like cells in diseased tissues with normal stem cells |
| Entrez ID | Symbol | Replicates | Species | Organ | Tissue | Adj P-value | Log2FC | Malignancy |
| 147700 | KLC3 | P27T-E | Human | Esophagus | ESCC | 5.87e-11 | 2.11e-01 | 0.1055 |
| 147700 | KLC3 | P28T-E | Human | Esophagus | ESCC | 3.45e-51 | 1.08e+00 | 0.1149 |
| 147700 | KLC3 | P30T-E | Human | Esophagus | ESCC | 9.13e-05 | 3.95e-01 | 0.137 |
| 147700 | KLC3 | P31T-E | Human | Esophagus | ESCC | 2.80e-46 | 8.06e-01 | 0.1251 |
| 147700 | KLC3 | P32T-E | Human | Esophagus | ESCC | 5.53e-27 | 6.66e-01 | 0.1666 |
| 147700 | KLC3 | P36T-E | Human | Esophagus | ESCC | 1.10e-03 | 3.12e-01 | 0.1187 |
| 147700 | KLC3 | P37T-E | Human | Esophagus | ESCC | 6.98e-22 | 5.02e-01 | 0.1371 |
| 147700 | KLC3 | P38T-E | Human | Esophagus | ESCC | 3.33e-13 | 5.59e-01 | 0.127 |
| 147700 | KLC3 | P39T-E | Human | Esophagus | ESCC | 7.27e-06 | 1.01e-01 | 0.0894 |
| 147700 | KLC3 | P40T-E | Human | Esophagus | ESCC | 2.52e-16 | 5.57e-01 | 0.109 |
| 147700 | KLC3 | P42T-E | Human | Esophagus | ESCC | 3.89e-12 | 3.36e-01 | 0.1175 |
| 147700 | KLC3 | P47T-E | Human | Esophagus | ESCC | 1.11e-07 | 1.20e-01 | 0.1067 |
| 147700 | KLC3 | P48T-E | Human | Esophagus | ESCC | 1.32e-15 | 2.23e-01 | 0.0959 |
| 147700 | KLC3 | P49T-E | Human | Esophagus | ESCC | 4.97e-06 | 7.47e-01 | 0.1768 |
| 147700 | KLC3 | P52T-E | Human | Esophagus | ESCC | 9.39e-38 | 6.35e-01 | 0.1555 |
| 147700 | KLC3 | P54T-E | Human | Esophagus | ESCC | 3.37e-14 | 3.79e-01 | 0.0975 |
| 147700 | KLC3 | P56T-E | Human | Esophagus | ESCC | 9.60e-04 | 4.50e-01 | 0.1613 |
| 147700 | KLC3 | P57T-E | Human | Esophagus | ESCC | 9.22e-15 | 3.27e-01 | 0.0926 |
| 147700 | KLC3 | P61T-E | Human | Esophagus | ESCC | 7.09e-07 | 2.58e-01 | 0.099 |
| 147700 | KLC3 | P62T-E | Human | Esophagus | ESCC | 2.48e-15 | 3.43e-01 | 0.1302 |
| Page: 1 2 3 4 |
| Tissue | Expression Dynamics | Abbreviation |
| Esophagus | 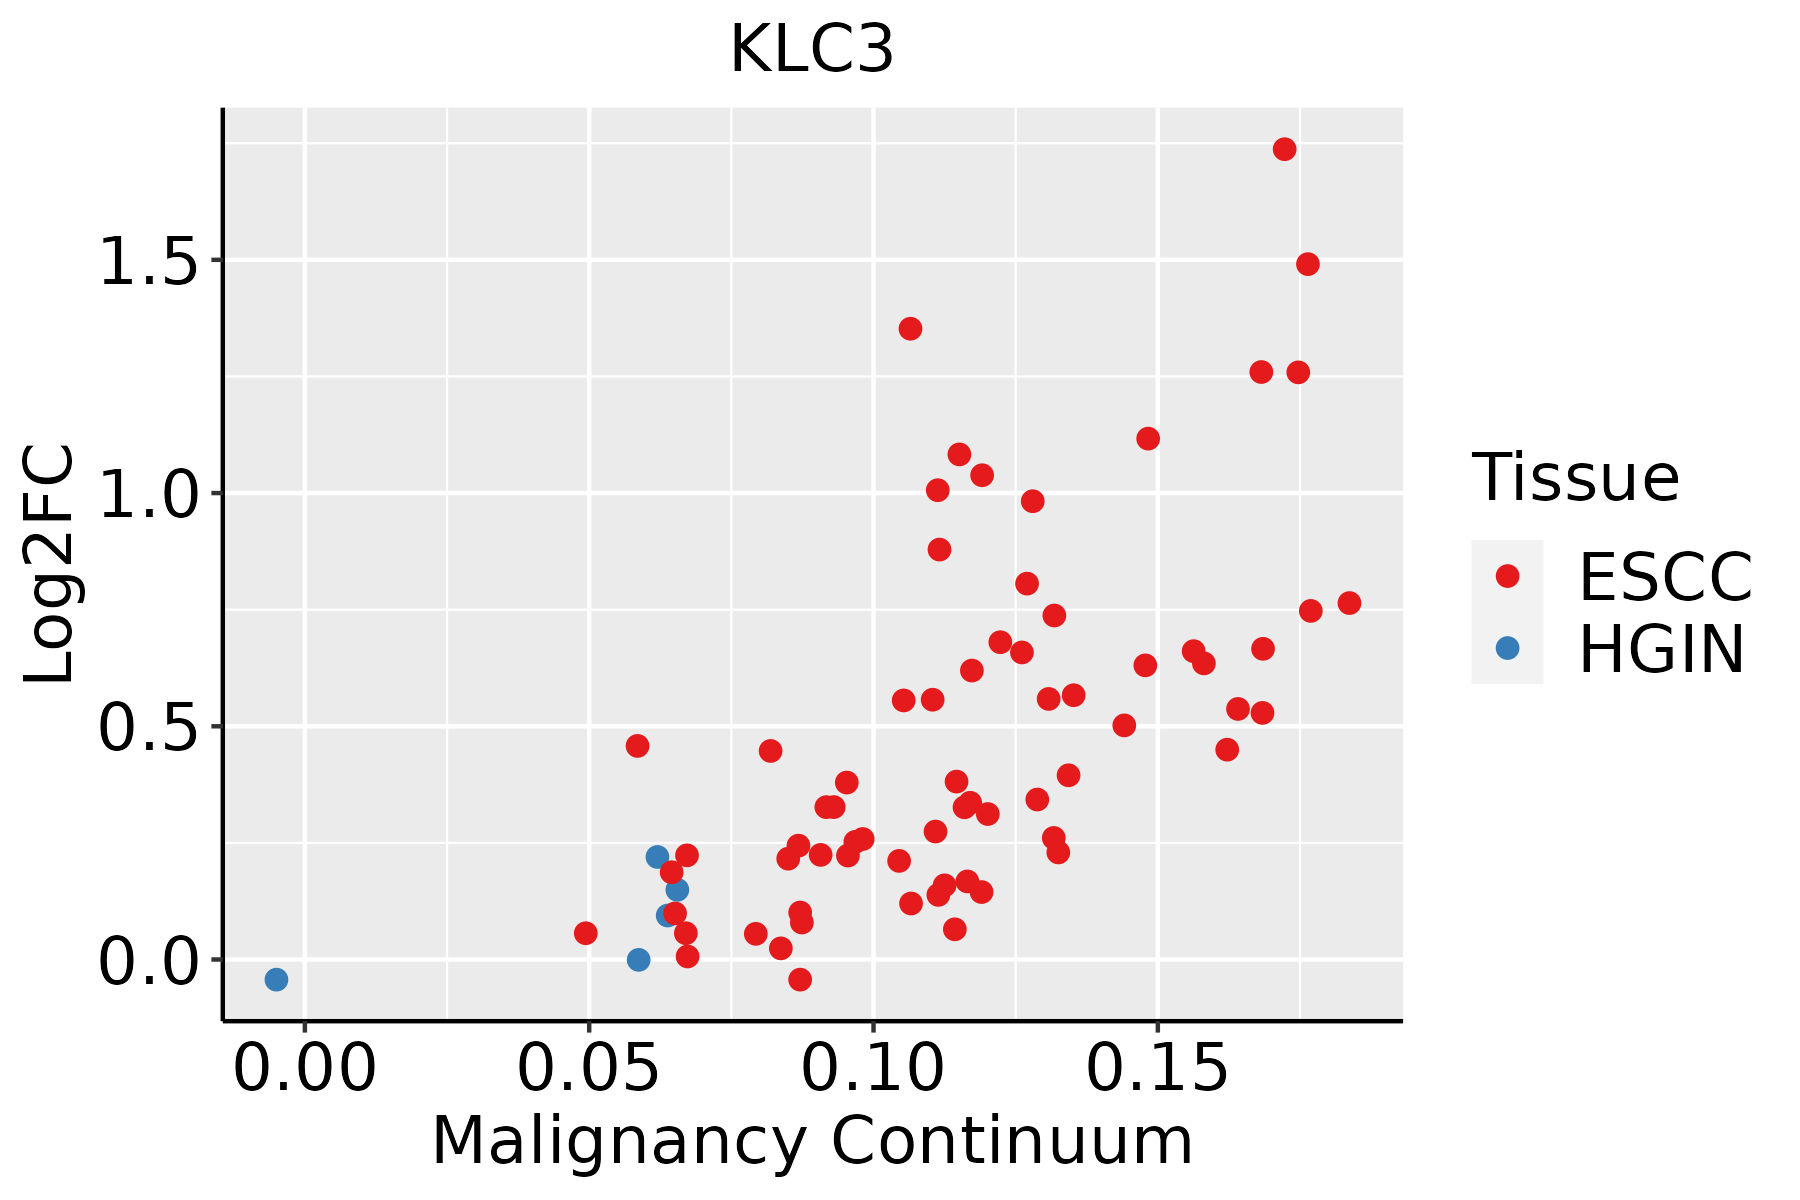 | ESCC: Esophageal squamous cell carcinoma |
| HGIN: High-grade intraepithelial neoplasias | ||
| LGIN: Low-grade intraepithelial neoplasias | ||
| Oral Cavity | 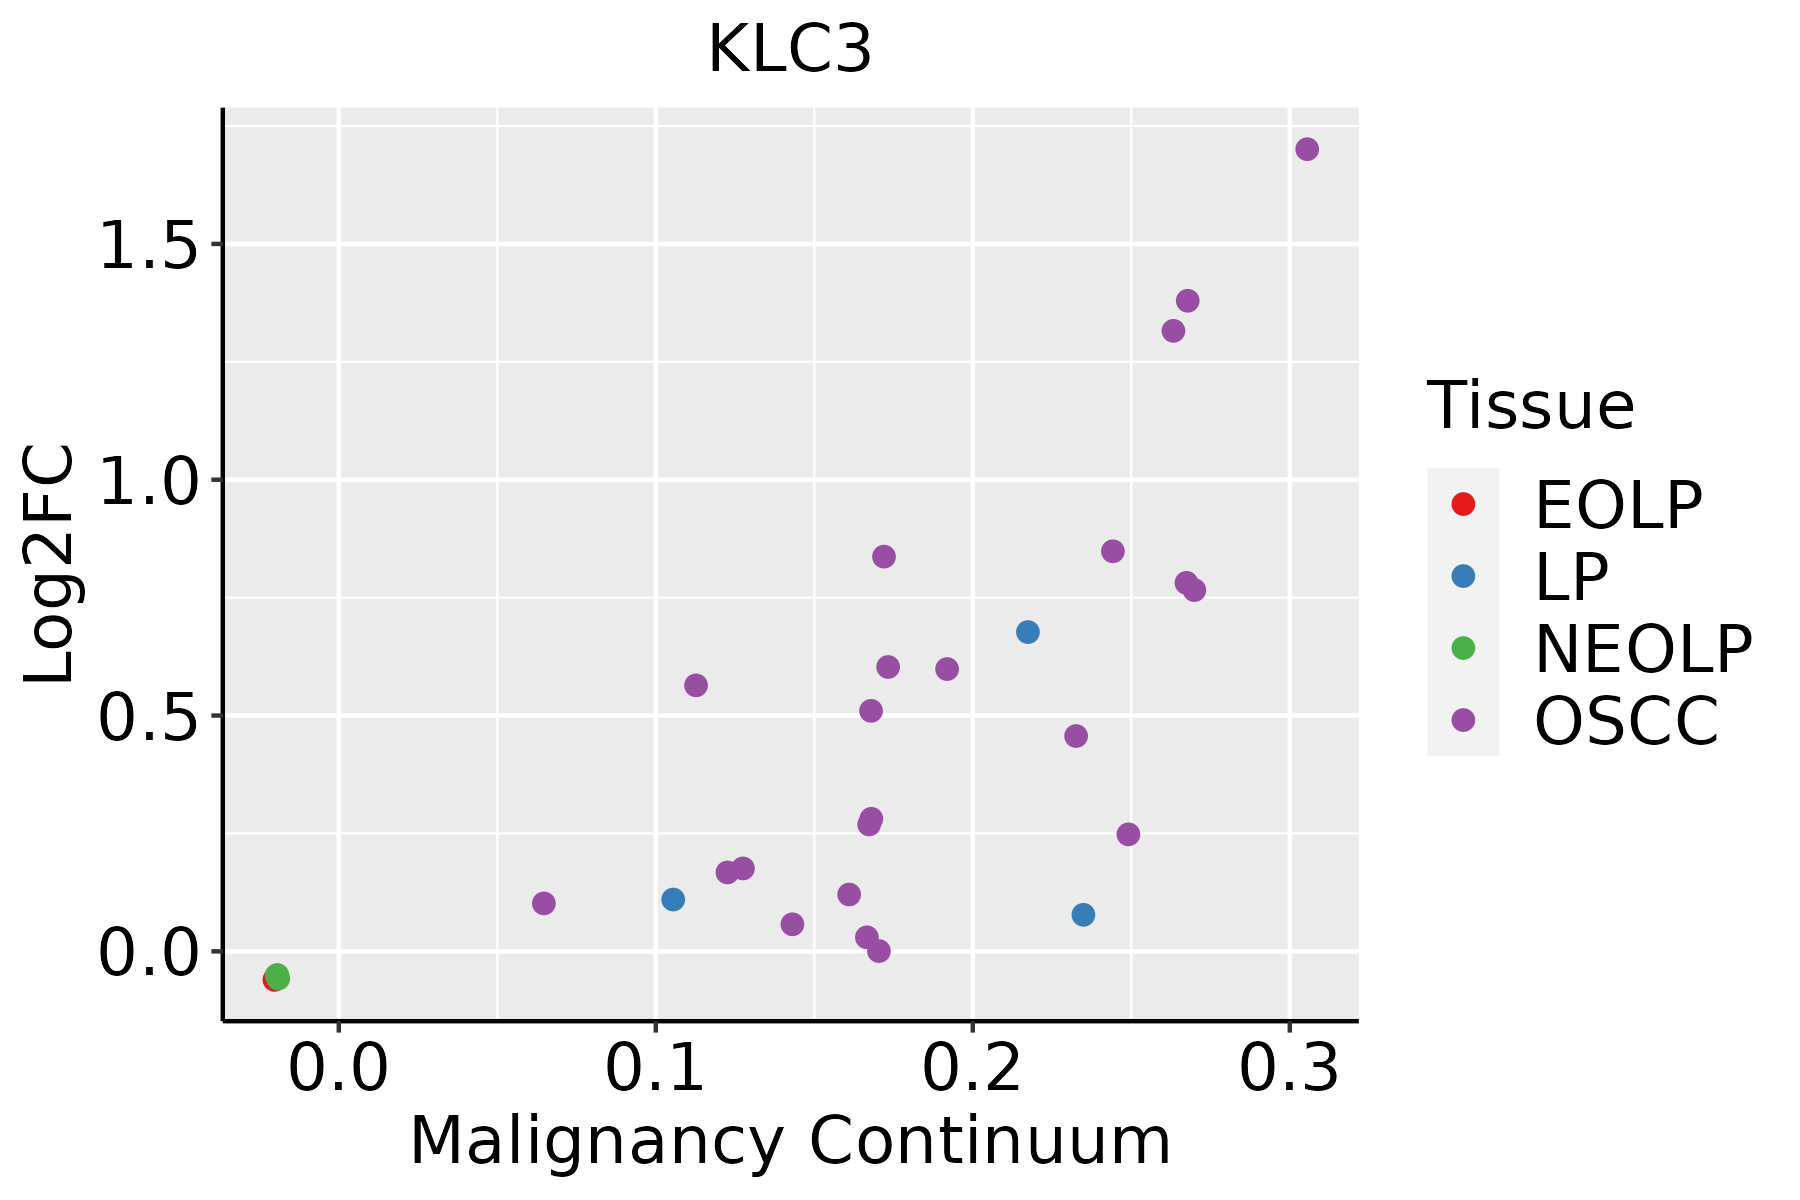 | EOLP: Erosive Oral lichen planus |
| LP: leukoplakia | ||
| NEOLP: Non-erosive oral lichen planus | ||
| OSCC: Oral squamous cell carcinoma | ||
| Skin | 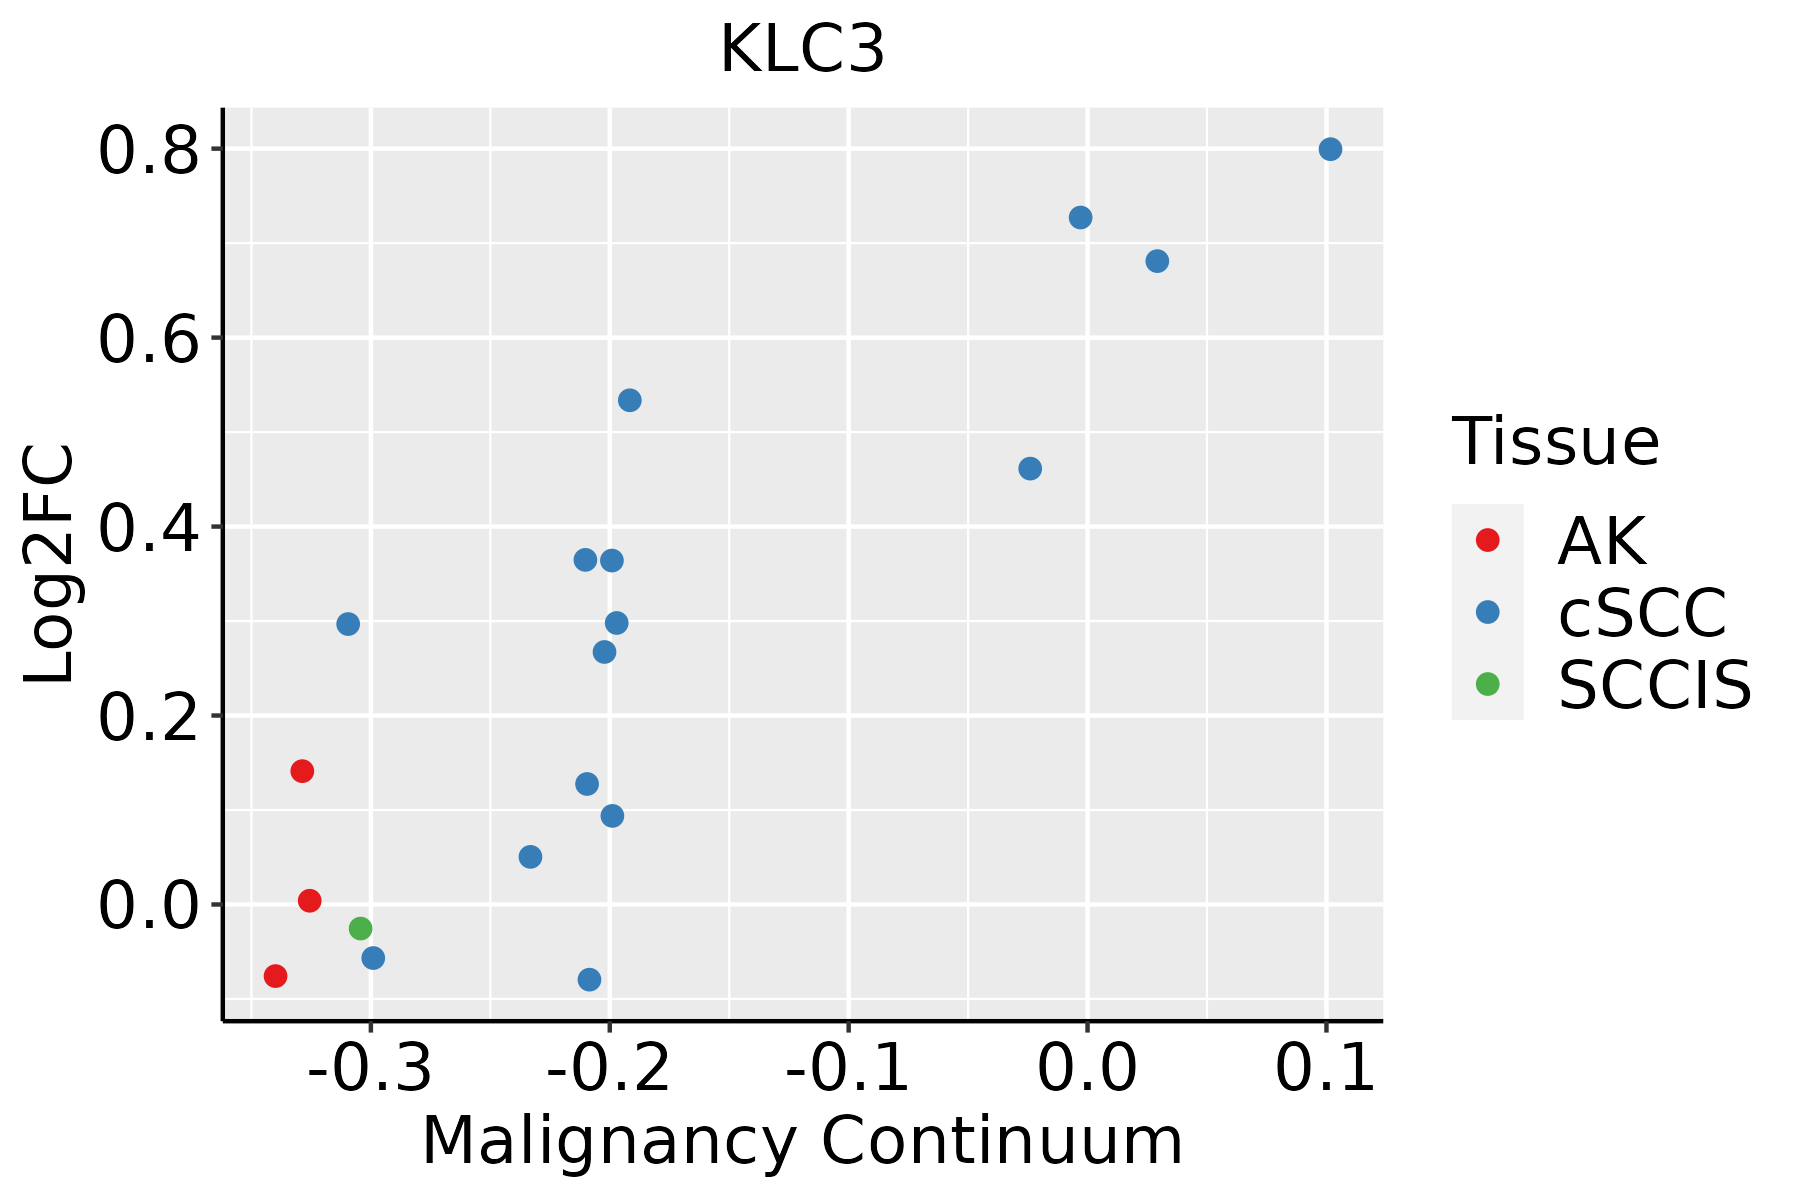 | AK: Actinic keratosis |
| cSCC: Cutaneous squamous cell carcinoma | ||
| SCCIS:squamous cell carcinoma in situ |
| ∗log2FC in expression of this searched gene in stem-like cells from each diseased tissue sample relative to stem-like cells in normal samples in each tissue plotted against the malignancy continuum. Samples are colored based on if they are from different disease stage. |
Top |
Malignant transformation related pathway analysis |
| Find out the enriched GO biological processes and KEGG pathways involved in transition from healthy to precancer to cancer |
| Tissue | Disease Stage | Enriched GO biological Processes |
| Colorectum | AD |  |
| Colorectum | SER |  |
| Colorectum | MSS |  |
| Colorectum | MSI-H |  |
| Colorectum | FAP |  |
| ∗Top 15 enriched GO BP terms are showed in the bar plot of each disease state in each tissue. Each row represents a significant GO biological process which is colored according to the -log10(p.adjust). |
| Page: 1 2 3 4 5 6 7 8 9 |
| GO ID | Tissue | Disease Stage | Description | Gene Ratio | Bg Ratio | pvalue | p.adjust | Count |
| GO:003070518 | Esophagus | ESCC | cytoskeleton-dependent intracellular transport | 133/8552 | 195/18723 | 1.48e-10 | 4.27e-09 | 133 |
| GO:001097013 | Esophagus | ESCC | transport along microtubule | 107/8552 | 155/18723 | 3.17e-09 | 6.80e-08 | 107 |
| GO:000808810 | Esophagus | ESCC | axo-dendritic transport | 58/8552 | 75/18723 | 2.09e-08 | 4.02e-07 | 58 |
| GO:00991114 | Esophagus | ESCC | microtubule-based transport | 115/8552 | 190/18723 | 2.54e-05 | 2.15e-04 | 115 |
| GO:003070510 | Oral cavity | OSCC | cytoskeleton-dependent intracellular transport | 113/7305 | 195/18723 | 6.03e-08 | 1.09e-06 | 113 |
| GO:00109706 | Oral cavity | OSCC | transport along microtubule | 88/7305 | 155/18723 | 5.35e-06 | 6.02e-05 | 88 |
| GO:00080889 | Oral cavity | OSCC | axo-dendritic transport | 46/7305 | 75/18723 | 7.44e-05 | 5.81e-04 | 46 |
| GO:00991113 | Oral cavity | OSCC | microtubule-based transport | 96/7305 | 190/18723 | 7.92e-04 | 4.27e-03 | 96 |
| GO:003070516 | Oral cavity | LP | cytoskeleton-dependent intracellular transport | 68/4623 | 195/18723 | 8.92e-04 | 7.64e-03 | 68 |
| GO:001097012 | Oral cavity | LP | transport along microtubule | 56/4623 | 155/18723 | 9.49e-04 | 8.04e-03 | 56 |
| GO:000808815 | Oral cavity | LP | axo-dendritic transport | 30/4623 | 75/18723 | 2.42e-03 | 1.73e-02 | 30 |
| GO:003070524 | Skin | cSCC | cytoskeleton-dependent intracellular transport | 77/4864 | 195/18723 | 2.32e-05 | 2.67e-04 | 77 |
| GO:001097014 | Skin | cSCC | transport along microtubule | 58/4864 | 155/18723 | 1.09e-03 | 7.24e-03 | 58 |
| GO:000808817 | Skin | cSCC | axo-dendritic transport | 32/4864 | 75/18723 | 1.22e-03 | 7.92e-03 | 32 |
| Page: 1 |
| Pathway ID | Tissue | Disease Stage | Description | Gene Ratio | Bg Ratio | pvalue | p.adjust | qvalue | Count |
| hsa05014210 | Esophagus | ESCC | Amyotrophic lateral sclerosis | 266/4205 | 364/8465 | 1.31e-20 | 2.20e-18 | 1.13e-18 | 266 |
| hsa05132211 | Esophagus | ESCC | Salmonella infection | 191/4205 | 249/8465 | 6.51e-19 | 5.45e-17 | 2.79e-17 | 191 |
| hsa05016210 | Esophagus | ESCC | Huntington disease | 226/4205 | 306/8465 | 1.38e-18 | 8.72e-17 | 4.46e-17 | 226 |
| hsa05012211 | Esophagus | ESCC | Parkinson disease | 201/4205 | 266/8465 | 1.56e-18 | 8.72e-17 | 4.46e-17 | 201 |
| hsa05022210 | Esophagus | ESCC | Pathways of neurodegeneration - multiple diseases | 318/4205 | 476/8465 | 6.10e-15 | 2.04e-13 | 1.05e-13 | 318 |
| hsa05010210 | Esophagus | ESCC | Alzheimer disease | 263/4205 | 384/8465 | 1.80e-14 | 5.47e-13 | 2.80e-13 | 263 |
| hsa05020210 | Esophagus | ESCC | Prion disease | 193/4205 | 273/8465 | 6.42e-13 | 1.34e-11 | 6.89e-12 | 193 |
| hsa0501438 | Esophagus | ESCC | Amyotrophic lateral sclerosis | 266/4205 | 364/8465 | 1.31e-20 | 2.20e-18 | 1.13e-18 | 266 |
| hsa05132310 | Esophagus | ESCC | Salmonella infection | 191/4205 | 249/8465 | 6.51e-19 | 5.45e-17 | 2.79e-17 | 191 |
| hsa0501638 | Esophagus | ESCC | Huntington disease | 226/4205 | 306/8465 | 1.38e-18 | 8.72e-17 | 4.46e-17 | 226 |
| hsa05012310 | Esophagus | ESCC | Parkinson disease | 201/4205 | 266/8465 | 1.56e-18 | 8.72e-17 | 4.46e-17 | 201 |
| hsa0502238 | Esophagus | ESCC | Pathways of neurodegeneration - multiple diseases | 318/4205 | 476/8465 | 6.10e-15 | 2.04e-13 | 1.05e-13 | 318 |
| hsa0501038 | Esophagus | ESCC | Alzheimer disease | 263/4205 | 384/8465 | 1.80e-14 | 5.47e-13 | 2.80e-13 | 263 |
| hsa0502038 | Esophagus | ESCC | Prion disease | 193/4205 | 273/8465 | 6.42e-13 | 1.34e-11 | 6.89e-12 | 193 |
| hsa0501428 | Oral cavity | OSCC | Amyotrophic lateral sclerosis | 246/3704 | 364/8465 | 6.65e-21 | 1.11e-18 | 5.67e-19 | 246 |
| hsa0501230 | Oral cavity | OSCC | Parkinson disease | 188/3704 | 266/8465 | 1.82e-19 | 1.52e-17 | 7.75e-18 | 188 |
| hsa0513230 | Oral cavity | OSCC | Salmonella infection | 174/3704 | 249/8465 | 2.67e-17 | 1.49e-15 | 7.58e-16 | 174 |
| hsa0501628 | Oral cavity | OSCC | Huntington disease | 204/3704 | 306/8465 | 1.70e-16 | 7.13e-15 | 3.63e-15 | 204 |
| hsa0501028 | Oral cavity | OSCC | Alzheimer disease | 244/3704 | 384/8465 | 1.18e-15 | 3.60e-14 | 1.83e-14 | 244 |
| hsa0502228 | Oral cavity | OSCC | Pathways of neurodegeneration - multiple diseases | 292/3704 | 476/8465 | 1.60e-15 | 4.47e-14 | 2.28e-14 | 292 |
| Page: 1 2 3 |
Top |
Cell-cell communication analysis |
| Identification of potential cell-cell interactions between two cell types and their ligand-receptor pairs for different disease states |
| Ligand | Receptor | LRpair | Pathway | Tissue | Disease Stage |
| Page: 1 |
Top |
Single-cell gene regulatory network inference analysis |
| Find out the significant the regulons (TFs) and the target genes of each regulon across cell types for different disease states |
| TF | Cell Type | Tissue | Disease Stage | Target Gene | RSS | Regulon Activity |
| ∗The dot plots of a searched regulon are shown for all cell subpopulations in each disease state of each tissue based on the regulon specific score inferred using pySCENIC and by calculating the average expression. |
| Page: 1 |
Top |
Somatic mutation of malignant transformation related genes |
| Annotation of somatic variants for genes involved in malignant transformation |
| Hugo Symbol | Variant Class | Variant Classification | dbSNP RS | HGVSc | HGVSp | HGVSp Short | SWISSPROT | BIOTYPE | SIFT | PolyPhen | Tumor Sample Barcode | Tissue | Histology | Sex | Age | Stage | Therapy Types | Drugs | Outcome |
| KLC3 | SNV | Missense_Mutation | rs541951781 | c.50N>A | p.Arg17His | p.R17H | Q6P597 | protein_coding | deleterious(0.03) | possibly_damaging(0.511) | TCGA-A2-A3XS-01 | Breast | breast invasive carcinoma | Female | <65 | III/IV | Chemotherapy | cytoxan | PD |
| KLC3 | SNV | Missense_Mutation | c.745N>A | p.Ala249Thr | p.A249T | Q6P597 | protein_coding | deleterious(0) | benign(0.378) | TCGA-A8-A09Z-01 | Breast | breast invasive carcinoma | Female | >=65 | I/II | Unknown | Unknown | SD | |
| KLC3 | SNV | Missense_Mutation | rs762151883 | c.617G>A | p.Arg206His | p.R206H | Q6P597 | protein_coding | deleterious(0.04) | probably_damaging(0.962) | TCGA-D8-A1JK-01 | Breast | breast invasive carcinoma | Female | >=65 | I/II | Unknown | Unknown | SD |
| KLC3 | SNV | Missense_Mutation | novel | c.733N>G | p.His245Asp | p.H245D | Q6P597 | protein_coding | deleterious(0.03) | probably_damaging(0.996) | TCGA-GM-A3XL-01 | Breast | breast invasive carcinoma | Female | <65 | I/II | Chemotherapy | fluorouracil | CR |
| KLC3 | SNV | Missense_Mutation | c.403N>C | p.Glu135Gln | p.E135Q | Q6P597 | protein_coding | tolerated(1) | benign(0.009) | TCGA-JX-A3Q0-01 | Cervix | cervical & endocervical cancer | Female | <65 | III/IV | Unknown | Unknown | SD | |
| KLC3 | SNV | Missense_Mutation | rs369849969 | c.677N>T | p.Ala226Val | p.A226V | Q6P597 | protein_coding | deleterious(0) | benign(0.232) | TCGA-CK-4951-01 | Colorectum | colon adenocarcinoma | Female | >=65 | I/II | Unknown | Unknown | PD |
| KLC3 | SNV | Missense_Mutation | rs769289827 | c.250N>A | p.Glu84Lys | p.E84K | Q6P597 | protein_coding | deleterious(0) | possibly_damaging(0.647) | TCGA-D5-6928-01 | Colorectum | colon adenocarcinoma | Male | >=65 | I/II | Unknown | Unknown | SD |
| KLC3 | SNV | Missense_Mutation | rs762151883 | c.617G>A | p.Arg206His | p.R206H | Q6P597 | protein_coding | deleterious(0.04) | probably_damaging(0.962) | TCGA-F4-6463-01 | Colorectum | colon adenocarcinoma | Male | <65 | I/II | Unknown | Unknown | SD |
| KLC3 | SNV | Missense_Mutation | c.1021C>A | p.Leu341Met | p.L341M | Q6P597 | protein_coding | deleterious(0) | probably_damaging(0.998) | TCGA-G4-6588-01 | Colorectum | colon adenocarcinoma | Female | <65 | I/II | Unknown | Unknown | SD | |
| KLC3 | SNV | Missense_Mutation | rs775194648 | c.221N>T | p.Ser74Leu | p.S74L | Q6P597 | protein_coding | deleterious(0.02) | benign(0.028) | TCGA-WS-AB45-01 | Colorectum | colon adenocarcinoma | Female | <65 | I/II | Unknown | Unknown | SD |
| Page: 1 2 3 4 |
Top |
Related drugs of malignant transformation related genes |
| Identification of chemicals and drugs interact with genes involved in malignant transfromation |
| (DGIdb 4.0) |
| Entrez ID | Symbol | Category | Interaction Types | Drug Claim Name | Drug Name | PMIDs |
| 147700 | KLC3 | NA | gemcitabine | GEMCITABINE | ||
| 147700 | KLC3 | NA | Platinum compounds | 19434073,22188361,29662106,22026922,21449681 | ||
| 147700 | KLC3 | NA | platinum | PLATINUM | 19434073,22188361,29662106,22026922,21449681 | |
| 147700 | KLC3 | NA | oxaliplatin | OXALIPLATIN | 19434073,22188361,29662106,22026922,21449681 | |
| 147700 | KLC3 | NA | cisplatin | CISPLATIN | 19434073,22188361,29662106,22026922,21449681 |
| Page: 1 |

Copyright 2023-Present -The University of Texas Health Science Center at Houston |