
|
|||||
|
 | |
| |
| |
| |
| |
| |
|
Gene: INIP |
Gene summary for INIP |
| Gene information | Species | Human | Gene symbol | INIP | Gene ID | 58493 |
| Gene name | INTS3 and NABP interacting protein | |
| Gene Alias | C9orf80 | |
| Cytomap | 9q32 | |
| Gene Type | protein-coding | GO ID | GO:0006139 | UniProtAcc | X6R8P6 |
Top |
Malignant transformation analysis |
| Identification of the aberrant gene expression in precancerous and cancerous lesions by comparing the gene expression of stem-like cells in diseased tissues with normal stem cells |
| Entrez ID | Symbol | Replicates | Species | Organ | Tissue | Adj P-value | Log2FC | Malignancy |
| 58493 | INIP | P23T-E | Human | Esophagus | ESCC | 3.09e-13 | 3.68e-01 | 0.108 |
| 58493 | INIP | P24T-E | Human | Esophagus | ESCC | 3.06e-18 | 3.06e-01 | 0.1287 |
| 58493 | INIP | P26T-E | Human | Esophagus | ESCC | 5.45e-18 | 3.02e-01 | 0.1276 |
| 58493 | INIP | P27T-E | Human | Esophagus | ESCC | 1.25e-13 | 2.60e-01 | 0.1055 |
| 58493 | INIP | P28T-E | Human | Esophagus | ESCC | 1.18e-25 | 4.39e-01 | 0.1149 |
| 58493 | INIP | P30T-E | Human | Esophagus | ESCC | 7.36e-27 | 7.90e-01 | 0.137 |
| 58493 | INIP | P31T-E | Human | Esophagus | ESCC | 3.35e-17 | 3.24e-01 | 0.1251 |
| 58493 | INIP | P32T-E | Human | Esophagus | ESCC | 1.47e-22 | 4.44e-01 | 0.1666 |
| 58493 | INIP | P36T-E | Human | Esophagus | ESCC | 4.25e-10 | 3.52e-01 | 0.1187 |
| 58493 | INIP | P37T-E | Human | Esophagus | ESCC | 9.25e-14 | 3.24e-01 | 0.1371 |
| 58493 | INIP | P39T-E | Human | Esophagus | ESCC | 6.03e-11 | 2.07e-01 | 0.0894 |
| 58493 | INIP | P40T-E | Human | Esophagus | ESCC | 1.41e-03 | 1.59e-01 | 0.109 |
| 58493 | INIP | P42T-E | Human | Esophagus | ESCC | 2.86e-10 | 2.87e-01 | 0.1175 |
| 58493 | INIP | P47T-E | Human | Esophagus | ESCC | 1.26e-16 | 2.40e-01 | 0.1067 |
| 58493 | INIP | P48T-E | Human | Esophagus | ESCC | 7.01e-17 | 1.70e-01 | 0.0959 |
| 58493 | INIP | P49T-E | Human | Esophagus | ESCC | 2.19e-09 | 6.58e-01 | 0.1768 |
| 58493 | INIP | P52T-E | Human | Esophagus | ESCC | 1.05e-17 | 4.10e-01 | 0.1555 |
| 58493 | INIP | P54T-E | Human | Esophagus | ESCC | 2.47e-05 | 1.67e-01 | 0.0975 |
| 58493 | INIP | P56T-E | Human | Esophagus | ESCC | 3.10e-03 | 4.67e-01 | 0.1613 |
| 58493 | INIP | P57T-E | Human | Esophagus | ESCC | 2.50e-16 | 7.85e-02 | 0.0926 |
| Page: 1 2 3 4 5 |
| Tissue | Expression Dynamics | Abbreviation |
| Esophagus | 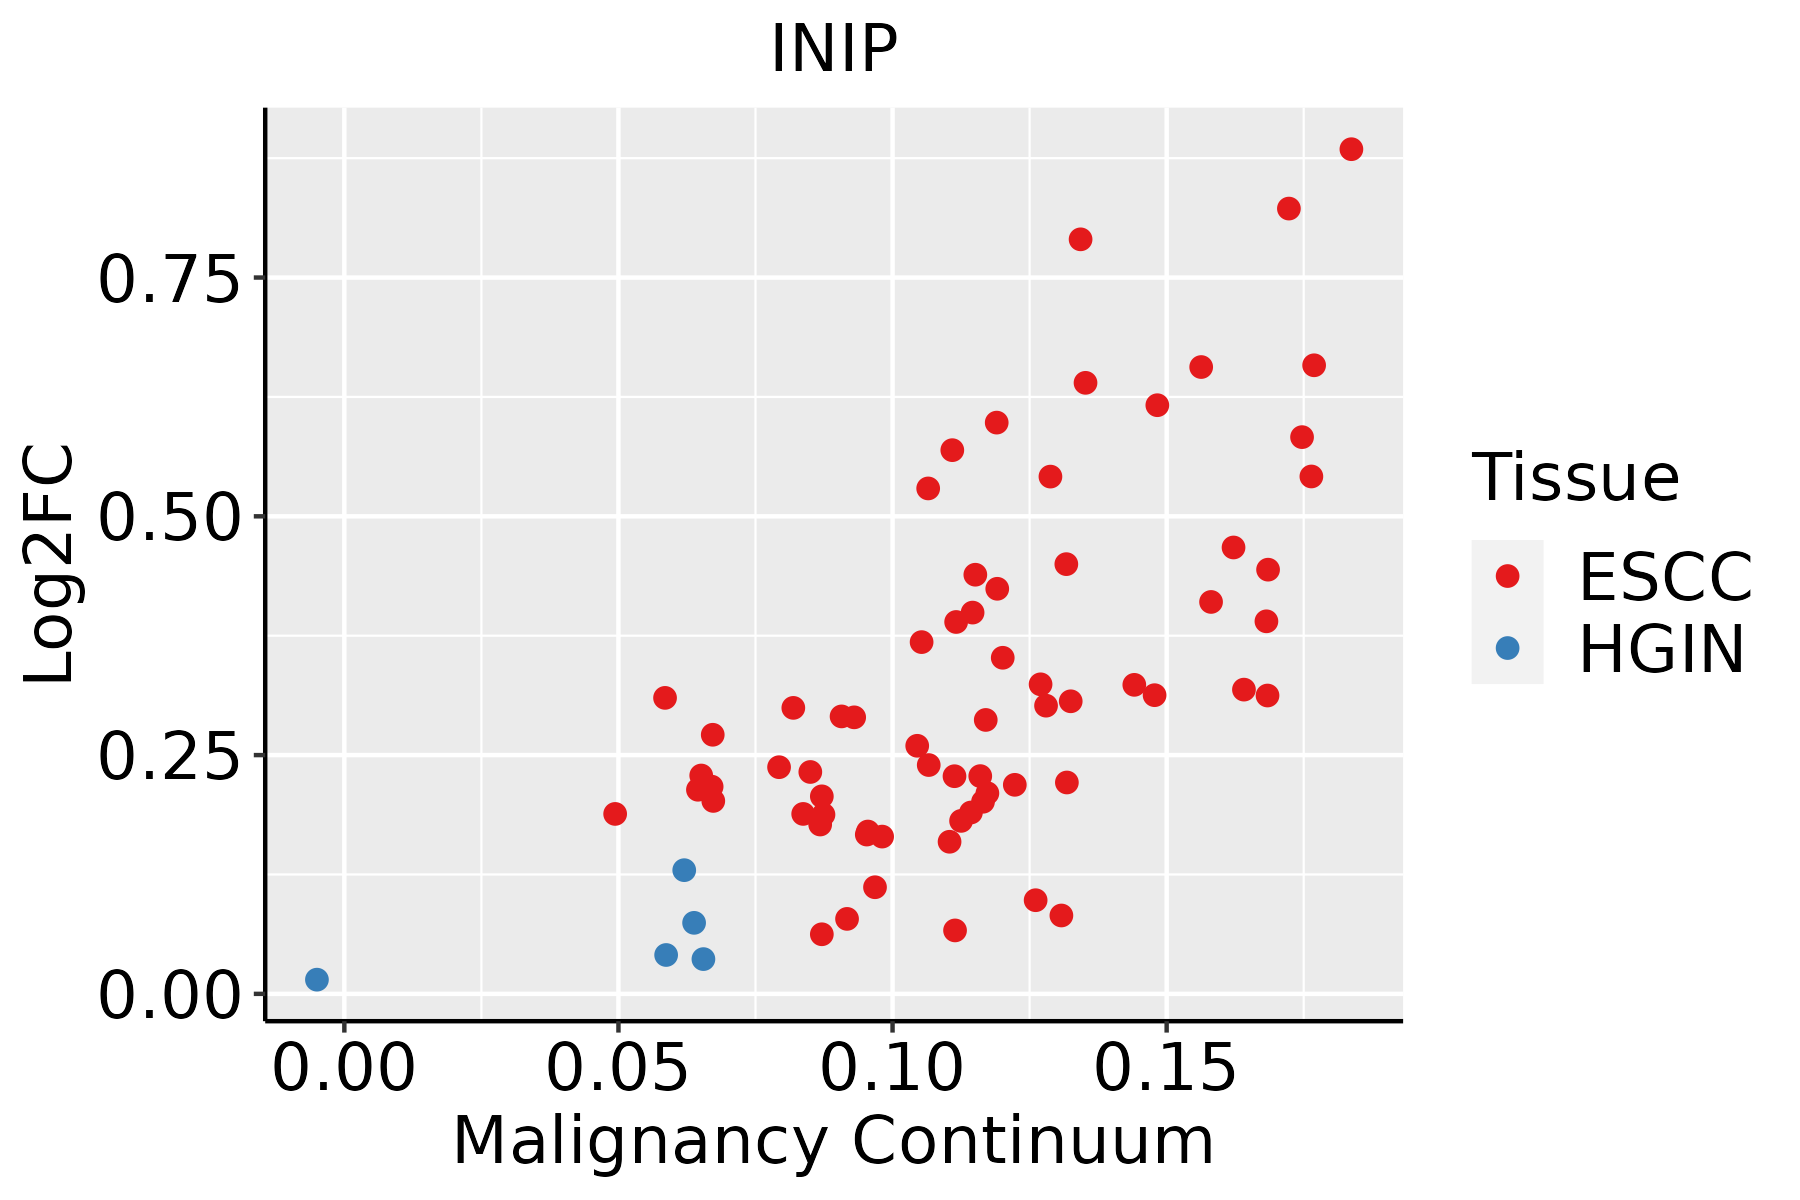 | ESCC: Esophageal squamous cell carcinoma |
| HGIN: High-grade intraepithelial neoplasias | ||
| LGIN: Low-grade intraepithelial neoplasias | ||
| Liver | 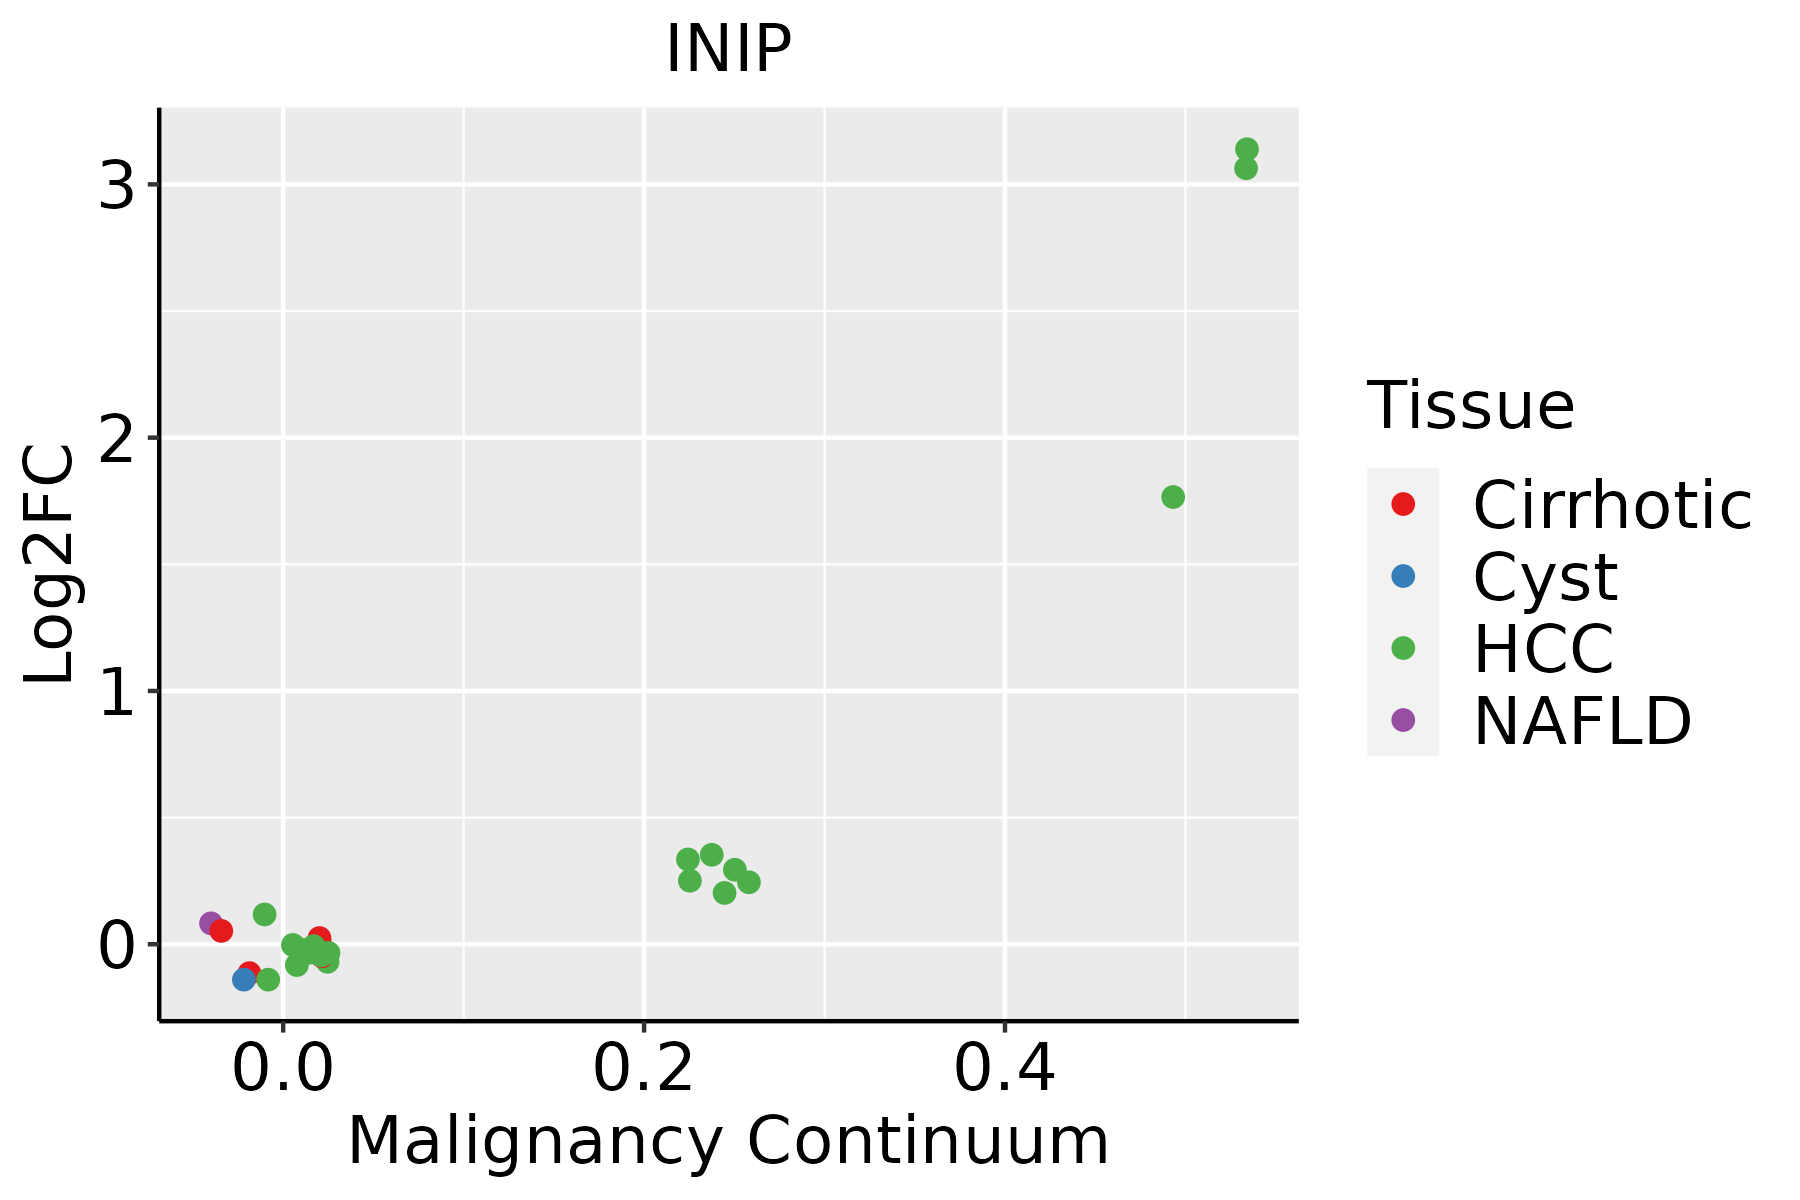 | HCC: Hepatocellular carcinoma |
| NAFLD: Non-alcoholic fatty liver disease | ||
| Oral Cavity | 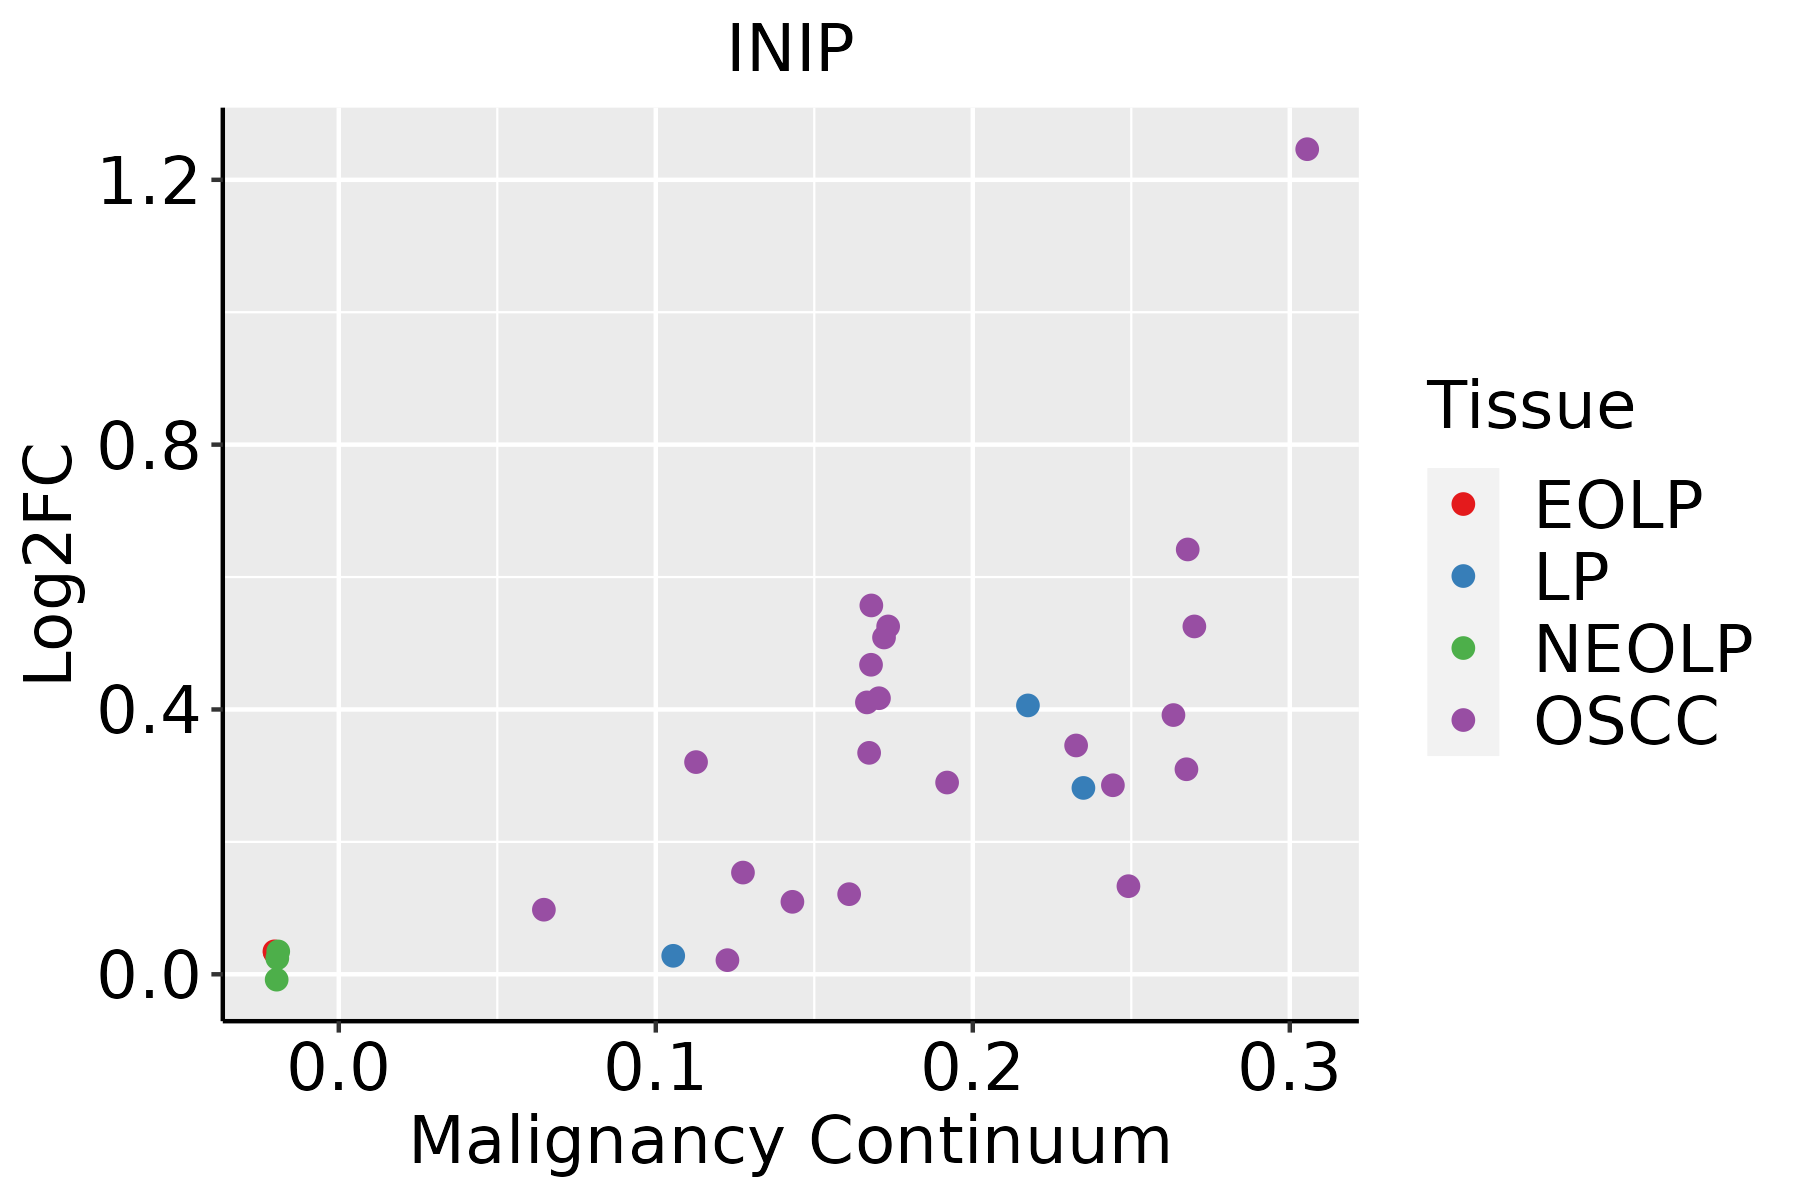 | EOLP: Erosive Oral lichen planus |
| LP: leukoplakia | ||
| NEOLP: Non-erosive oral lichen planus | ||
| OSCC: Oral squamous cell carcinoma |
| ∗log2FC in expression of this searched gene in stem-like cells from each diseased tissue sample relative to stem-like cells in normal samples in each tissue plotted against the malignancy continuum. Samples are colored based on if they are from different disease stage. |
Top |
Malignant transformation related pathway analysis |
| Find out the enriched GO biological processes and KEGG pathways involved in transition from healthy to precancer to cancer |
| Tissue | Disease Stage | Enriched GO biological Processes |
| Colorectum | AD |  |
| Colorectum | SER |  |
| Colorectum | MSS |  |
| Colorectum | MSI-H |  |
| Colorectum | FAP |  |
| ∗Top 15 enriched GO BP terms are showed in the bar plot of each disease state in each tissue. Each row represents a significant GO biological process which is colored according to the -log10(p.adjust). |
| Page: 1 2 3 4 5 6 7 8 9 |
| GO ID | Tissue | Disease Stage | Description | Gene Ratio | Bg Ratio | pvalue | p.adjust | Count |
| GO:001021217 | Esophagus | ESCC | response to ionizing radiation | 110/8552 | 148/18723 | 1.11e-12 | 4.78e-11 | 110 |
| GO:000931419 | Esophagus | ESCC | response to radiation | 277/8552 | 456/18723 | 4.42e-11 | 1.43e-09 | 277 |
| GO:001021211 | Liver | Cirrhotic | response to ionizing radiation | 53/4634 | 148/18723 | 1.70e-03 | 1.08e-02 | 53 |
| GO:001021221 | Liver | HCC | response to ionizing radiation | 89/7958 | 148/18723 | 1.10e-05 | 1.26e-04 | 89 |
| GO:00093146 | Liver | HCC | response to radiation | 223/7958 | 456/18723 | 3.08e-03 | 1.43e-02 | 223 |
| GO:00102128 | Oral cavity | OSCC | response to ionizing radiation | 99/7305 | 148/18723 | 5.49e-12 | 2.08e-10 | 99 |
| GO:000931416 | Oral cavity | OSCC | response to radiation | 241/7305 | 456/18723 | 9.76e-10 | 2.40e-08 | 241 |
| Page: 1 |
| Pathway ID | Tissue | Disease Stage | Description | Gene Ratio | Bg Ratio | pvalue | p.adjust | qvalue | Count |
| Page: 1 |
Top |
Cell-cell communication analysis |
| Identification of potential cell-cell interactions between two cell types and their ligand-receptor pairs for different disease states |
| Ligand | Receptor | LRpair | Pathway | Tissue | Disease Stage |
| Page: 1 |
Top |
Single-cell gene regulatory network inference analysis |
| Find out the significant the regulons (TFs) and the target genes of each regulon across cell types for different disease states |
| TF | Cell Type | Tissue | Disease Stage | Target Gene | RSS | Regulon Activity |
| ∗The dot plots of a searched regulon are shown for all cell subpopulations in each disease state of each tissue based on the regulon specific score inferred using pySCENIC and by calculating the average expression. |
| Page: 1 |
Top |
Somatic mutation of malignant transformation related genes |
| Annotation of somatic variants for genes involved in malignant transformation |
| Hugo Symbol | Variant Class | Variant Classification | dbSNP RS | HGVSc | HGVSp | HGVSp Short | SWISSPROT | BIOTYPE | SIFT | PolyPhen | Tumor Sample Barcode | Tissue | Histology | Sex | Age | Stage | Therapy Types | Drugs | Outcome |
| INIP | deletion | Frame_Shift_Del | novel | c.114delN | p.His39IlefsTer78 | p.H39Ifs*78 | Q9NRY2 | protein_coding | TCGA-D8-A27V-01 | Breast | breast invasive carcinoma | Female | <65 | I/II | Hormone Therapy | tamoxiphen | SD | ||
| INIP | SNV | Missense_Mutation | c.61N>A | p.Glu21Lys | p.E21K | Q9NRY2 | protein_coding | deleterious(0.01) | benign(0.201) | TCGA-EX-A1H6-01 | Cervix | cervical & endocervical cancer | Female | <65 | I/II | Unknown | Unknown | SD | |
| INIP | SNV | Missense_Mutation | c.80N>T | p.Arg27Ile | p.R27I | Q9NRY2 | protein_coding | deleterious(0) | possibly_damaging(0.555) | TCGA-AZ-4315-01 | Colorectum | colon adenocarcinoma | Male | <65 | I/II | Unknown | Unknown | SD | |
| INIP | SNV | Missense_Mutation | c.200N>G | p.Gln67Arg | p.Q67R | Q9NRY2 | protein_coding | deleterious(0.04) | probably_damaging(0.954) | TCGA-AG-3892-01 | Colorectum | rectum adenocarcinoma | Female | <65 | I/II | Unknown | Unknown | SD | |
| INIP | SNV | Missense_Mutation | c.284N>G | p.Leu95Arg | p.L95R | Q9NRY2 | protein_coding | deleterious(0) | possibly_damaging(0.553) | TCGA-AG-A002-01 | Colorectum | rectum adenocarcinoma | Male | <65 | I/II | Unknown | Unknown | SD | |
| INIP | SNV | Missense_Mutation | novel | c.133N>A | p.Ala45Thr | p.A45T | Q9NRY2 | protein_coding | tolerated(0.28) | benign(0.007) | TCGA-AG-A002-01 | Colorectum | rectum adenocarcinoma | Male | <65 | I/II | Unknown | Unknown | SD |
| INIP | SNV | Missense_Mutation | novel | c.224N>T | p.Ala75Val | p.A75V | Q9NRY2 | protein_coding | deleterious(0) | probably_damaging(0.986) | TCGA-AJ-A3BH-01 | Endometrium | uterine corpus endometrioid carcinoma | Female | Unknown | I/II | Unknown | Unknown | SD |
| INIP | SNV | Missense_Mutation | novel | c.287N>T | p.Pro96Leu | p.P96L | Q9NRY2 | protein_coding | deleterious(0) | possibly_damaging(0.451) | TCGA-AJ-A3EK-01 | Endometrium | uterine corpus endometrioid carcinoma | Female | <65 | I/II | Chemotherapy | carboplatin | CR |
| INIP | SNV | Missense_Mutation | c.134N>T | p.Ala45Val | p.A45V | Q9NRY2 | protein_coding | tolerated(0.06) | benign(0.007) | TCGA-AP-A051-01 | Endometrium | uterine corpus endometrioid carcinoma | Female | >=65 | I/II | Unknown | Unknown | SD | |
| INIP | SNV | Missense_Mutation | rs376380195 | c.175N>A | p.Ala59Thr | p.A59T | Q9NRY2 | protein_coding | tolerated(0.2) | benign(0.302) | TCGA-AP-A1DO-01 | Endometrium | uterine corpus endometrioid carcinoma | Female | <65 | I/II | Unknown | Unknown | SD |
| Page: 1 2 |
Top |
Related drugs of malignant transformation related genes |
| Identification of chemicals and drugs interact with genes involved in malignant transfromation |
| (DGIdb 4.0) |
| Entrez ID | Symbol | Category | Interaction Types | Drug Claim Name | Drug Name | PMIDs |
| Page: 1 |

Copyright 2023-Present -The University of Texas Health Science Center at Houston |