
|
|||||
|
 | |
| |
| |
| |
| |
| |
|
Gene: IMP4 |
Gene summary for IMP4 |
| Gene information | Species | Human | Gene symbol | IMP4 | Gene ID | 92856 |
| Gene name | IMP U3 small nucleolar ribonucleoprotein 4 | |
| Gene Alias | BXDC4 | |
| Cytomap | 2q21.1 | |
| Gene Type | protein-coding | GO ID | GO:0006139 | UniProtAcc | Q96G21 |
Top |
Malignant transformation analysis |
| Identification of the aberrant gene expression in precancerous and cancerous lesions by comparing the gene expression of stem-like cells in diseased tissues with normal stem cells |
| Entrez ID | Symbol | Replicates | Species | Organ | Tissue | Adj P-value | Log2FC | Malignancy |
| 92856 | IMP4 | P1T-E | Human | Esophagus | ESCC | 4.71e-21 | 6.62e-01 | 0.0875 |
| 92856 | IMP4 | P2T-E | Human | Esophagus | ESCC | 8.33e-24 | 5.88e-01 | 0.1177 |
| 92856 | IMP4 | P4T-E | Human | Esophagus | ESCC | 1.28e-46 | 1.44e+00 | 0.1323 |
| 92856 | IMP4 | P5T-E | Human | Esophagus | ESCC | 1.70e-56 | 1.21e+00 | 0.1327 |
| 92856 | IMP4 | P8T-E | Human | Esophagus | ESCC | 1.64e-33 | 6.43e-01 | 0.0889 |
| 92856 | IMP4 | P9T-E | Human | Esophagus | ESCC | 4.24e-19 | 6.02e-01 | 0.1131 |
| 92856 | IMP4 | P10T-E | Human | Esophagus | ESCC | 2.93e-55 | 1.05e+00 | 0.116 |
| 92856 | IMP4 | P11T-E | Human | Esophagus | ESCC | 1.21e-17 | 1.04e+00 | 0.1426 |
| 92856 | IMP4 | P12T-E | Human | Esophagus | ESCC | 3.12e-42 | 1.04e+00 | 0.1122 |
| 92856 | IMP4 | P15T-E | Human | Esophagus | ESCC | 6.76e-49 | 9.87e-01 | 0.1149 |
| 92856 | IMP4 | P16T-E | Human | Esophagus | ESCC | 3.96e-29 | 7.44e-01 | 0.1153 |
| 92856 | IMP4 | P17T-E | Human | Esophagus | ESCC | 1.95e-17 | 8.60e-01 | 0.1278 |
| 92856 | IMP4 | P19T-E | Human | Esophagus | ESCC | 7.63e-11 | 9.18e-01 | 0.1662 |
| 92856 | IMP4 | P20T-E | Human | Esophagus | ESCC | 9.60e-25 | 6.41e-01 | 0.1124 |
| 92856 | IMP4 | P21T-E | Human | Esophagus | ESCC | 2.17e-66 | 1.39e+00 | 0.1617 |
| 92856 | IMP4 | P22T-E | Human | Esophagus | ESCC | 3.39e-54 | 9.50e-01 | 0.1236 |
| 92856 | IMP4 | P23T-E | Human | Esophagus | ESCC | 2.24e-45 | 1.32e+00 | 0.108 |
| 92856 | IMP4 | P24T-E | Human | Esophagus | ESCC | 4.01e-53 | 1.14e+00 | 0.1287 |
| 92856 | IMP4 | P26T-E | Human | Esophagus | ESCC | 1.99e-37 | 8.71e-01 | 0.1276 |
| 92856 | IMP4 | P27T-E | Human | Esophagus | ESCC | 1.01e-19 | 4.85e-01 | 0.1055 |
| Page: 1 2 3 4 5 6 7 |
| Tissue | Expression Dynamics | Abbreviation |
| Colorectum (GSE201348) | 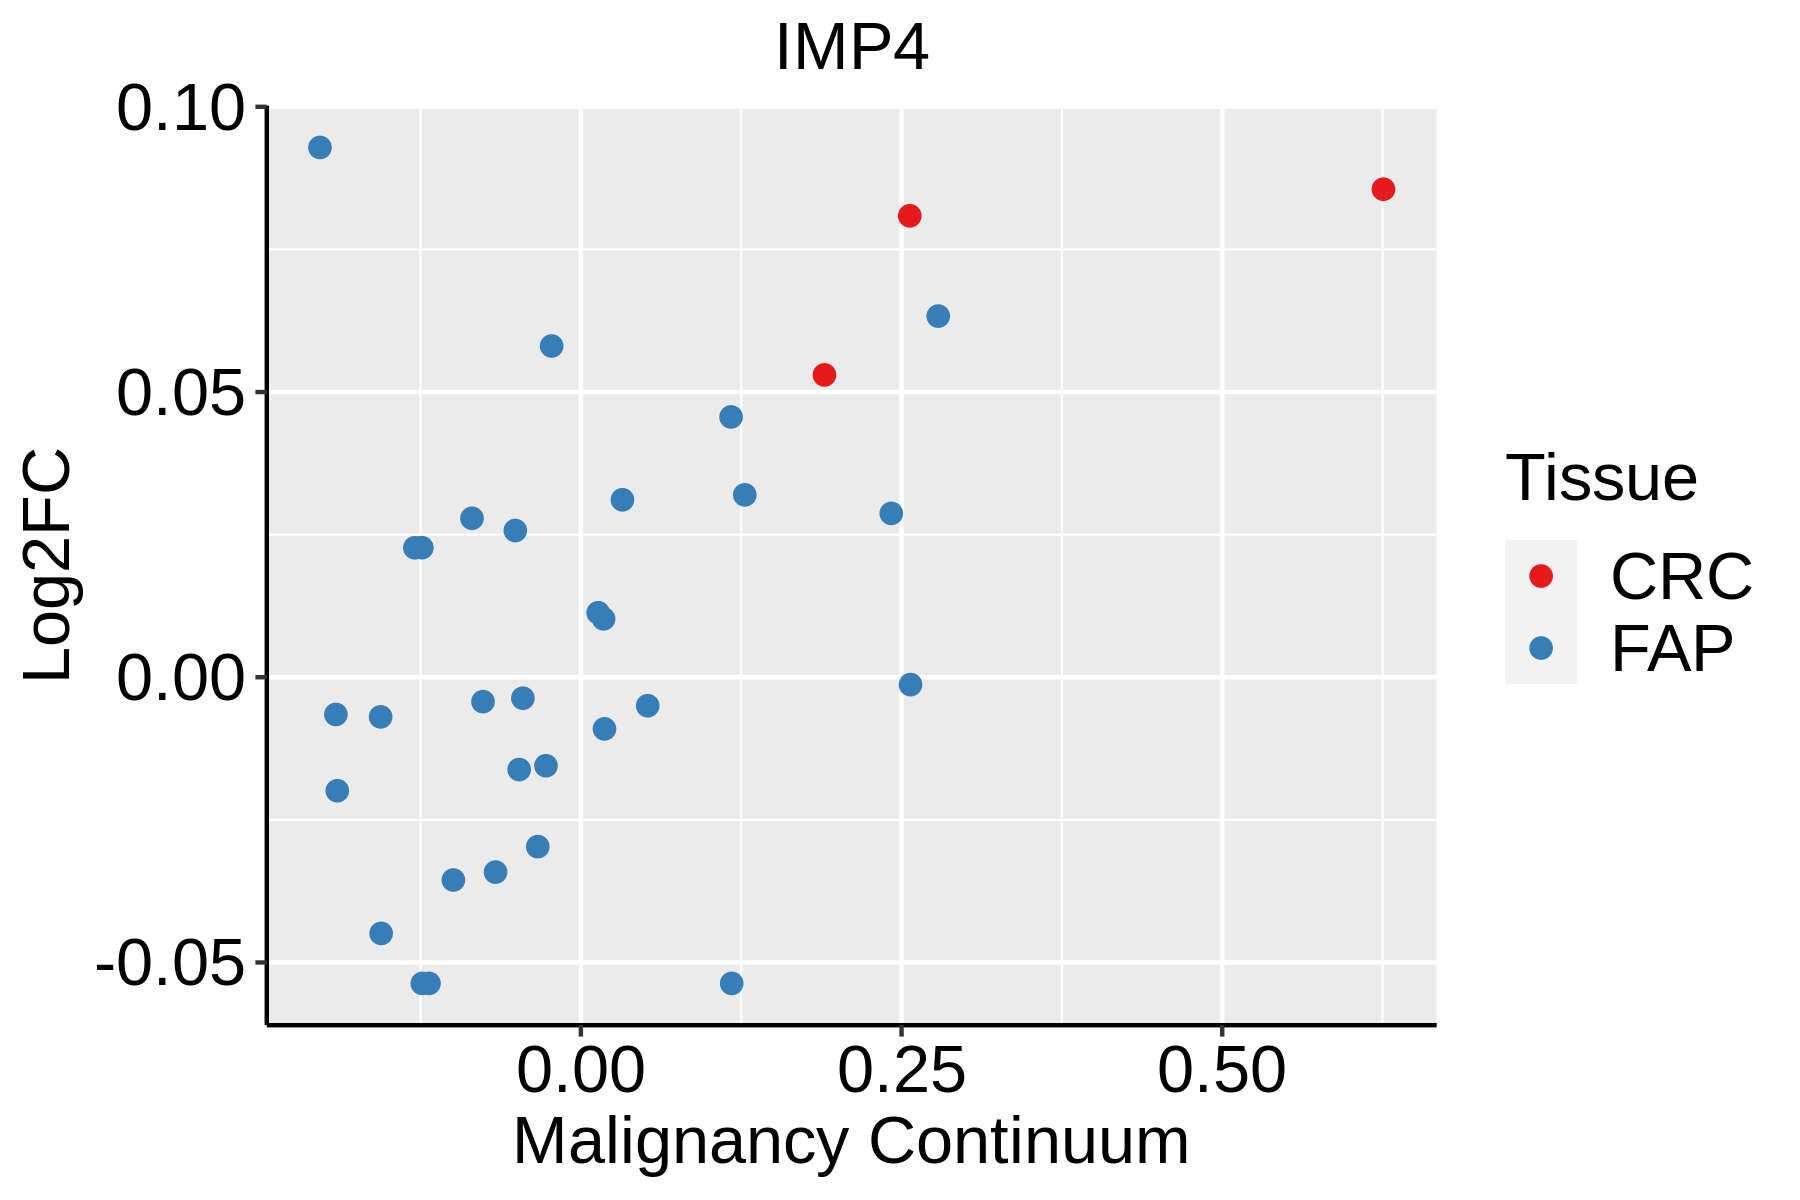 | FAP: Familial adenomatous polyposis |
| CRC: Colorectal cancer | ||
| Colorectum (HTA11) |  | AD: Adenomas |
| SER: Sessile serrated lesions | ||
| MSI-H: Microsatellite-high colorectal cancer | ||
| MSS: Microsatellite stable colorectal cancer | ||
| Esophagus | 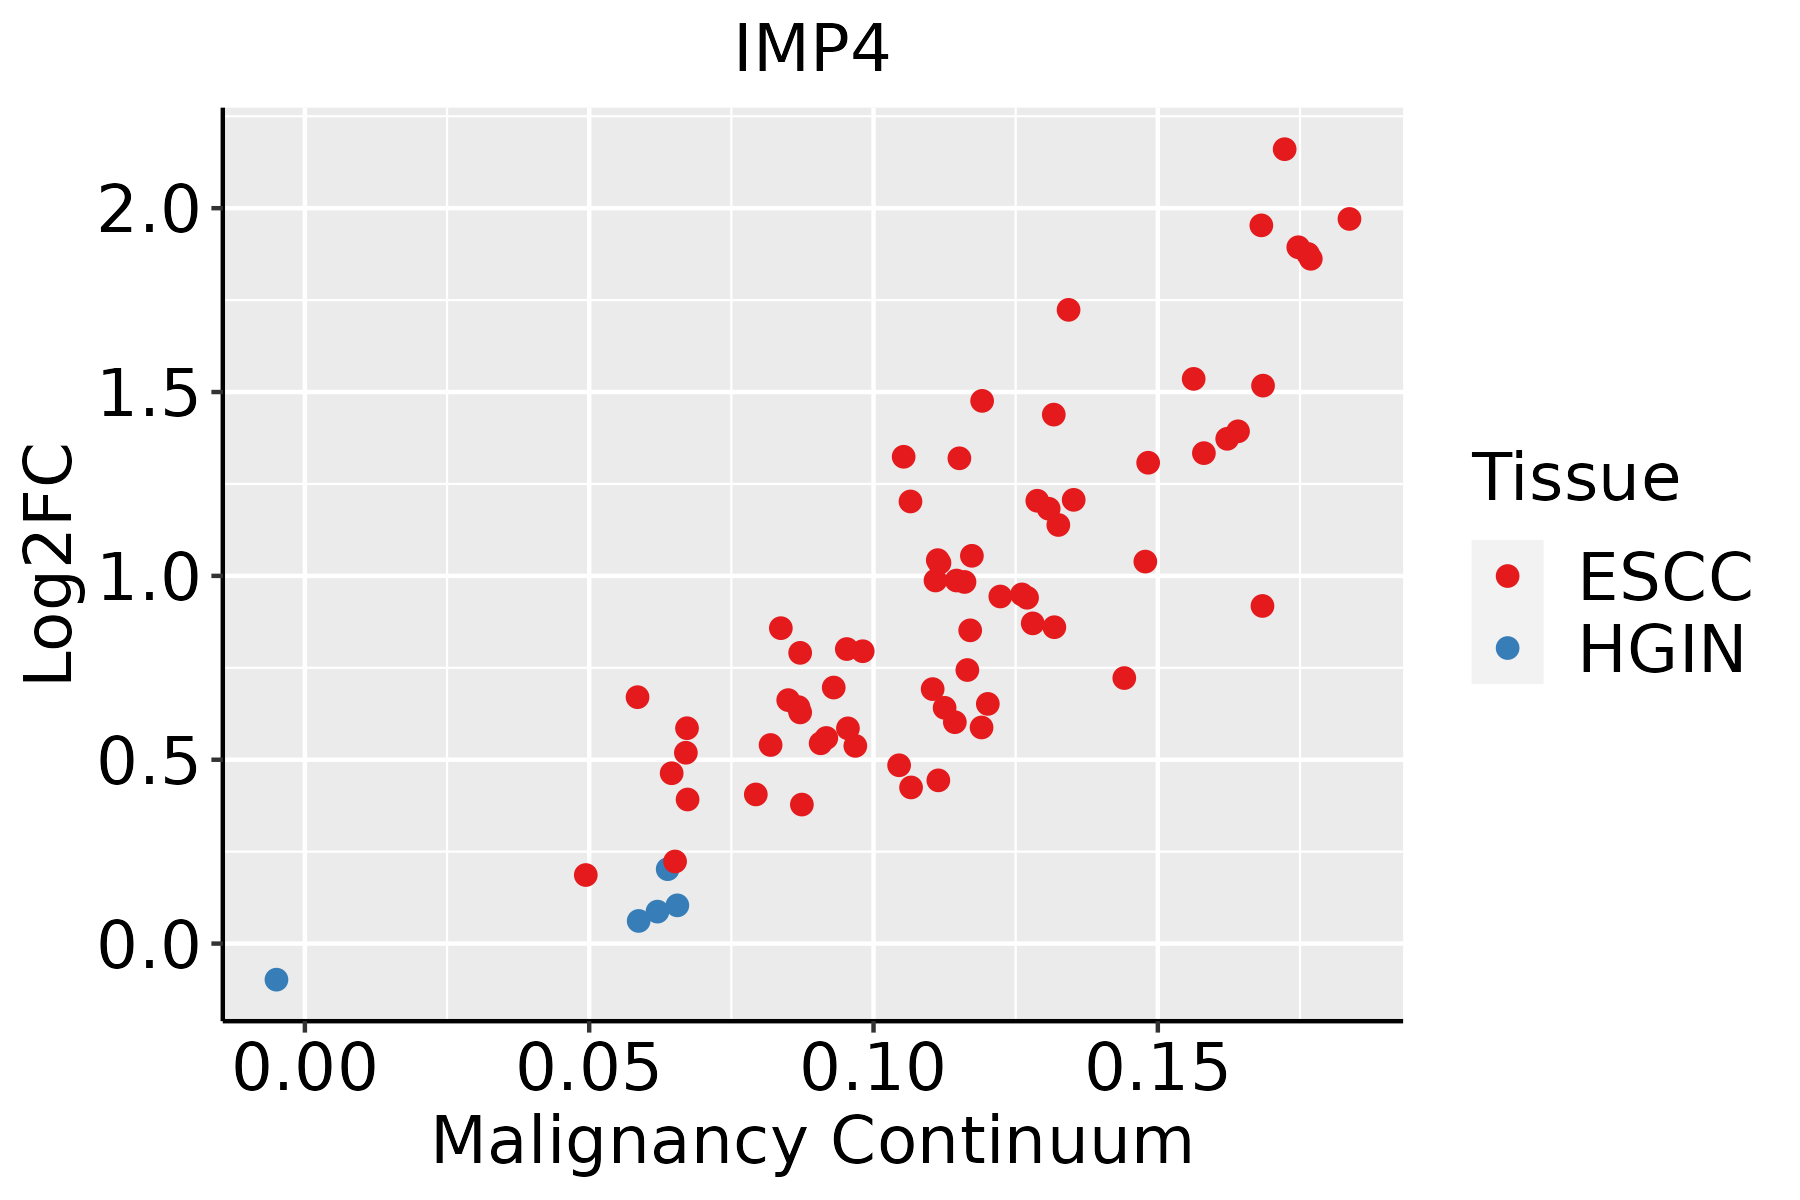 | ESCC: Esophageal squamous cell carcinoma |
| HGIN: High-grade intraepithelial neoplasias | ||
| LGIN: Low-grade intraepithelial neoplasias | ||
| Liver | 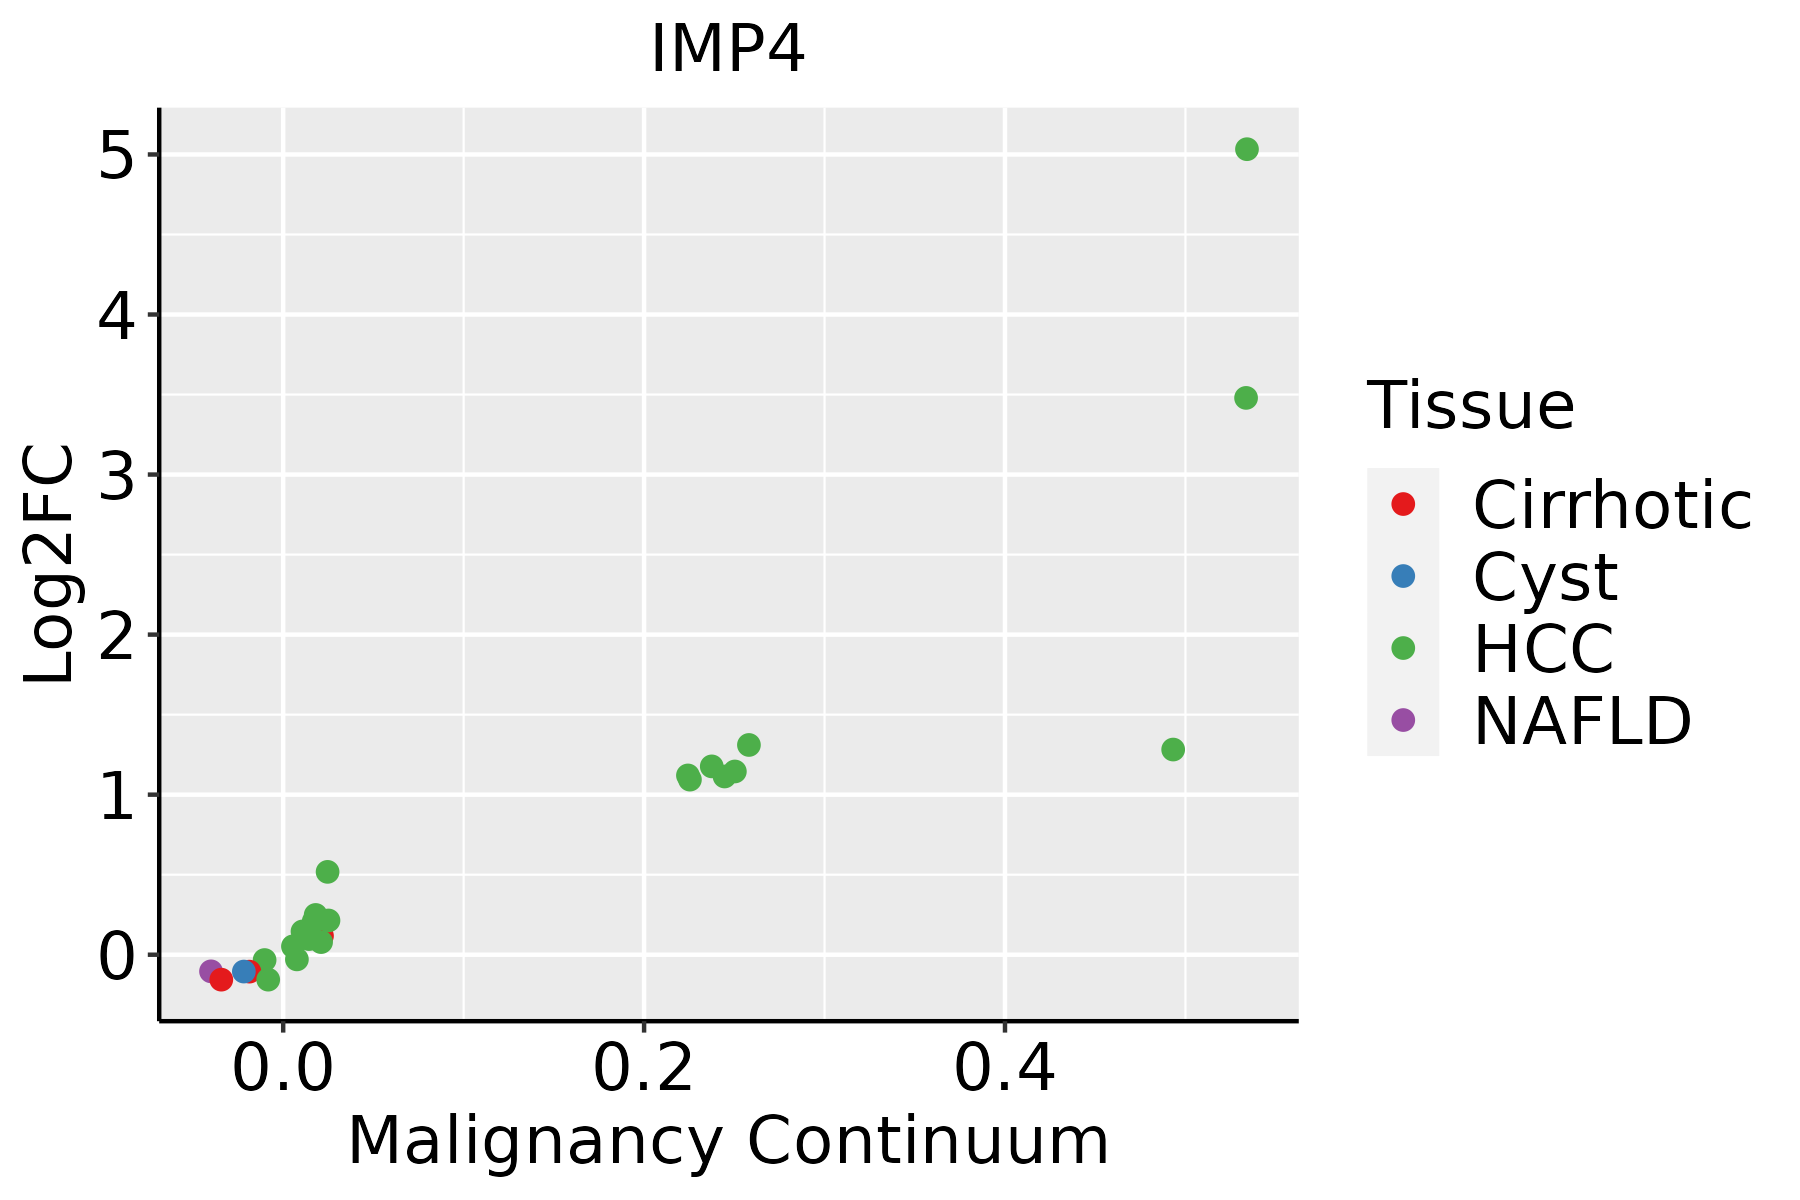 | HCC: Hepatocellular carcinoma |
| NAFLD: Non-alcoholic fatty liver disease | ||
| Oral Cavity |  | EOLP: Erosive Oral lichen planus |
| LP: leukoplakia | ||
| NEOLP: Non-erosive oral lichen planus | ||
| OSCC: Oral squamous cell carcinoma | ||
| Skin |  | AK: Actinic keratosis |
| cSCC: Cutaneous squamous cell carcinoma | ||
| SCCIS:squamous cell carcinoma in situ | ||
| Thyroid | 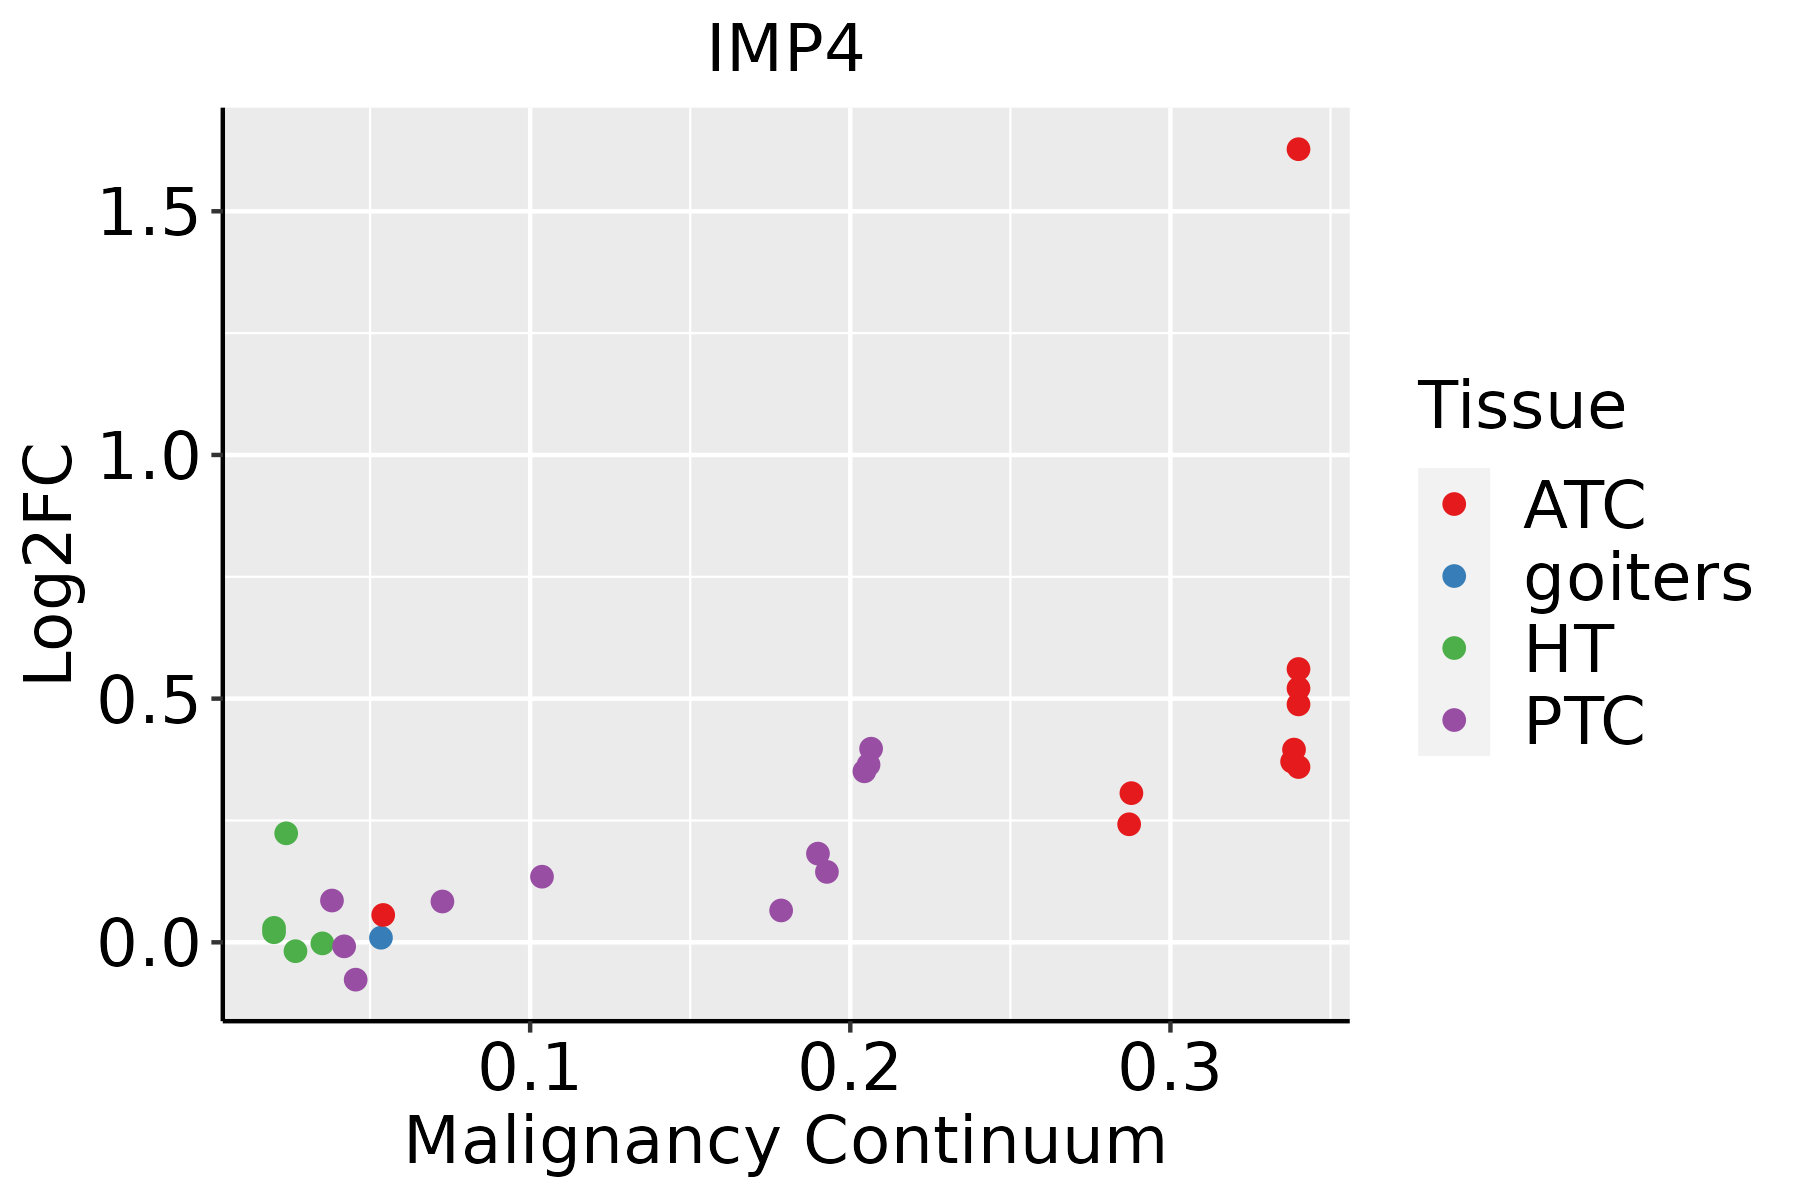 | ATC: Anaplastic thyroid cancer |
| HT: Hashimoto's thyroiditis | ||
| PTC: Papillary thyroid cancer |
| ∗log2FC in expression of this searched gene in stem-like cells from each diseased tissue sample relative to stem-like cells in normal samples in each tissue plotted against the malignancy continuum. Samples are colored based on if they are from different disease stage. |
Top |
Malignant transformation related pathway analysis |
| Find out the enriched GO biological processes and KEGG pathways involved in transition from healthy to precancer to cancer |
| Tissue | Disease Stage | Enriched GO biological Processes |
| Colorectum | AD |  |
| Colorectum | SER |  |
| Colorectum | MSS |  |
| Colorectum | MSI-H |  |
| Colorectum | FAP |  |
| ∗Top 15 enriched GO BP terms are showed in the bar plot of each disease state in each tissue. Each row represents a significant GO biological process which is colored according to the -log10(p.adjust). |
| Page: 1 2 3 4 5 6 7 8 9 |
| GO ID | Tissue | Disease Stage | Description | Gene Ratio | Bg Ratio | pvalue | p.adjust | Count |
| GO:0022613 | Colorectum | AD | ribonucleoprotein complex biogenesis | 151/3918 | 463/18723 | 1.96e-09 | 1.39e-07 | 151 |
| GO:0042254 | Colorectum | AD | ribosome biogenesis | 84/3918 | 299/18723 | 1.82e-03 | 1.50e-02 | 84 |
| GO:00226132 | Colorectum | MSS | ribonucleoprotein complex biogenesis | 144/3467 | 463/18723 | 2.76e-11 | 3.67e-09 | 144 |
| GO:00422542 | Colorectum | MSS | ribosome biogenesis | 79/3467 | 299/18723 | 4.32e-04 | 5.23e-03 | 79 |
| GO:0006364 | Colorectum | MSS | rRNA processing | 58/3467 | 225/18723 | 4.17e-03 | 3.03e-02 | 58 |
| GO:0016072 | Colorectum | MSS | rRNA metabolic process | 60/3467 | 236/18723 | 5.01e-03 | 3.46e-02 | 60 |
| GO:00226133 | Colorectum | MSI-H | ribonucleoprotein complex biogenesis | 95/1319 | 463/18723 | 1.04e-21 | 8.32e-19 | 95 |
| GO:00422543 | Colorectum | MSI-H | ribosome biogenesis | 54/1319 | 299/18723 | 1.27e-10 | 2.07e-08 | 54 |
| GO:00063641 | Colorectum | MSI-H | rRNA processing | 39/1319 | 225/18723 | 1.45e-07 | 1.32e-05 | 39 |
| GO:00160721 | Colorectum | MSI-H | rRNA metabolic process | 39/1319 | 236/18723 | 5.20e-07 | 3.91e-05 | 39 |
| GO:0034470 | Colorectum | MSI-H | ncRNA processing | 48/1319 | 395/18723 | 1.54e-04 | 4.47e-03 | 48 |
| GO:0034660 | Colorectum | MSI-H | ncRNA metabolic process | 53/1319 | 485/18723 | 9.66e-04 | 1.68e-02 | 53 |
| GO:0022613111 | Esophagus | ESCC | ribonucleoprotein complex biogenesis | 365/8552 | 463/18723 | 1.74e-49 | 1.11e-45 | 365 |
| GO:0042254111 | Esophagus | ESCC | ribosome biogenesis | 252/8552 | 299/18723 | 3.27e-44 | 1.04e-40 | 252 |
| GO:003447015 | Esophagus | ESCC | ncRNA processing | 300/8552 | 395/18723 | 3.09e-35 | 3.26e-32 | 300 |
| GO:0016072110 | Esophagus | ESCC | rRNA metabolic process | 197/8552 | 236/18723 | 1.31e-33 | 1.18e-30 | 197 |
| GO:0006364110 | Esophagus | ESCC | rRNA processing | 189/8552 | 225/18723 | 4.88e-33 | 3.87e-30 | 189 |
| GO:003466012 | Esophagus | ESCC | ncRNA metabolic process | 346/8552 | 485/18723 | 4.35e-31 | 2.51e-28 | 346 |
| GO:0042176111 | Esophagus | ESCC | regulation of protein catabolic process | 280/8552 | 391/18723 | 8.65e-26 | 2.39e-23 | 280 |
| GO:0009895111 | Esophagus | ESCC | negative regulation of catabolic process | 201/8552 | 320/18723 | 3.88e-10 | 1.05e-08 | 201 |
| Page: 1 2 3 4 |
| Pathway ID | Tissue | Disease Stage | Description | Gene Ratio | Bg Ratio | pvalue | p.adjust | qvalue | Count |
| Page: 1 |
Top |
Cell-cell communication analysis |
| Identification of potential cell-cell interactions between two cell types and their ligand-receptor pairs for different disease states |
| Ligand | Receptor | LRpair | Pathway | Tissue | Disease Stage |
| Page: 1 |
Top |
Single-cell gene regulatory network inference analysis |
| Find out the significant the regulons (TFs) and the target genes of each regulon across cell types for different disease states |
| TF | Cell Type | Tissue | Disease Stage | Target Gene | RSS | Regulon Activity |
| ∗The dot plots of a searched regulon are shown for all cell subpopulations in each disease state of each tissue based on the regulon specific score inferred using pySCENIC and by calculating the average expression. |
| Page: 1 |
Top |
Somatic mutation of malignant transformation related genes |
| Annotation of somatic variants for genes involved in malignant transformation |
| Hugo Symbol | Variant Class | Variant Classification | dbSNP RS | HGVSc | HGVSp | HGVSp Short | SWISSPROT | BIOTYPE | SIFT | PolyPhen | Tumor Sample Barcode | Tissue | Histology | Sex | Age | Stage | Therapy Types | Drugs | Outcome |
| IMP4 | SNV | Missense_Mutation | rs775933151 | c.811N>C | p.Val271Leu | p.V271L | Q96G21 | protein_coding | tolerated(0.23) | benign(0.017) | TCGA-AR-A1AO-01 | Breast | breast invasive carcinoma | Female | <65 | I/II | Chemotherapy | doxorubicin | SD |
| IMP4 | insertion | In_Frame_Ins | novel | c.770_771insCACAGATTCTCCCGGACCCACGTGGAAGCG | p.Met257delinsIleThrAspSerProGlyProThrTrpLysArg | p.M257delinsITDSPGPTWKR | Q96G21 | protein_coding | TCGA-A2-A0CP-01 | Breast | breast invasive carcinoma | Female | <65 | I/II | Chemotherapy | cytoxan | SD | ||
| IMP4 | SNV | Missense_Mutation | rs759092541 | c.673N>A | p.Asp225Asn | p.D225N | Q96G21 | protein_coding | deleterious(0) | probably_damaging(0.972) | TCGA-AA-3811-01 | Colorectum | colon adenocarcinoma | Female | >=65 | III/IV | Unknown | Unknown | PD |
| IMP4 | SNV | Missense_Mutation | rs142127211 | c.338G>A | p.Arg113Gln | p.R113Q | Q96G21 | protein_coding | tolerated(0.06) | benign(0.298) | TCGA-AA-3984-01 | Colorectum | colon adenocarcinoma | Female | <65 | I/II | Unknown | Unknown | SD |
| IMP4 | SNV | Missense_Mutation | rs144350259 | c.581N>A | p.Arg194His | p.R194H | Q96G21 | protein_coding | deleterious(0.03) | benign(0.076) | TCGA-CM-6162-01 | Colorectum | colon adenocarcinoma | Female | <65 | III/IV | Chemotherapy | oxaliplatin | SD |
| IMP4 | SNV | Missense_Mutation | c.324C>G | p.Phe108Leu | p.F108L | Q96G21 | protein_coding | tolerated(0.23) | benign(0.06) | TCGA-G4-6625-01 | Colorectum | colon adenocarcinoma | Female | >=65 | I/II | Unknown | Unknown | PD | |
| IMP4 | SNV | Missense_Mutation | c.119G>T | p.Arg40Leu | p.R40L | Q96G21 | protein_coding | deleterious(0) | benign(0) | TCGA-AX-A0IW-01 | Endometrium | uterine corpus endometrioid carcinoma | Female | >=65 | III/IV | Unspecific | Carboplatin & Paclitaxel | SD | |
| IMP4 | SNV | Missense_Mutation | c.820N>T | p.Arg274Cys | p.R274C | Q96G21 | protein_coding | tolerated(0.06) | benign(0.225) | TCGA-AX-A1CE-01 | Endometrium | uterine corpus endometrioid carcinoma | Female | <65 | I/II | Unspecific | Paclitaxel | SD | |
| IMP4 | SNV | Missense_Mutation | rs117152505 | c.403G>A | p.Asp135Asn | p.D135N | Q96G21 | protein_coding | deleterious(0) | possibly_damaging(0.903) | TCGA-AX-A2HC-01 | Endometrium | uterine corpus endometrioid carcinoma | Female | <65 | III/IV | Chemotherapy | paclitaxel | PD |
| IMP4 | SNV | Missense_Mutation | rs775723557 | c.821N>A | p.Arg274His | p.R274H | Q96G21 | protein_coding | tolerated(0.29) | benign(0.003) | TCGA-AX-A2HJ-01 | Endometrium | uterine corpus endometrioid carcinoma | Female | <65 | I/II | Unknown | Unknown | SD |
| Page: 1 2 3 4 |
Top |
Related drugs of malignant transformation related genes |
| Identification of chemicals and drugs interact with genes involved in malignant transfromation |
| (DGIdb 4.0) |
| Entrez ID | Symbol | Category | Interaction Types | Drug Claim Name | Drug Name | PMIDs |
| Page: 1 |

Copyright 2023-Present -The University of Texas Health Science Center at Houston |