
|
|||||
|
 | |
| |
| |
| |
| |
| |
|
Gene: IMP3 |
Gene summary for IMP3 |
| Gene information | Species | Human | Gene symbol | IMP3 | Gene ID | 55272 |
| Gene name | IMP U3 small nucleolar ribonucleoprotein 3 | |
| Gene Alias | BRMS2 | |
| Cytomap | 15q24.2 | |
| Gene Type | protein-coding | GO ID | GO:0006139 | UniProtAcc | Q9NV31 |
Top |
Malignant transformation analysis |
| Identification of the aberrant gene expression in precancerous and cancerous lesions by comparing the gene expression of stem-like cells in diseased tissues with normal stem cells |
| Entrez ID | Symbol | Replicates | Species | Organ | Tissue | Adj P-value | Log2FC | Malignancy |
| 55272 | IMP3 | P19T-E | Human | Esophagus | ESCC | 6.46e-14 | 1.42e+00 | 0.1662 |
| 55272 | IMP3 | P20T-E | Human | Esophagus | ESCC | 8.16e-42 | 9.27e-01 | 0.1124 |
| 55272 | IMP3 | P21T-E | Human | Esophagus | ESCC | 7.67e-53 | 1.17e+00 | 0.1617 |
| 55272 | IMP3 | P22T-E | Human | Esophagus | ESCC | 4.33e-50 | 9.90e-01 | 0.1236 |
| 55272 | IMP3 | P23T-E | Human | Esophagus | ESCC | 1.25e-52 | 1.43e+00 | 0.108 |
| 55272 | IMP3 | P24T-E | Human | Esophagus | ESCC | 6.49e-29 | 7.99e-01 | 0.1287 |
| 55272 | IMP3 | P26T-E | Human | Esophagus | ESCC | 3.78e-81 | 1.57e+00 | 0.1276 |
| 55272 | IMP3 | P27T-E | Human | Esophagus | ESCC | 1.54e-25 | 6.74e-01 | 0.1055 |
| 55272 | IMP3 | P28T-E | Human | Esophagus | ESCC | 6.71e-49 | 1.13e+00 | 0.1149 |
| 55272 | IMP3 | P30T-E | Human | Esophagus | ESCC | 2.17e-39 | 1.58e+00 | 0.137 |
| 55272 | IMP3 | P31T-E | Human | Esophagus | ESCC | 6.93e-54 | 1.13e+00 | 0.1251 |
| 55272 | IMP3 | P32T-E | Human | Esophagus | ESCC | 4.41e-40 | 1.07e+00 | 0.1666 |
| 55272 | IMP3 | P36T-E | Human | Esophagus | ESCC | 1.51e-23 | 8.18e-01 | 0.1187 |
| 55272 | IMP3 | P37T-E | Human | Esophagus | ESCC | 1.49e-33 | 9.23e-01 | 0.1371 |
| 55272 | IMP3 | P38T-E | Human | Esophagus | ESCC | 2.55e-25 | 1.45e+00 | 0.127 |
| 55272 | IMP3 | P39T-E | Human | Esophagus | ESCC | 3.76e-24 | 6.43e-01 | 0.0894 |
| 55272 | IMP3 | P40T-E | Human | Esophagus | ESCC | 9.33e-20 | 5.53e-01 | 0.109 |
| 55272 | IMP3 | P42T-E | Human | Esophagus | ESCC | 3.58e-23 | 8.19e-01 | 0.1175 |
| 55272 | IMP3 | P44T-E | Human | Esophagus | ESCC | 2.20e-16 | 3.76e-01 | 0.1096 |
| 55272 | IMP3 | P47T-E | Human | Esophagus | ESCC | 8.89e-23 | 6.39e-01 | 0.1067 |
| Page: 1 2 3 4 5 6 7 8 |
| Tissue | Expression Dynamics | Abbreviation |
| Esophagus | 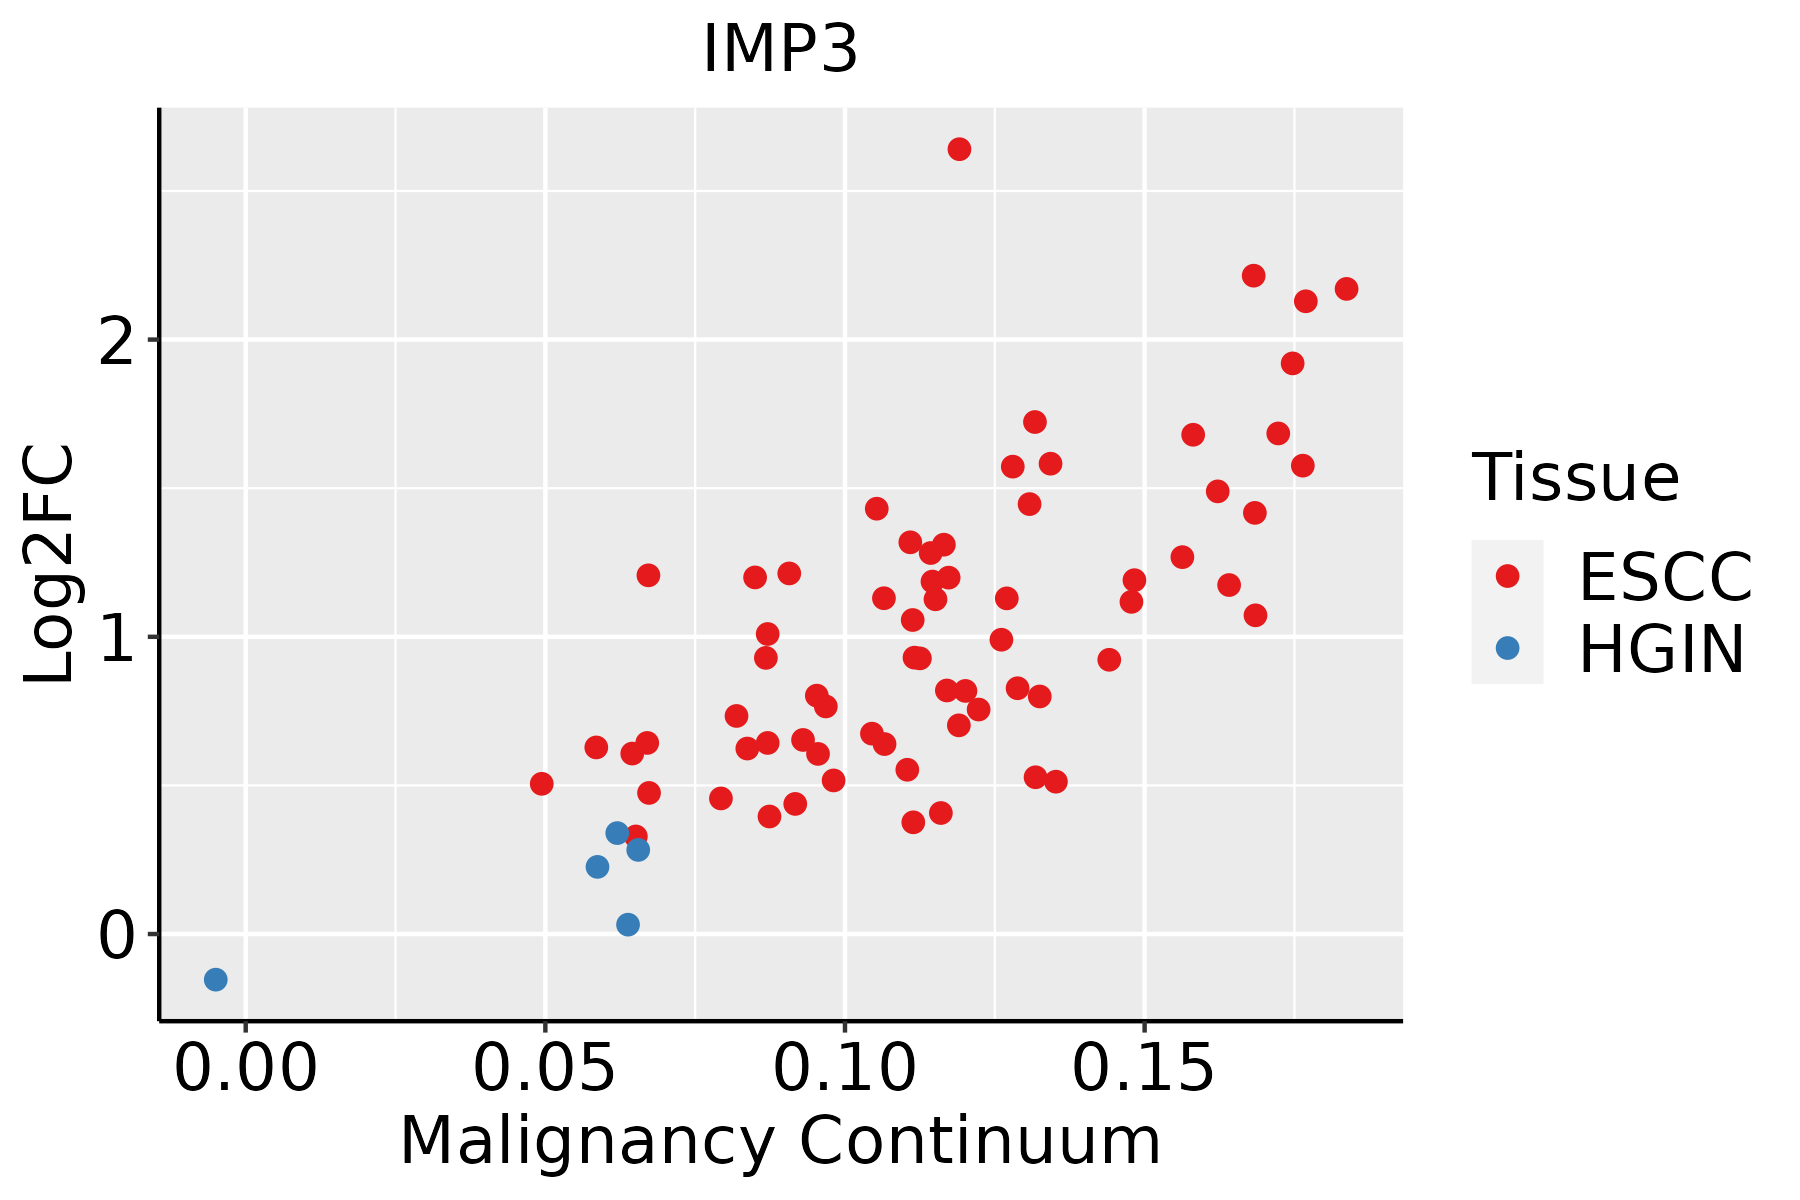 | ESCC: Esophageal squamous cell carcinoma |
| HGIN: High-grade intraepithelial neoplasias | ||
| LGIN: Low-grade intraepithelial neoplasias | ||
| Liver | 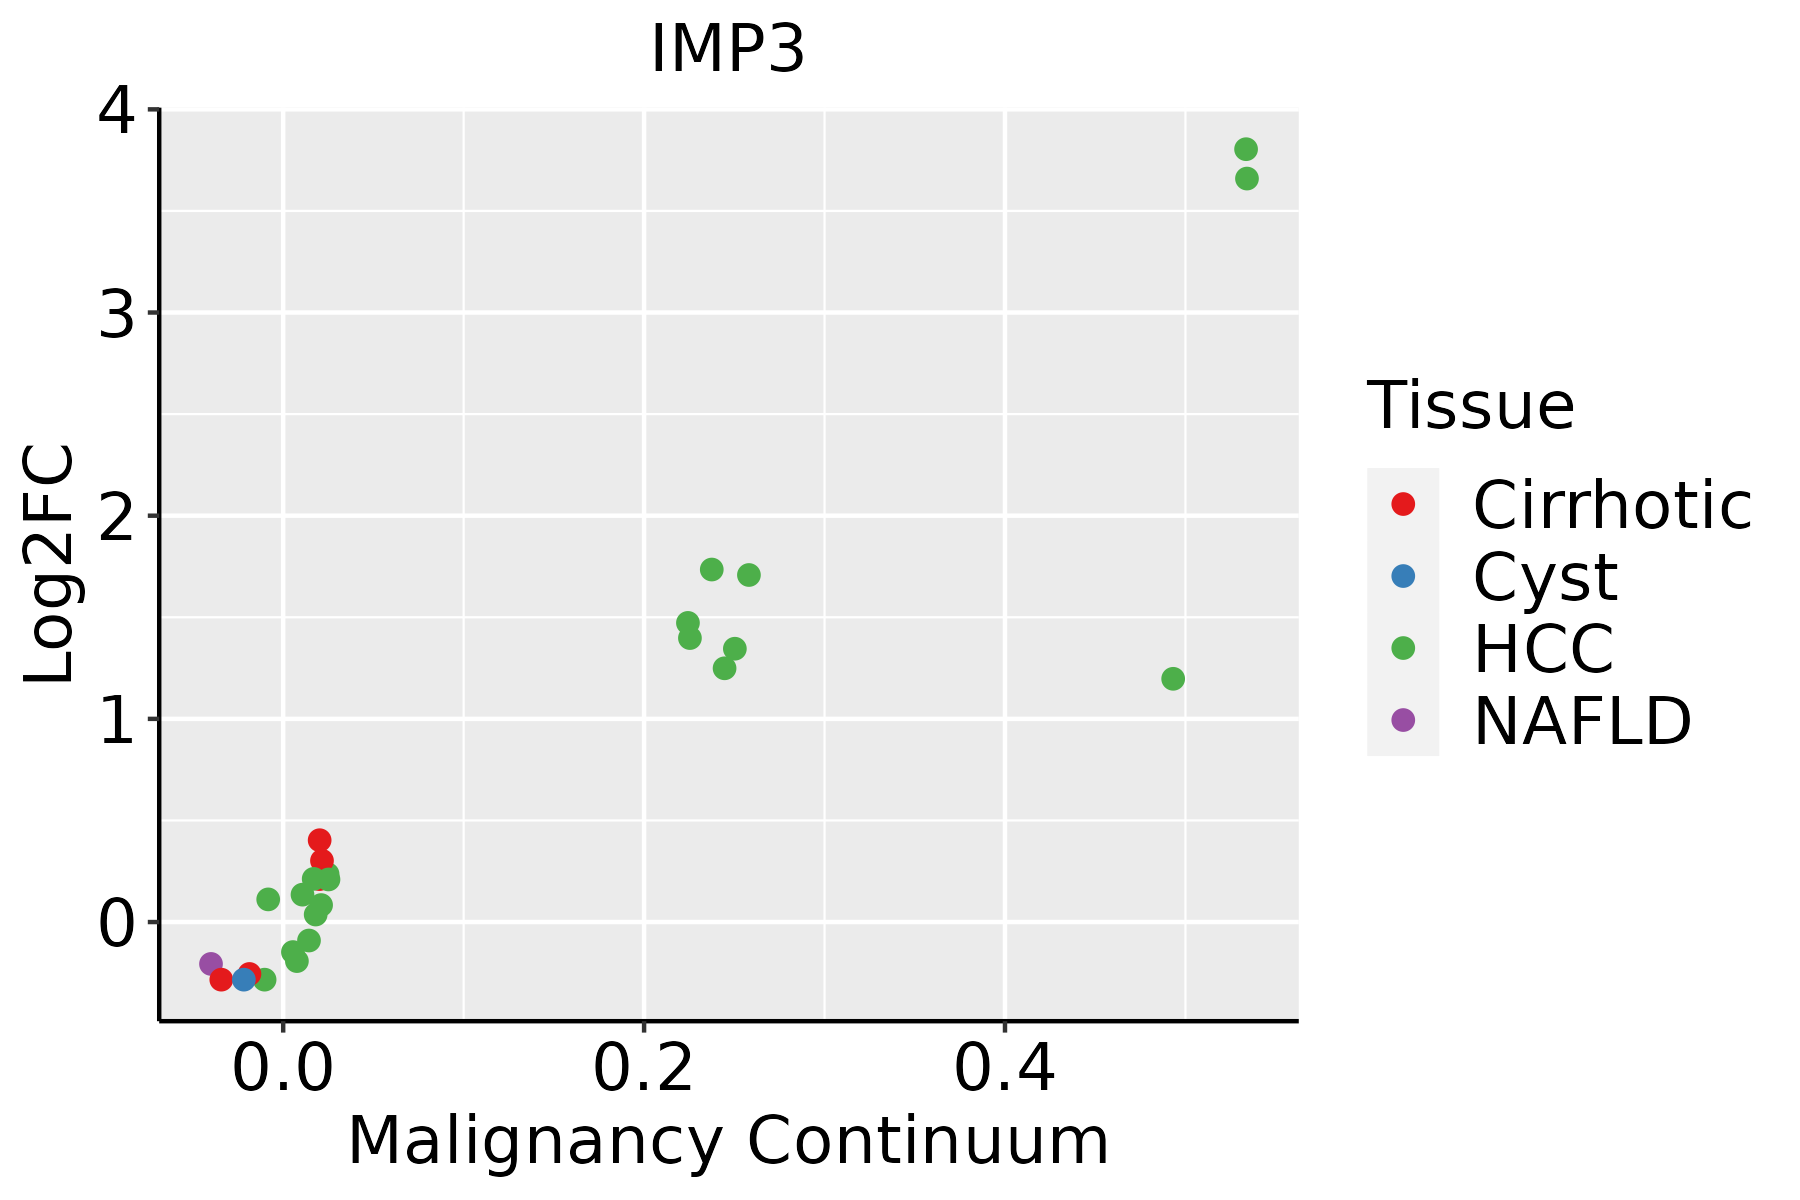 | HCC: Hepatocellular carcinoma |
| NAFLD: Non-alcoholic fatty liver disease | ||
| Oral Cavity | 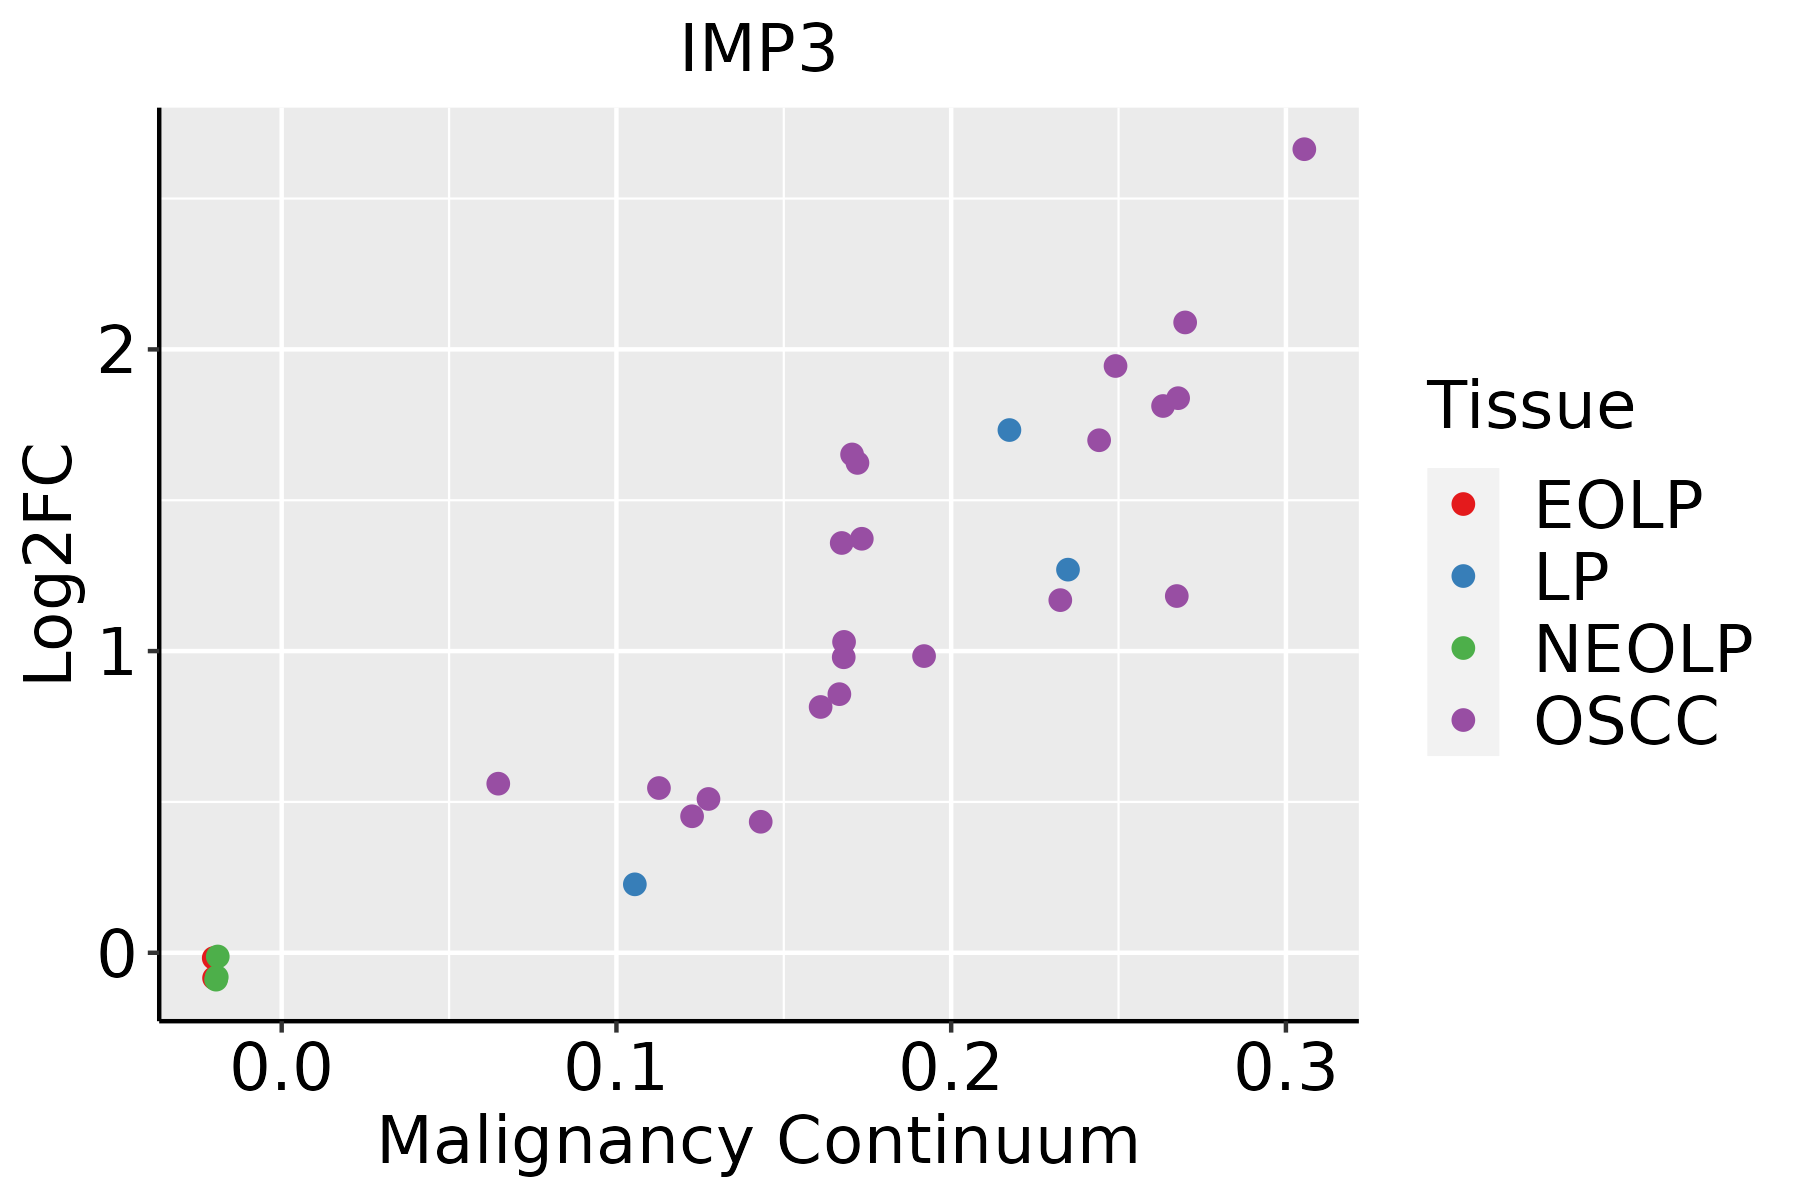 | EOLP: Erosive Oral lichen planus |
| LP: leukoplakia | ||
| NEOLP: Non-erosive oral lichen planus | ||
| OSCC: Oral squamous cell carcinoma | ||
| Prostate | 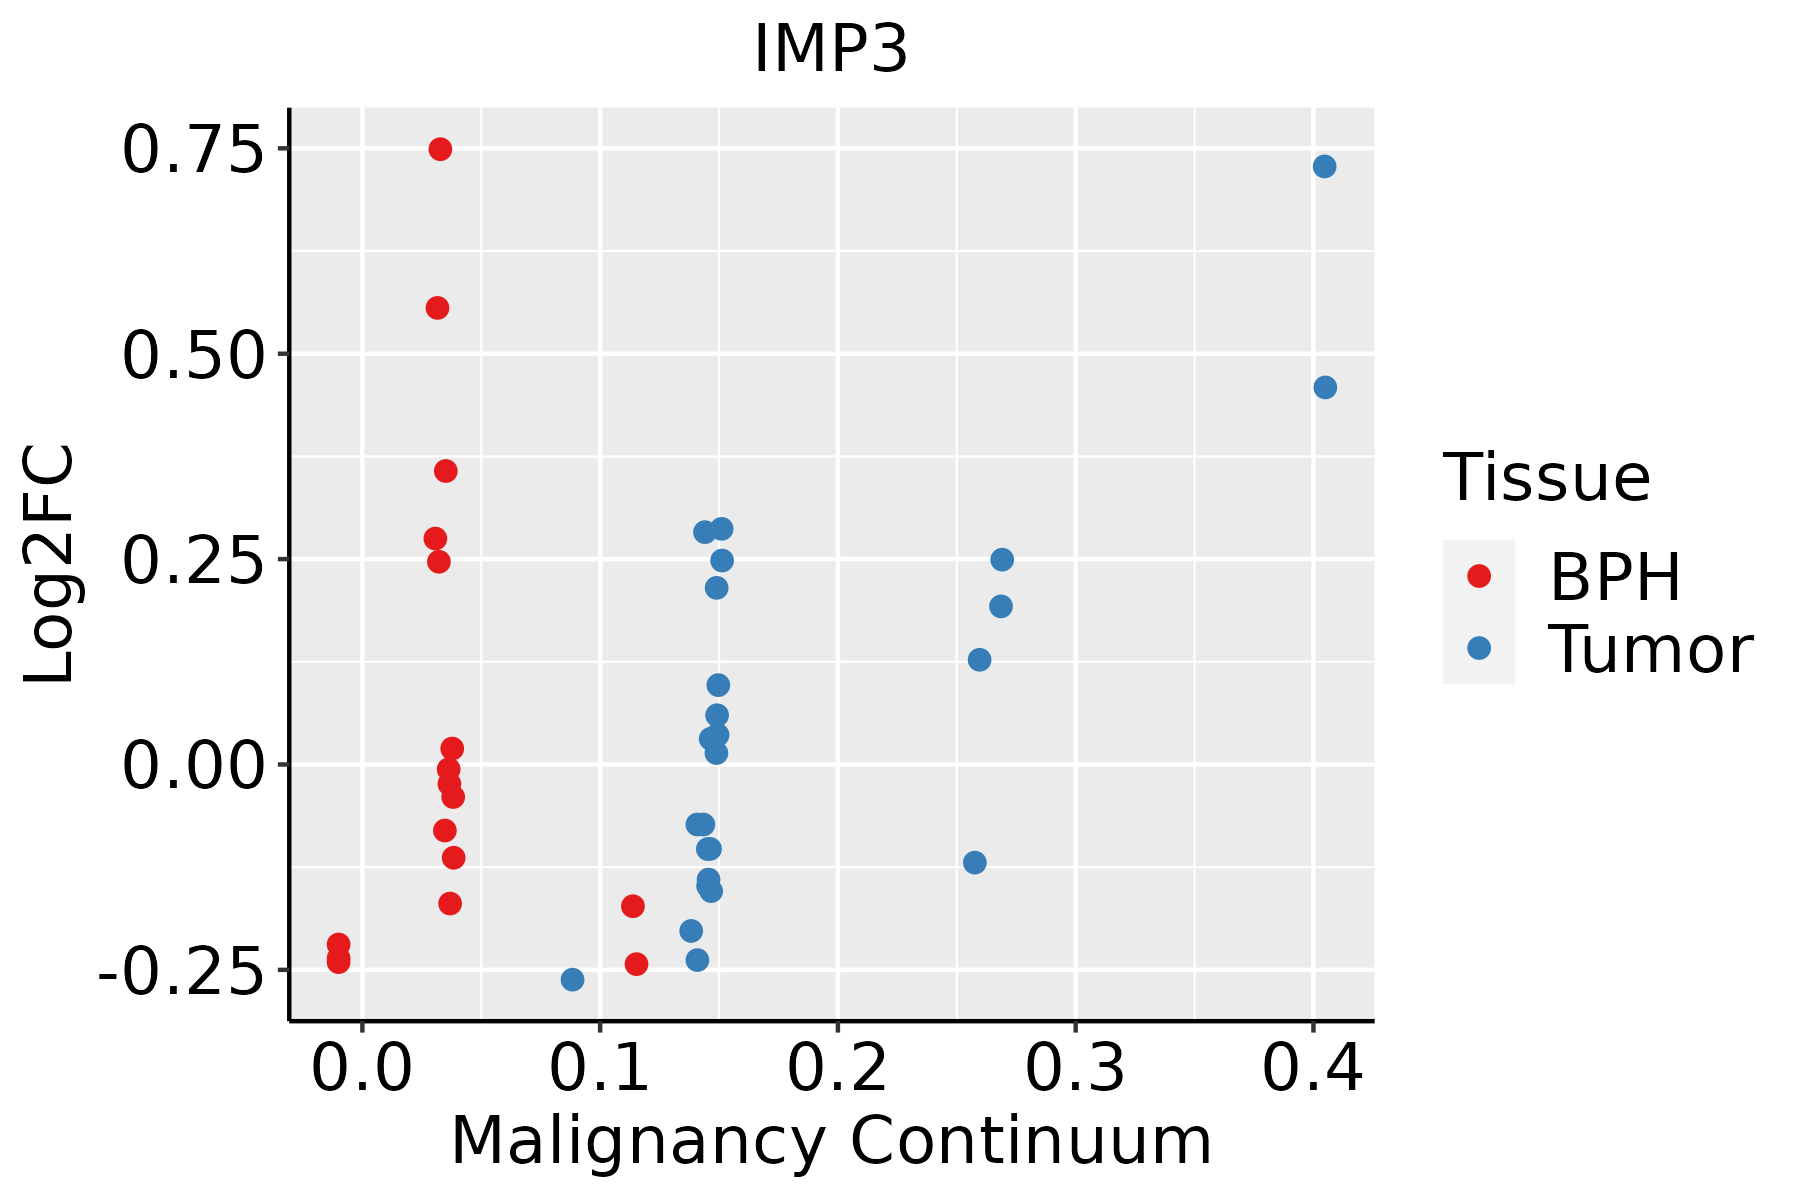 | BPH: Benign Prostatic Hyperplasia |
| Skin | 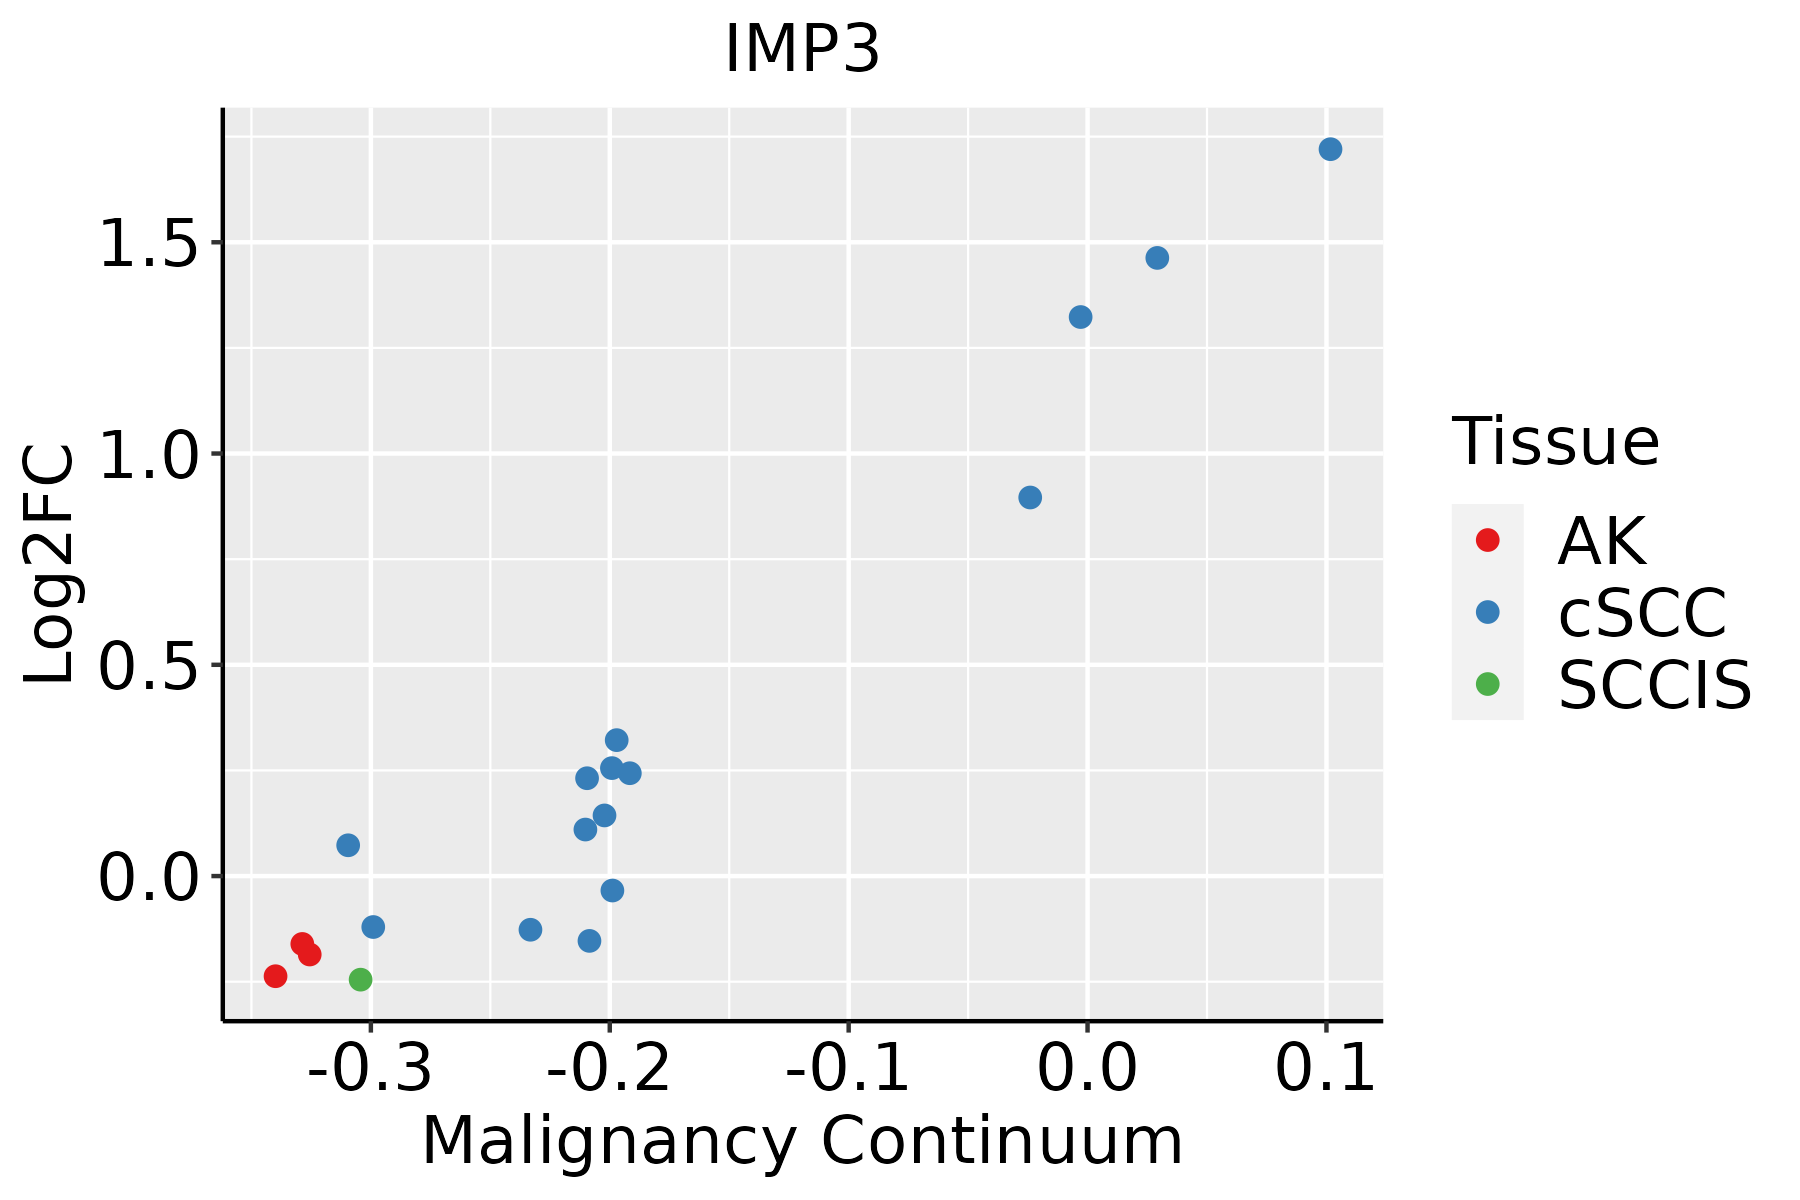 | AK: Actinic keratosis |
| cSCC: Cutaneous squamous cell carcinoma | ||
| SCCIS:squamous cell carcinoma in situ | ||
| Thyroid |  | ATC: Anaplastic thyroid cancer |
| HT: Hashimoto's thyroiditis | ||
| PTC: Papillary thyroid cancer |
| ∗log2FC in expression of this searched gene in stem-like cells from each diseased tissue sample relative to stem-like cells in normal samples in each tissue plotted against the malignancy continuum. Samples are colored based on if they are from different disease stage. |
Top |
Malignant transformation related pathway analysis |
| Find out the enriched GO biological processes and KEGG pathways involved in transition from healthy to precancer to cancer |
| Tissue | Disease Stage | Enriched GO biological Processes |
| Colorectum | AD |  |
| Colorectum | SER |  |
| Colorectum | MSS |  |
| Colorectum | MSI-H |  |
| Colorectum | FAP |  |
| ∗Top 15 enriched GO BP terms are showed in the bar plot of each disease state in each tissue. Each row represents a significant GO biological process which is colored according to the -log10(p.adjust). |
| Page: 1 2 3 4 5 6 7 8 9 |
| GO ID | Tissue | Disease Stage | Description | Gene Ratio | Bg Ratio | pvalue | p.adjust | Count |
| GO:200123314 | Breast | IDC | regulation of apoptotic signaling pathway | 82/1434 | 356/18723 | 6.27e-20 | 5.93e-17 | 82 |
| GO:005254714 | Breast | IDC | regulation of peptidase activity | 96/1434 | 461/18723 | 7.58e-20 | 6.15e-17 | 96 |
| GO:005254814 | Breast | IDC | regulation of endopeptidase activity | 88/1434 | 432/18723 | 1.20e-17 | 4.85e-15 | 88 |
| GO:004586114 | Breast | IDC | negative regulation of proteolysis | 70/1434 | 351/18723 | 8.21e-14 | 2.22e-11 | 70 |
| GO:005134613 | Breast | IDC | negative regulation of hydrolase activity | 71/1434 | 379/18723 | 1.33e-12 | 2.90e-10 | 71 |
| GO:001046613 | Breast | IDC | negative regulation of peptidase activity | 56/1434 | 262/18723 | 1.39e-12 | 2.92e-10 | 56 |
| GO:001095112 | Breast | IDC | negative regulation of endopeptidase activity | 52/1434 | 252/18723 | 3.53e-11 | 5.57e-09 | 52 |
| GO:200123514 | Breast | IDC | positive regulation of apoptotic signaling pathway | 31/1434 | 126/18723 | 4.13e-09 | 3.35e-07 | 31 |
| GO:004217614 | Breast | IDC | regulation of protein catabolic process | 63/1434 | 391/18723 | 1.32e-08 | 9.61e-07 | 63 |
| GO:009719114 | Breast | IDC | extrinsic apoptotic signaling pathway | 42/1434 | 219/18723 | 2.56e-08 | 1.73e-06 | 42 |
| GO:200123614 | Breast | IDC | regulation of extrinsic apoptotic signaling pathway | 32/1434 | 151/18723 | 1.07e-07 | 6.26e-06 | 32 |
| GO:20012385 | Breast | IDC | positive regulation of extrinsic apoptotic signaling pathway | 12/1434 | 48/18723 | 2.03e-04 | 3.32e-03 | 12 |
| GO:003133014 | Breast | IDC | negative regulation of cellular catabolic process | 37/1434 | 262/18723 | 2.20e-04 | 3.52e-03 | 37 |
| GO:00703713 | Breast | IDC | ERK1 and ERK2 cascade | 43/1434 | 330/18723 | 4.28e-04 | 5.84e-03 | 43 |
| GO:004217714 | Breast | IDC | negative regulation of protein catabolic process | 20/1434 | 121/18723 | 8.51e-04 | 9.92e-03 | 20 |
| GO:190204112 | Breast | IDC | regulation of extrinsic apoptotic signaling pathway via death domain receptors | 11/1434 | 49/18723 | 9.88e-04 | 1.11e-02 | 11 |
| GO:000989514 | Breast | IDC | negative regulation of catabolic process | 40/1434 | 320/18723 | 1.49e-03 | 1.50e-02 | 40 |
| GO:19020432 | Breast | IDC | positive regulation of extrinsic apoptotic signaling pathway via death domain receptors | 5/1434 | 13/18723 | 2.00e-03 | 1.90e-02 | 5 |
| GO:00703733 | Breast | IDC | negative regulation of ERK1 and ERK2 cascade | 14/1434 | 78/18723 | 2.21e-03 | 2.06e-02 | 14 |
| GO:00703722 | Breast | IDC | regulation of ERK1 and ERK2 cascade | 37/1434 | 309/18723 | 4.53e-03 | 3.49e-02 | 37 |
| Page: 1 2 3 4 5 6 7 8 9 10 11 12 13 14 15 16 17 18 19 20 21 |
| Pathway ID | Tissue | Disease Stage | Description | Gene Ratio | Bg Ratio | pvalue | p.adjust | qvalue | Count |
| Page: 1 |
Top |
Cell-cell communication analysis |
| Identification of potential cell-cell interactions between two cell types and their ligand-receptor pairs for different disease states |
| Ligand | Receptor | LRpair | Pathway | Tissue | Disease Stage |
| Page: 1 |
Top |
Single-cell gene regulatory network inference analysis |
| Find out the significant the regulons (TFs) and the target genes of each regulon across cell types for different disease states |
| TF | Cell Type | Tissue | Disease Stage | Target Gene | RSS | Regulon Activity |
| ∗The dot plots of a searched regulon are shown for all cell subpopulations in each disease state of each tissue based on the regulon specific score inferred using pySCENIC and by calculating the average expression. |
| Page: 1 |
Top |
Somatic mutation of malignant transformation related genes |
| Annotation of somatic variants for genes involved in malignant transformation |
| Hugo Symbol | Variant Class | Variant Classification | dbSNP RS | HGVSc | HGVSp | HGVSp Short | SWISSPROT | BIOTYPE | SIFT | PolyPhen | Tumor Sample Barcode | Tissue | Histology | Sex | Age | Stage | Therapy Types | Drugs | Outcome |
| IMP3 | SNV | Missense_Mutation | rs746193463 | c.227C>T | p.Ser76Leu | p.S76L | Q9NV31 | protein_coding | deleterious(0.02) | benign(0.242) | TCGA-C8-A274-01 | Breast | breast invasive carcinoma | Female | <65 | I/II | Hormone Therapy | tamoxiphen | SD |
| IMP3 | SNV | Missense_Mutation | c.538N>G | p.Phe180Val | p.F180V | Q9NV31 | protein_coding | deleterious(0) | probably_damaging(0.972) | TCGA-AA-A02E-01 | Colorectum | colon adenocarcinoma | Female | >=65 | III/IV | Unknown | Unknown | PD | |
| IMP3 | SNV | Missense_Mutation | rs200453864 | c.521N>G | p.Asn174Ser | p.N174S | Q9NV31 | protein_coding | deleterious(0.04) | benign(0.063) | TCGA-AG-3594-01 | Colorectum | rectum adenocarcinoma | Male | >=65 | I/II | Unknown | Unknown | PD |
| IMP3 | SNV | Missense_Mutation | novel | c.268N>T | p.Pro90Ser | p.P90S | Q9NV31 | protein_coding | tolerated(0.53) | benign(0.015) | TCGA-DI-A1BU-01 | Endometrium | uterine corpus endometrioid carcinoma | Female | <65 | I/II | Chemotherapy | paclitaxel | SD |
| IMP3 | SNV | Missense_Mutation | novel | c.541N>C | p.Asp181His | p.D181H | Q9NV31 | protein_coding | deleterious(0) | probably_damaging(0.969) | TCGA-HD-A4C1-01 | Oral cavity | head & neck squamous cell carcinoma | Female | <65 | I/II | Unknown | Unknown | SD |
| IMP3 | insertion | Frame_Shift_Ins | novel | c.456_457insGC | p.Ser153AlafsTer20 | p.S153Afs*20 | Q9NV31 | protein_coding | TCGA-CV-6003-01 | Oral cavity | head & neck squamous cell carcinoma | Female | <65 | III/IV | Unknown | Unknown | SD | ||
| IMP3 | SNV | Missense_Mutation | c.540N>A | p.Phe180Leu | p.F180L | Q9NV31 | protein_coding | deleterious(0) | possibly_damaging(0.878) | TCGA-G9-7510-01 | Prostate | prostate adenocarcinoma | Male | >=65 | 8 | Unknown | Unknown | SD |
| Page: 1 |
Top |
Related drugs of malignant transformation related genes |
| Identification of chemicals and drugs interact with genes involved in malignant transfromation |
| (DGIdb 4.0) |
| Entrez ID | Symbol | Category | Interaction Types | Drug Claim Name | Drug Name | PMIDs |
| Page: 1 |

Copyright 2023-Present -The University of Texas Health Science Center at Houston |