
|
|||||
|
 | |
| |
| |
| |
| |
| |
|
Gene: IFFO2 |
Gene summary for IFFO2 |
| Gene information | Species | Human | Gene symbol | IFFO2 | Gene ID | 126917 |
| Gene name | intermediate filament family orphan 2 | |
| Gene Alias | IFFO2 | |
| Cytomap | 1p36.13 | |
| Gene Type | protein-coding | GO ID | GO:0005575 | UniProtAcc | Q5TF58 |
Top |
Malignant transformation analysis |
| Identification of the aberrant gene expression in precancerous and cancerous lesions by comparing the gene expression of stem-like cells in diseased tissues with normal stem cells |
| Entrez ID | Symbol | Replicates | Species | Organ | Tissue | Adj P-value | Log2FC | Malignancy |
| 126917 | IFFO2 | P30T-E | Human | Esophagus | ESCC | 2.55e-10 | 4.40e-01 | 0.137 |
| 126917 | IFFO2 | P31T-E | Human | Esophagus | ESCC | 1.39e-19 | 6.97e-01 | 0.1251 |
| 126917 | IFFO2 | P32T-E | Human | Esophagus | ESCC | 6.07e-10 | 6.09e-02 | 0.1666 |
| 126917 | IFFO2 | P36T-E | Human | Esophagus | ESCC | 3.91e-07 | 4.89e-02 | 0.1187 |
| 126917 | IFFO2 | P37T-E | Human | Esophagus | ESCC | 6.70e-13 | 8.93e-02 | 0.1371 |
| 126917 | IFFO2 | P40T-E | Human | Esophagus | ESCC | 3.46e-07 | 1.43e-01 | 0.109 |
| 126917 | IFFO2 | P47T-E | Human | Esophagus | ESCC | 7.16e-06 | 1.19e-01 | 0.1067 |
| 126917 | IFFO2 | P52T-E | Human | Esophagus | ESCC | 6.87e-20 | 2.50e-01 | 0.1555 |
| 126917 | IFFO2 | P54T-E | Human | Esophagus | ESCC | 1.45e-05 | 3.25e-01 | 0.0975 |
| 126917 | IFFO2 | P57T-E | Human | Esophagus | ESCC | 1.24e-06 | 2.04e-02 | 0.0926 |
| 126917 | IFFO2 | P61T-E | Human | Esophagus | ESCC | 9.63e-10 | -1.76e-01 | 0.099 |
| 126917 | IFFO2 | P62T-E | Human | Esophagus | ESCC | 9.43e-07 | 5.34e-01 | 0.1302 |
| 126917 | IFFO2 | P65T-E | Human | Esophagus | ESCC | 1.01e-09 | -1.18e-01 | 0.0978 |
| 126917 | IFFO2 | P74T-E | Human | Esophagus | ESCC | 3.19e-02 | 9.49e-02 | 0.1479 |
| 126917 | IFFO2 | P75T-E | Human | Esophagus | ESCC | 1.27e-10 | 4.65e-01 | 0.1125 |
| 126917 | IFFO2 | P76T-E | Human | Esophagus | ESCC | 5.52e-10 | -2.98e-02 | 0.1207 |
| 126917 | IFFO2 | P79T-E | Human | Esophagus | ESCC | 1.87e-05 | -2.08e-01 | 0.1154 |
| 126917 | IFFO2 | P80T-E | Human | Esophagus | ESCC | 7.62e-25 | 1.25e+00 | 0.155 |
| 126917 | IFFO2 | P82T-E | Human | Esophagus | ESCC | 4.14e-03 | -1.60e-02 | 0.1072 |
| 126917 | IFFO2 | P83T-E | Human | Esophagus | ESCC | 4.31e-08 | -4.54e-02 | 0.1738 |
| Page: 1 2 3 4 5 |
| Tissue | Expression Dynamics | Abbreviation |
| Esophagus | 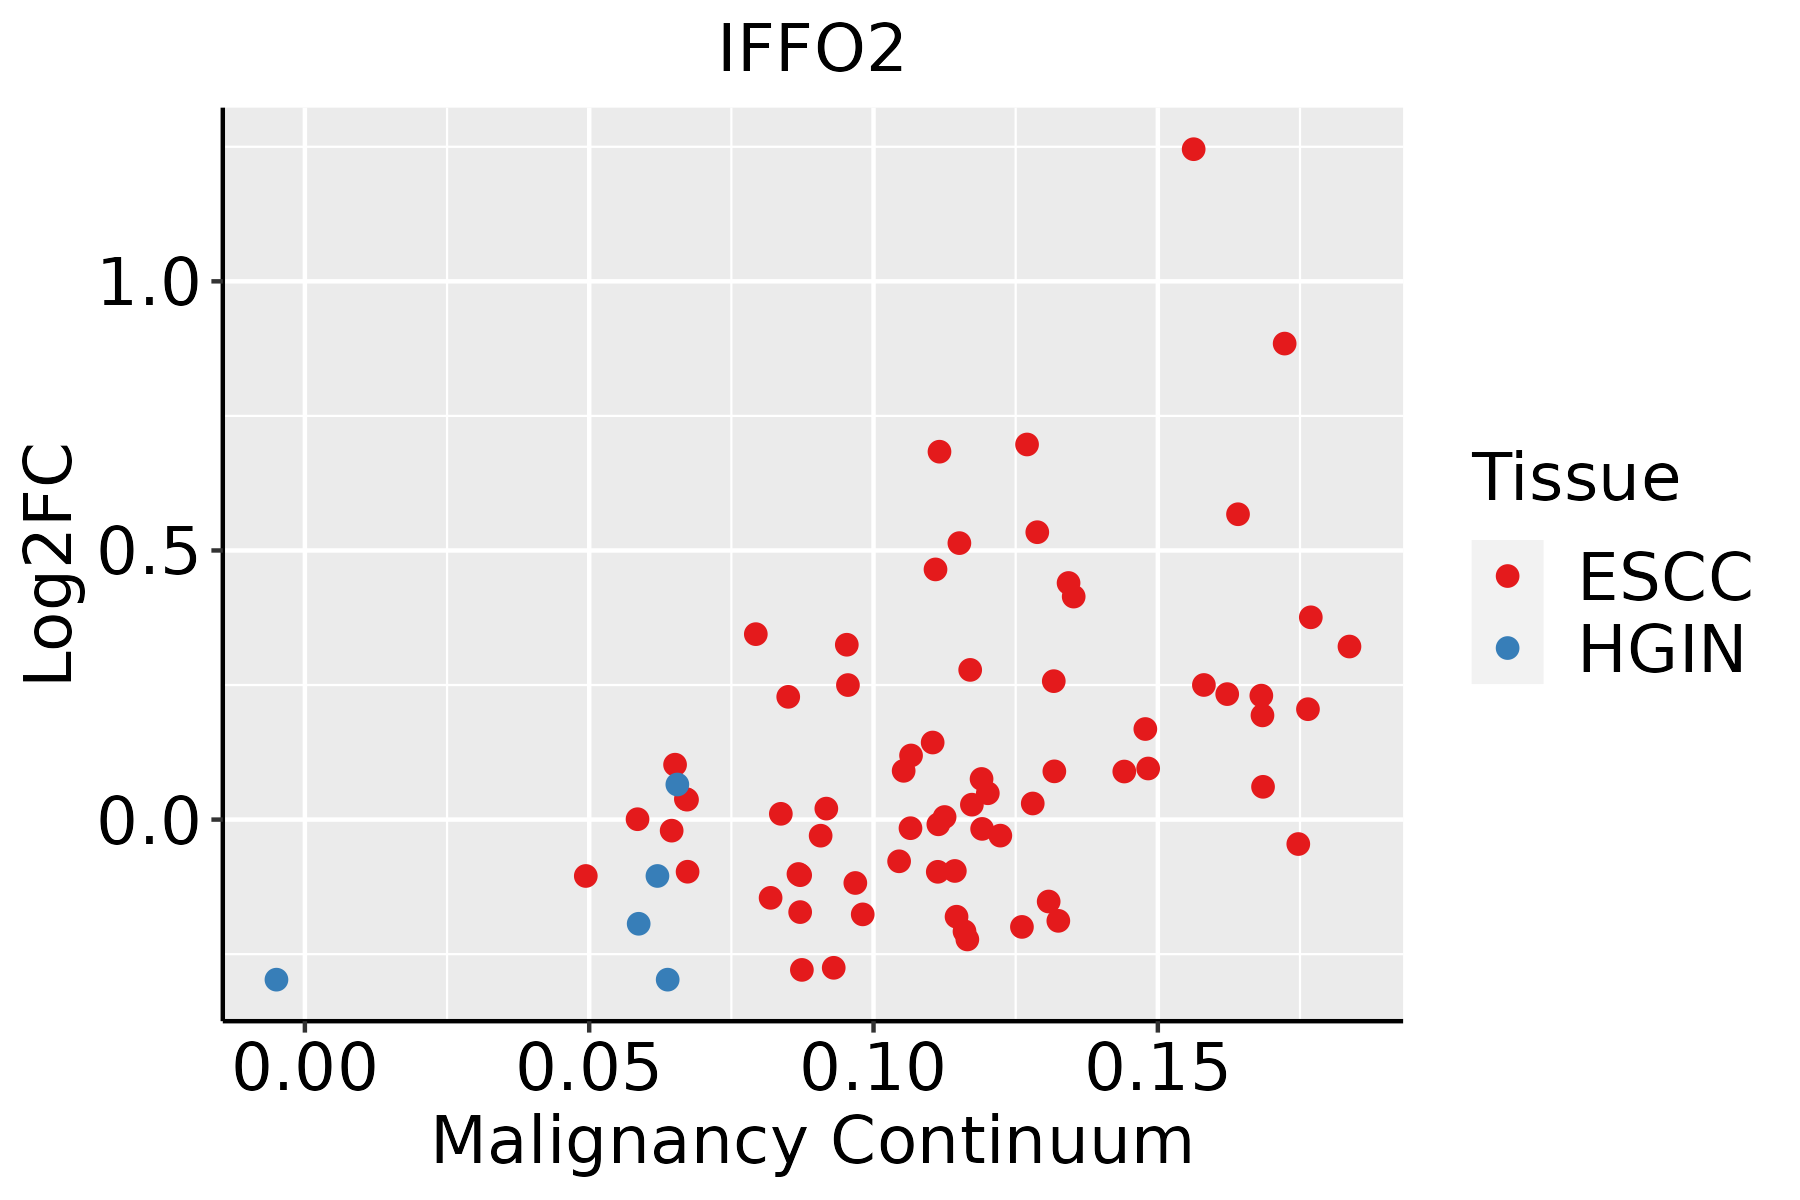 | ESCC: Esophageal squamous cell carcinoma |
| HGIN: High-grade intraepithelial neoplasias | ||
| LGIN: Low-grade intraepithelial neoplasias | ||
| Liver | 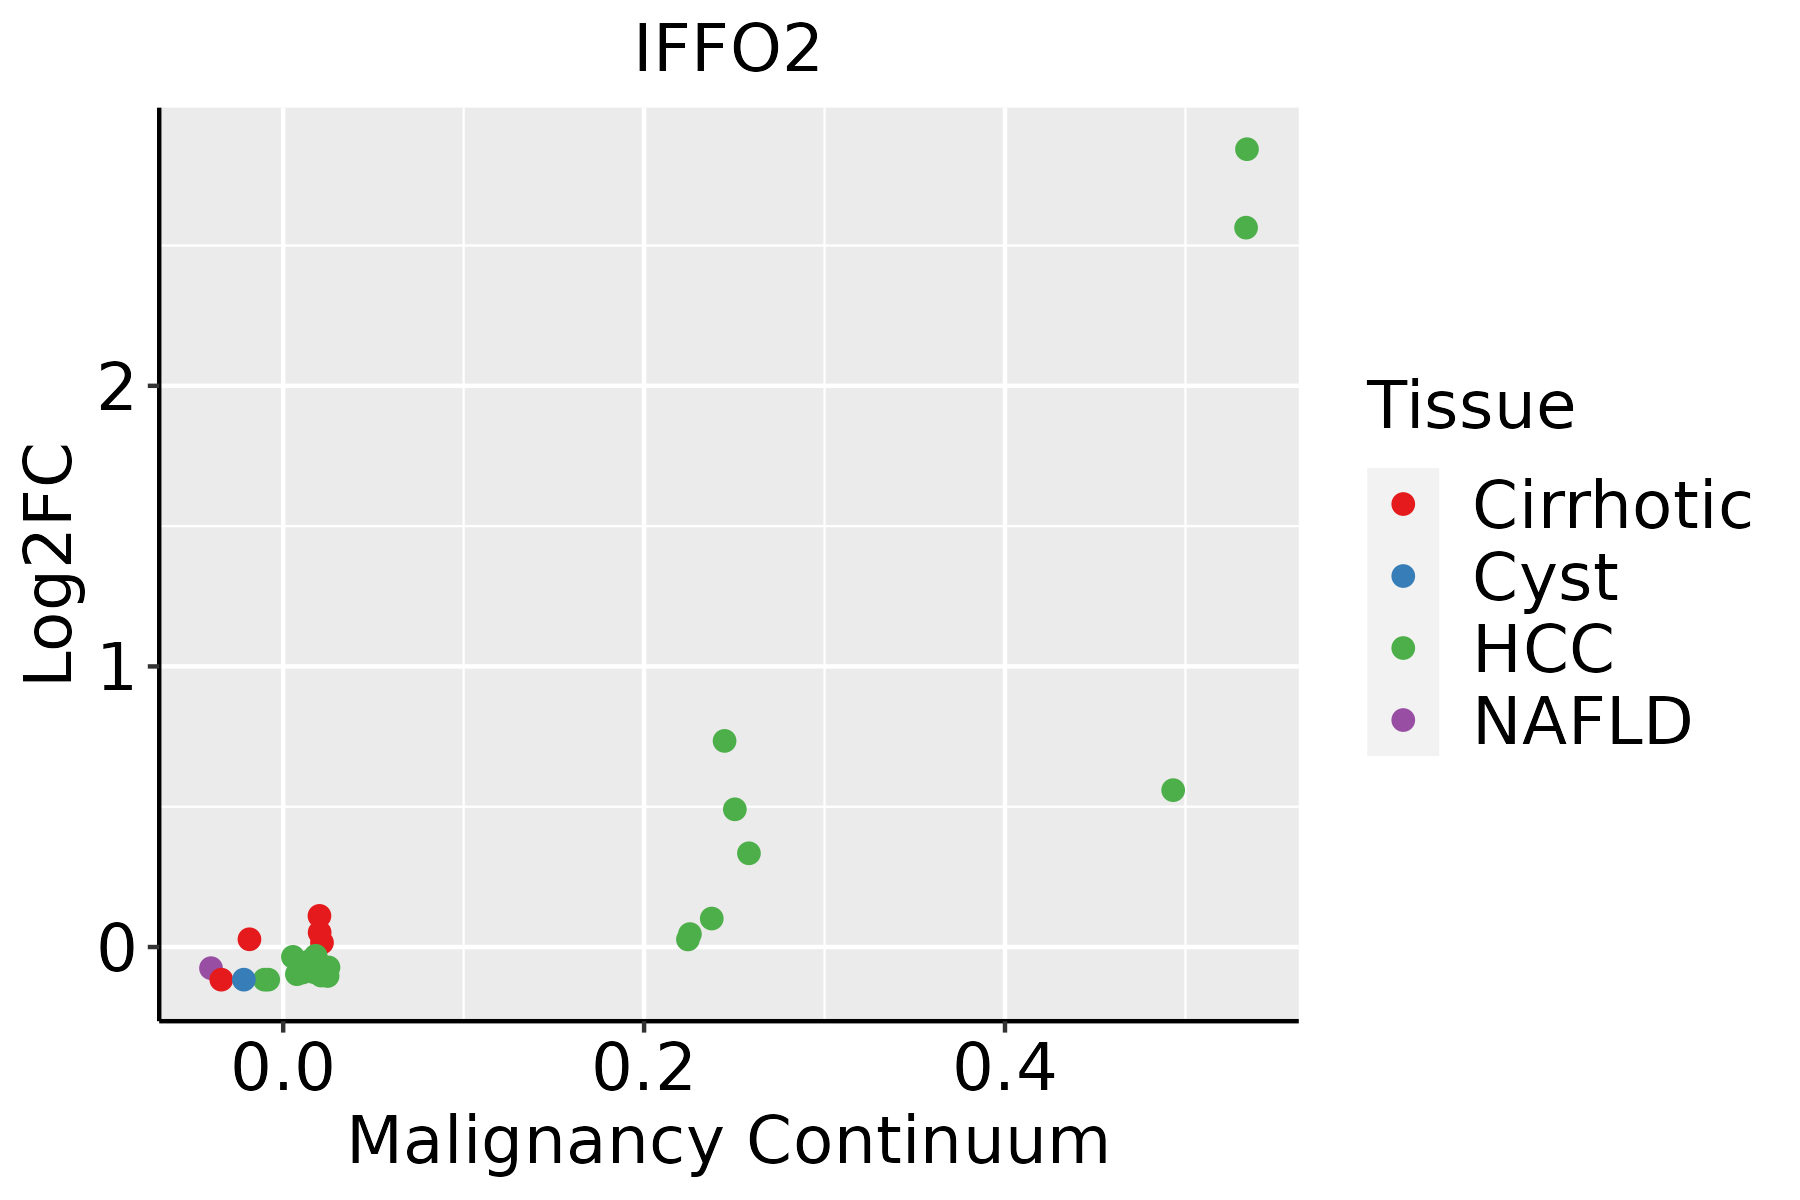 | HCC: Hepatocellular carcinoma |
| NAFLD: Non-alcoholic fatty liver disease | ||
| Oral Cavity | 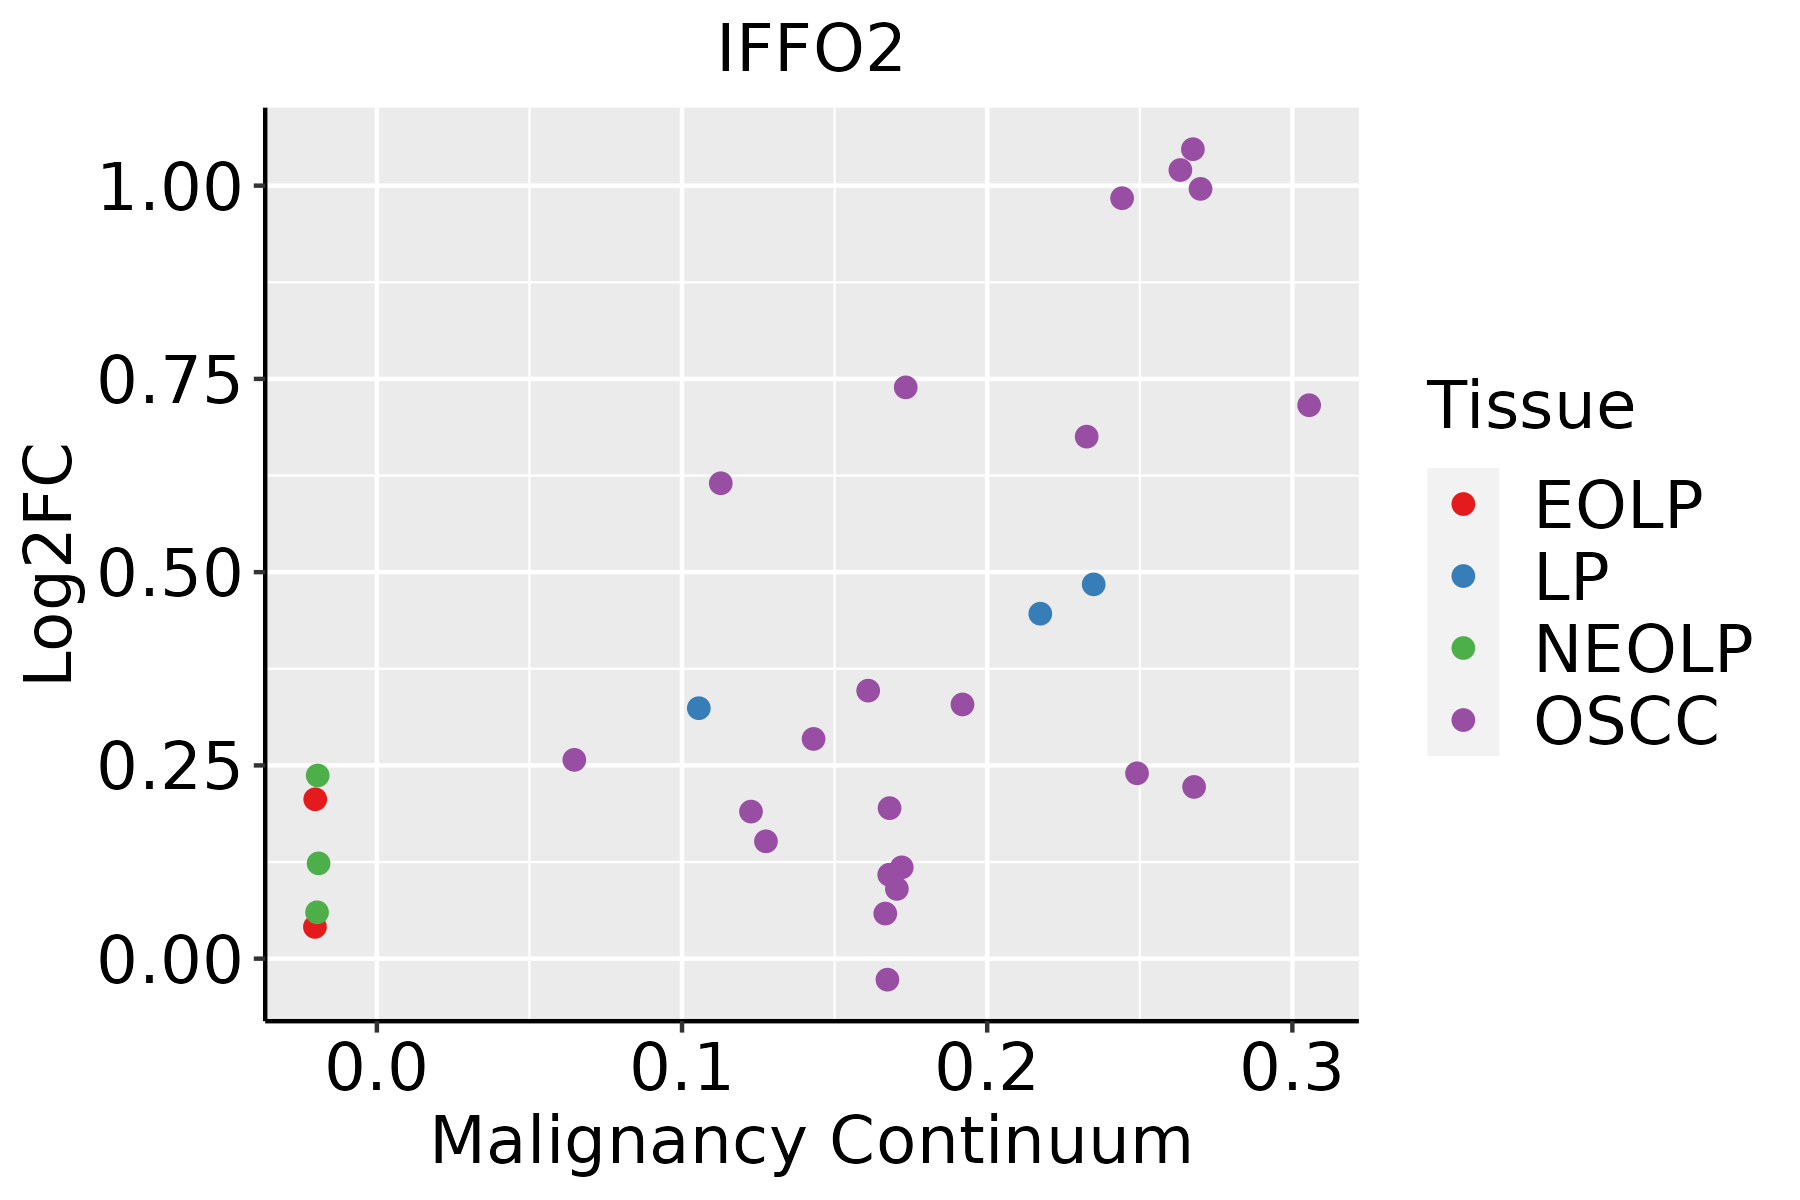 | EOLP: Erosive Oral lichen planus |
| LP: leukoplakia | ||
| NEOLP: Non-erosive oral lichen planus | ||
| OSCC: Oral squamous cell carcinoma | ||
| Skin | 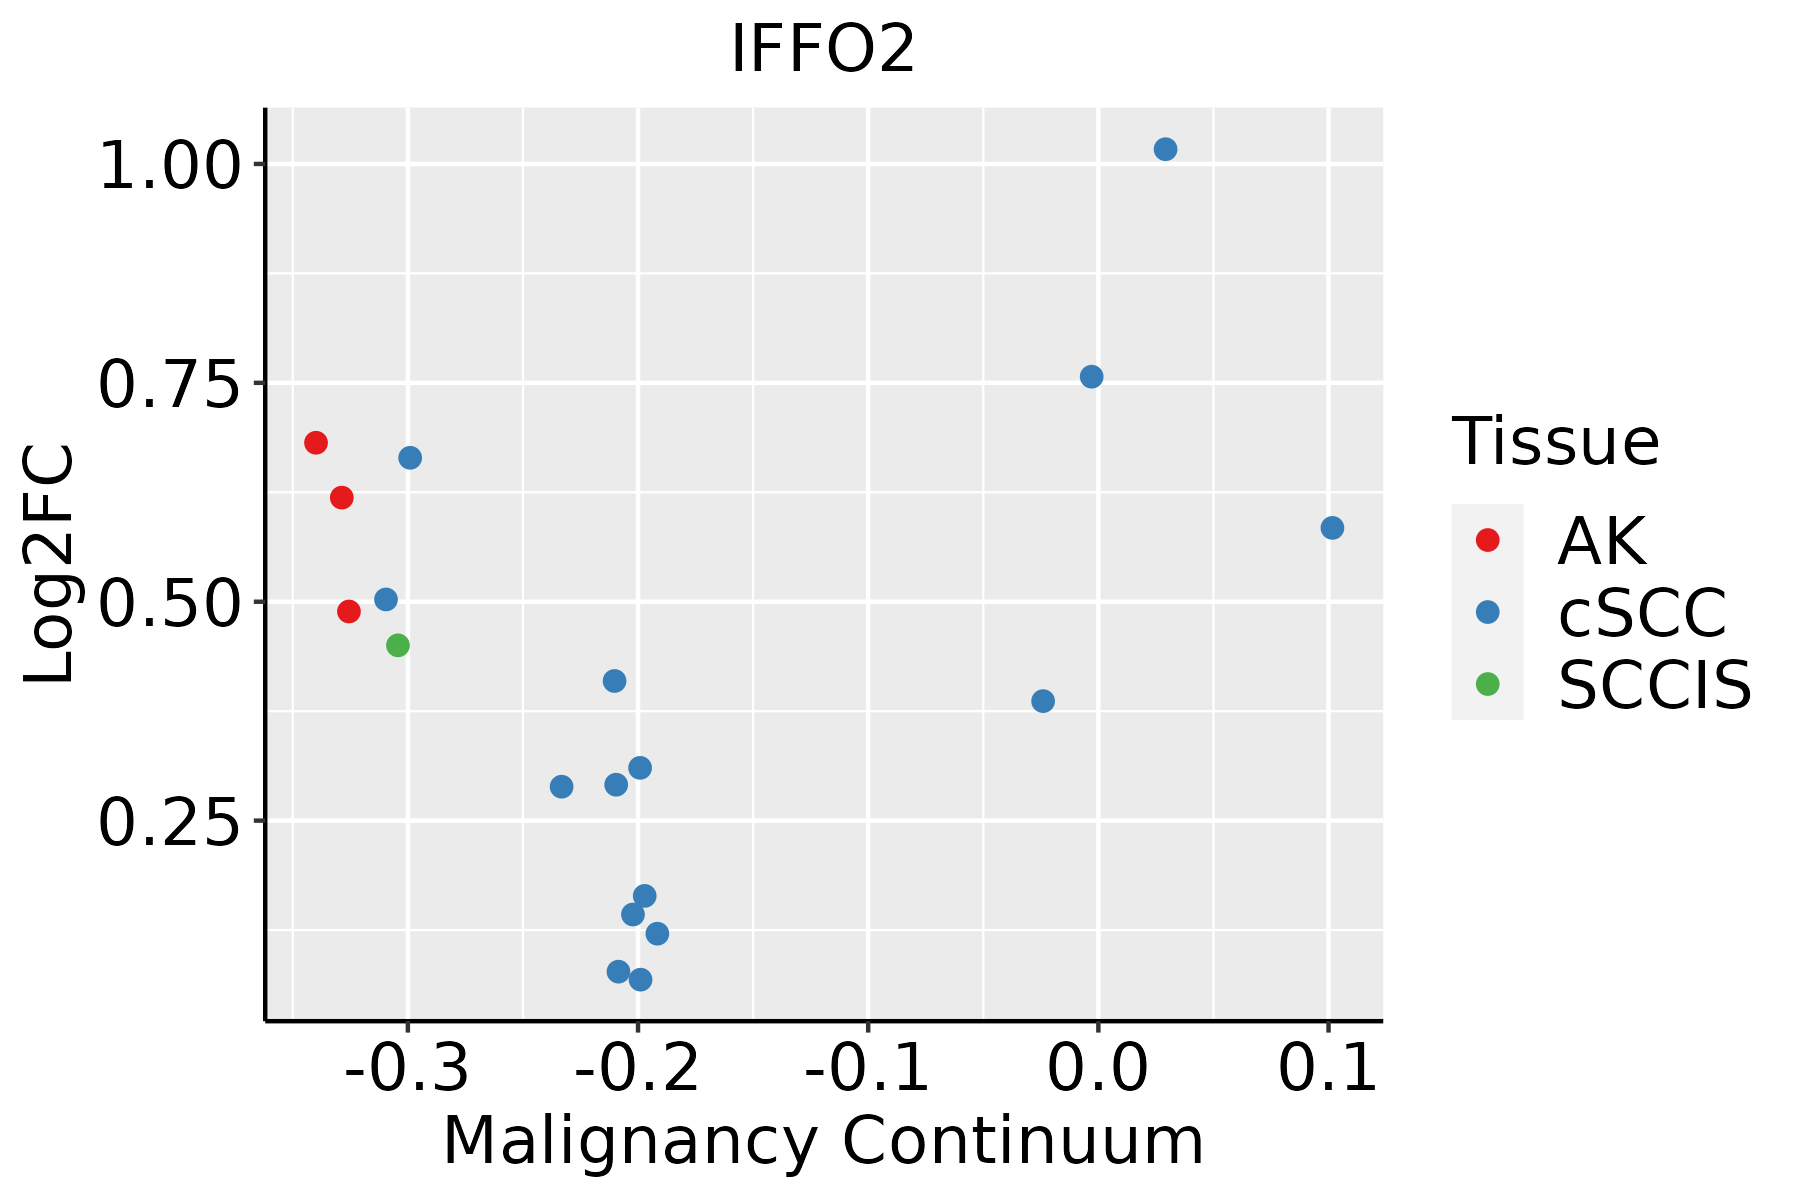 | AK: Actinic keratosis |
| cSCC: Cutaneous squamous cell carcinoma | ||
| SCCIS:squamous cell carcinoma in situ |
| ∗log2FC in expression of this searched gene in stem-like cells from each diseased tissue sample relative to stem-like cells in normal samples in each tissue plotted against the malignancy continuum. Samples are colored based on if they are from different disease stage. |
Top |
Malignant transformation related pathway analysis |
| Find out the enriched GO biological processes and KEGG pathways involved in transition from healthy to precancer to cancer |
| Tissue | Disease Stage | Enriched GO biological Processes |
| Colorectum | AD |  |
| Colorectum | SER |  |
| Colorectum | MSS |  |
| Colorectum | MSI-H |  |
| Colorectum | FAP |  |
| ∗Top 15 enriched GO BP terms are showed in the bar plot of each disease state in each tissue. Each row represents a significant GO biological process which is colored according to the -log10(p.adjust). |
| Page: 1 2 3 4 5 6 7 8 9 |
| GO ID | Tissue | Disease Stage | Description | Gene Ratio | Bg Ratio | pvalue | p.adjust | Count |
| Page: 1 |
| Pathway ID | Tissue | Disease Stage | Description | Gene Ratio | Bg Ratio | pvalue | p.adjust | qvalue | Count |
| Page: 1 |
Top |
Cell-cell communication analysis |
| Identification of potential cell-cell interactions between two cell types and their ligand-receptor pairs for different disease states |
| Ligand | Receptor | LRpair | Pathway | Tissue | Disease Stage |
| Page: 1 |
Top |
Single-cell gene regulatory network inference analysis |
| Find out the significant the regulons (TFs) and the target genes of each regulon across cell types for different disease states |
| TF | Cell Type | Tissue | Disease Stage | Target Gene | RSS | Regulon Activity |
| ∗The dot plots of a searched regulon are shown for all cell subpopulations in each disease state of each tissue based on the regulon specific score inferred using pySCENIC and by calculating the average expression. |
| Page: 1 |
Top |
Somatic mutation of malignant transformation related genes |
| Annotation of somatic variants for genes involved in malignant transformation |
| Hugo Symbol | Variant Class | Variant Classification | dbSNP RS | HGVSc | HGVSp | HGVSp Short | SWISSPROT | BIOTYPE | SIFT | PolyPhen | Tumor Sample Barcode | Tissue | Histology | Sex | Age | Stage | Therapy Types | Drugs | Outcome |
| IFFO2 | SNV | Missense_Mutation | novel | c.773N>C | p.Ile258Thr | p.I258T | Q5TF58 | protein_coding | deleterious(0) | benign(0.169) | TCGA-AR-A2LN-01 | Breast | breast invasive carcinoma | Female | >=65 | I/II | Hormone Therapy | letrozole | SD |
| IFFO2 | insertion | Frame_Shift_Ins | novel | c.921_922insATGAGATA | p.Ala308MetfsTer3 | p.A308Mfs*3 | Q5TF58 | protein_coding | TCGA-AN-A0FN-01 | Breast | breast invasive carcinoma | Female | <65 | I/II | Unknown | Unknown | SD | ||
| IFFO2 | insertion | Frame_Shift_Ins | novel | c.920_921insTCTTGCC | p.Ala308LeufsTer25 | p.A308Lfs*25 | Q5TF58 | protein_coding | TCGA-AN-A0FN-01 | Breast | breast invasive carcinoma | Female | <65 | I/II | Unknown | Unknown | SD | ||
| IFFO2 | insertion | Frame_Shift_Ins | novel | c.1036_1037insTGCCTACCTCTGCCTCCCAAAGT | p.Arg346LeufsTer18 | p.R346Lfs*18 | Q5TF58 | protein_coding | TCGA-AO-A0J4-01 | Breast | breast invasive carcinoma | Female | <65 | I/II | Chemotherapy | doxorubicin | SD | ||
| IFFO2 | SNV | Missense_Mutation | rs779567006 | c.1346N>C | p.Met449Thr | p.M449T | Q5TF58 | protein_coding | deleterious(0) | probably_damaging(0.954) | TCGA-A6-3809-01 | Colorectum | colon adenocarcinoma | Female | >=65 | I/II | Unknown | Unknown | SD |
| IFFO2 | SNV | Missense_Mutation | novel | c.762G>T | p.Met254Ile | p.M254I | Q5TF58 | protein_coding | deleterious(0) | benign(0.011) | TCGA-AA-A00N-01 | Colorectum | colon adenocarcinoma | Male | >=65 | I/II | Unknown | Unknown | PD |
| IFFO2 | SNV | Missense_Mutation | c.946N>A | p.Val316Met | p.V316M | Q5TF58 | protein_coding | tolerated(1) | benign(0.024) | TCGA-AY-6197-01 | Colorectum | colon adenocarcinoma | Male | <65 | I/II | Unknown | Unknown | SD | |
| IFFO2 | SNV | Missense_Mutation | novel | c.1261G>A | p.Glu421Lys | p.E421K | Q5TF58 | protein_coding | deleterious(0) | probably_damaging(0.993) | TCGA-AZ-4315-01 | Colorectum | colon adenocarcinoma | Male | <65 | I/II | Unknown | Unknown | SD |
| IFFO2 | SNV | Missense_Mutation | rs774951387 | c.1441G>A | p.Ala481Thr | p.A481T | Q5TF58 | protein_coding | tolerated(0.15) | possibly_damaging(0.855) | TCGA-F4-6856-01 | Colorectum | colon adenocarcinoma | Male | <65 | I/II | Ancillary | leucovorin | CR |
| IFFO2 | SNV | Missense_Mutation | novel | c.1296G>T | p.Gln432His | p.Q432H | Q5TF58 | protein_coding | deleterious(0.01) | probably_damaging(0.995) | TCGA-AG-3726-01 | Colorectum | rectum adenocarcinoma | Female | <65 | I/II | Unknown | Unknown | SD |
| Page: 1 2 3 |
Top |
Related drugs of malignant transformation related genes |
| Identification of chemicals and drugs interact with genes involved in malignant transfromation |
| (DGIdb 4.0) |
| Entrez ID | Symbol | Category | Interaction Types | Drug Claim Name | Drug Name | PMIDs |
| Page: 1 |

Copyright 2023-Present -The University of Texas Health Science Center at Houston |