
|
|||||
|
 | |
| |
| |
| |
| |
| |
|
Gene: HSDL1 |
Gene summary for HSDL1 |
| Gene information | Species | Human | Gene symbol | HSDL1 | Gene ID | 83693 |
| Gene name | hydroxysteroid dehydrogenase like 1 | |
| Gene Alias | SDR12C3 | |
| Cytomap | 16q24.1 | |
| Gene Type | protein-coding | GO ID | GO:0005575 | UniProtAcc | I6L975 |
Top |
Malignant transformation analysis |
| Identification of the aberrant gene expression in precancerous and cancerous lesions by comparing the gene expression of stem-like cells in diseased tissues with normal stem cells |
| Entrez ID | Symbol | Replicates | Species | Organ | Tissue | Adj P-value | Log2FC | Malignancy |
| 83693 | HSDL1 | P26T-E | Human | Esophagus | ESCC | 1.27e-23 | 3.87e-01 | 0.1276 |
| 83693 | HSDL1 | P27T-E | Human | Esophagus | ESCC | 8.14e-12 | 2.13e-01 | 0.1055 |
| 83693 | HSDL1 | P28T-E | Human | Esophagus | ESCC | 6.45e-11 | 1.46e-01 | 0.1149 |
| 83693 | HSDL1 | P30T-E | Human | Esophagus | ESCC | 5.18e-10 | 2.65e-01 | 0.137 |
| 83693 | HSDL1 | P31T-E | Human | Esophagus | ESCC | 7.81e-13 | 2.69e-01 | 0.1251 |
| 83693 | HSDL1 | P32T-E | Human | Esophagus | ESCC | 1.53e-07 | 9.07e-02 | 0.1666 |
| 83693 | HSDL1 | P36T-E | Human | Esophagus | ESCC | 5.19e-05 | 1.30e-01 | 0.1187 |
| 83693 | HSDL1 | P37T-E | Human | Esophagus | ESCC | 6.77e-15 | 3.10e-01 | 0.1371 |
| 83693 | HSDL1 | P39T-E | Human | Esophagus | ESCC | 4.59e-08 | 1.40e-01 | 0.0894 |
| 83693 | HSDL1 | P40T-E | Human | Esophagus | ESCC | 2.70e-04 | 1.03e-01 | 0.109 |
| 83693 | HSDL1 | P42T-E | Human | Esophagus | ESCC | 1.12e-08 | 1.57e-01 | 0.1175 |
| 83693 | HSDL1 | P44T-E | Human | Esophagus | ESCC | 6.59e-04 | 8.34e-02 | 0.1096 |
| 83693 | HSDL1 | P47T-E | Human | Esophagus | ESCC | 2.04e-05 | 1.11e-01 | 0.1067 |
| 83693 | HSDL1 | P48T-E | Human | Esophagus | ESCC | 2.73e-03 | 1.47e-01 | 0.0959 |
| 83693 | HSDL1 | P49T-E | Human | Esophagus | ESCC | 1.45e-07 | 4.90e-01 | 0.1768 |
| 83693 | HSDL1 | P52T-E | Human | Esophagus | ESCC | 2.93e-07 | 1.88e-01 | 0.1555 |
| 83693 | HSDL1 | P54T-E | Human | Esophagus | ESCC | 4.88e-14 | 2.52e-01 | 0.0975 |
| 83693 | HSDL1 | P57T-E | Human | Esophagus | ESCC | 8.30e-10 | 1.83e-01 | 0.0926 |
| 83693 | HSDL1 | P61T-E | Human | Esophagus | ESCC | 1.97e-10 | 2.21e-01 | 0.099 |
| 83693 | HSDL1 | P62T-E | Human | Esophagus | ESCC | 2.39e-25 | 3.95e-01 | 0.1302 |
| Page: 1 2 3 4 |
| Tissue | Expression Dynamics | Abbreviation |
| Esophagus | 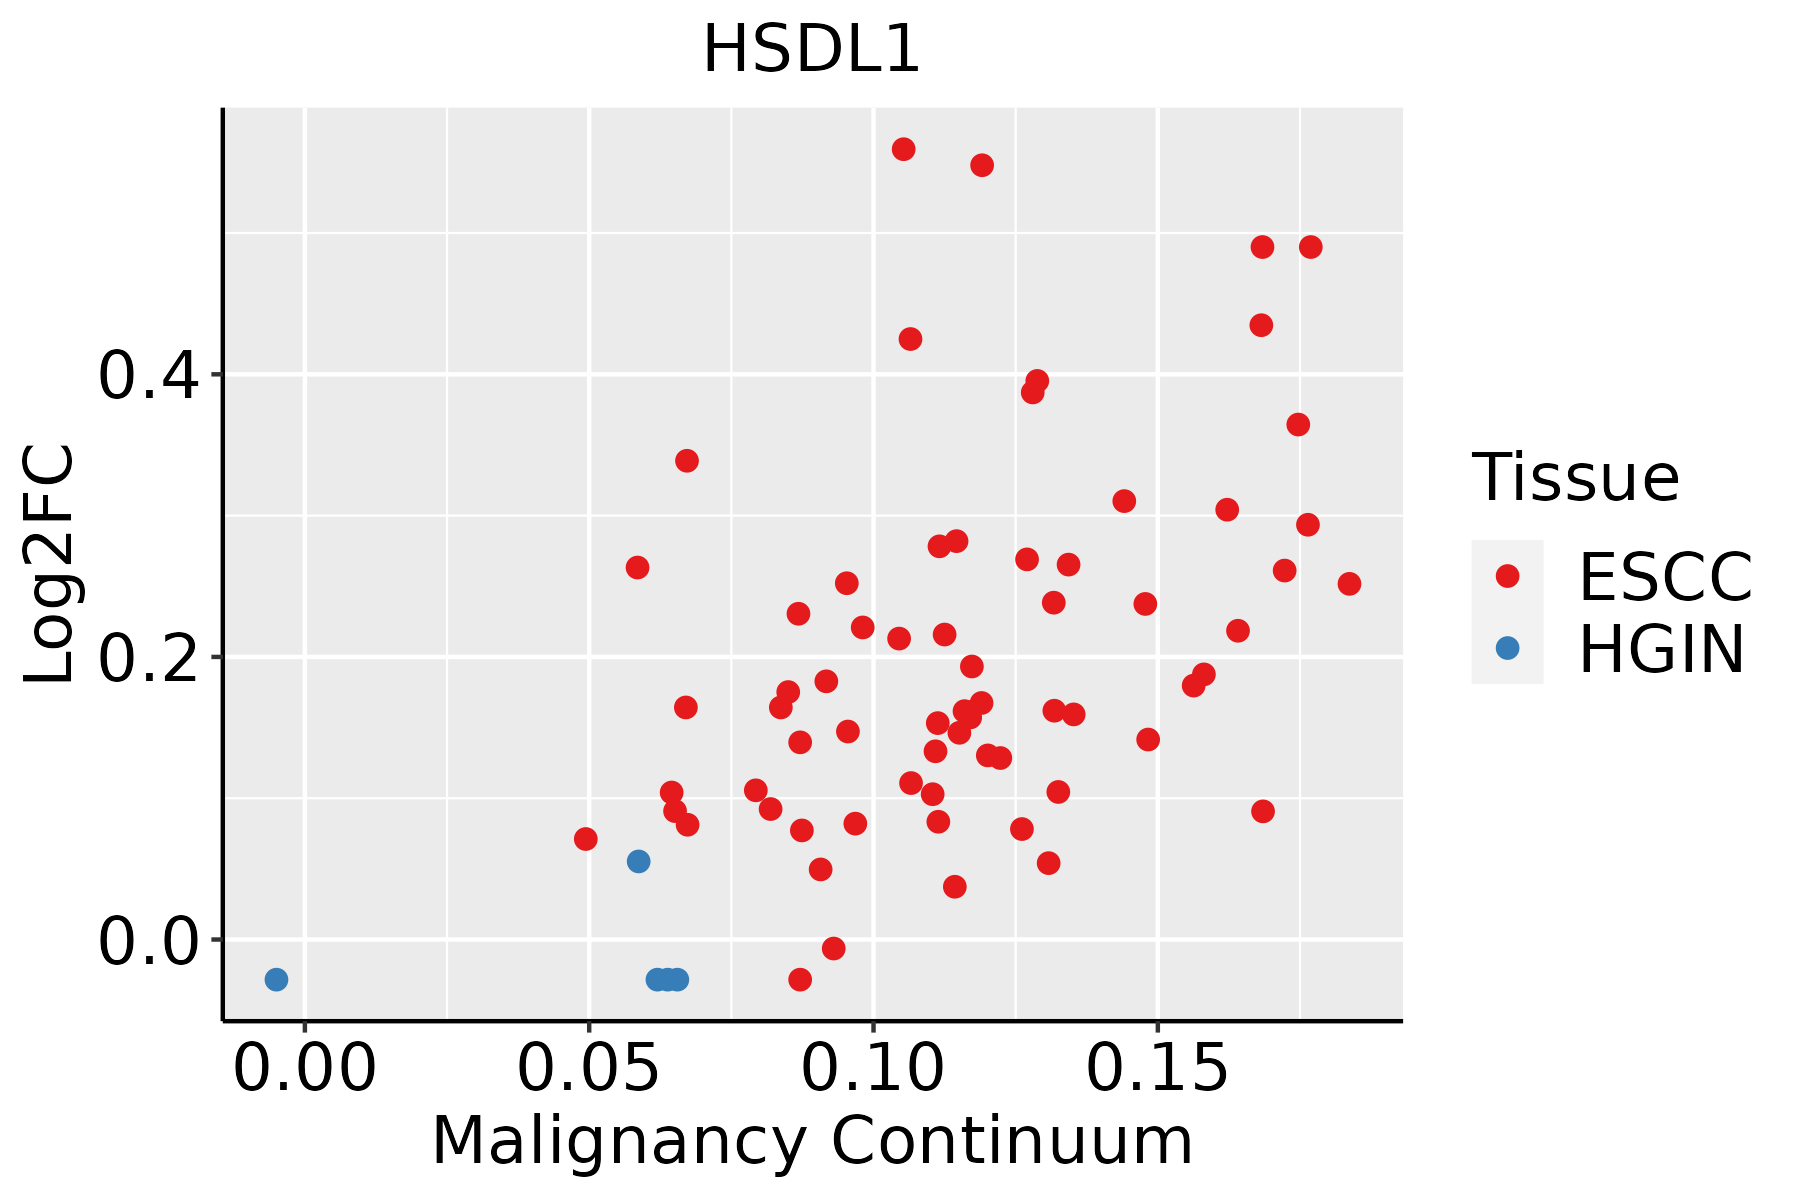 | ESCC: Esophageal squamous cell carcinoma |
| HGIN: High-grade intraepithelial neoplasias | ||
| LGIN: Low-grade intraepithelial neoplasias | ||
| Liver | 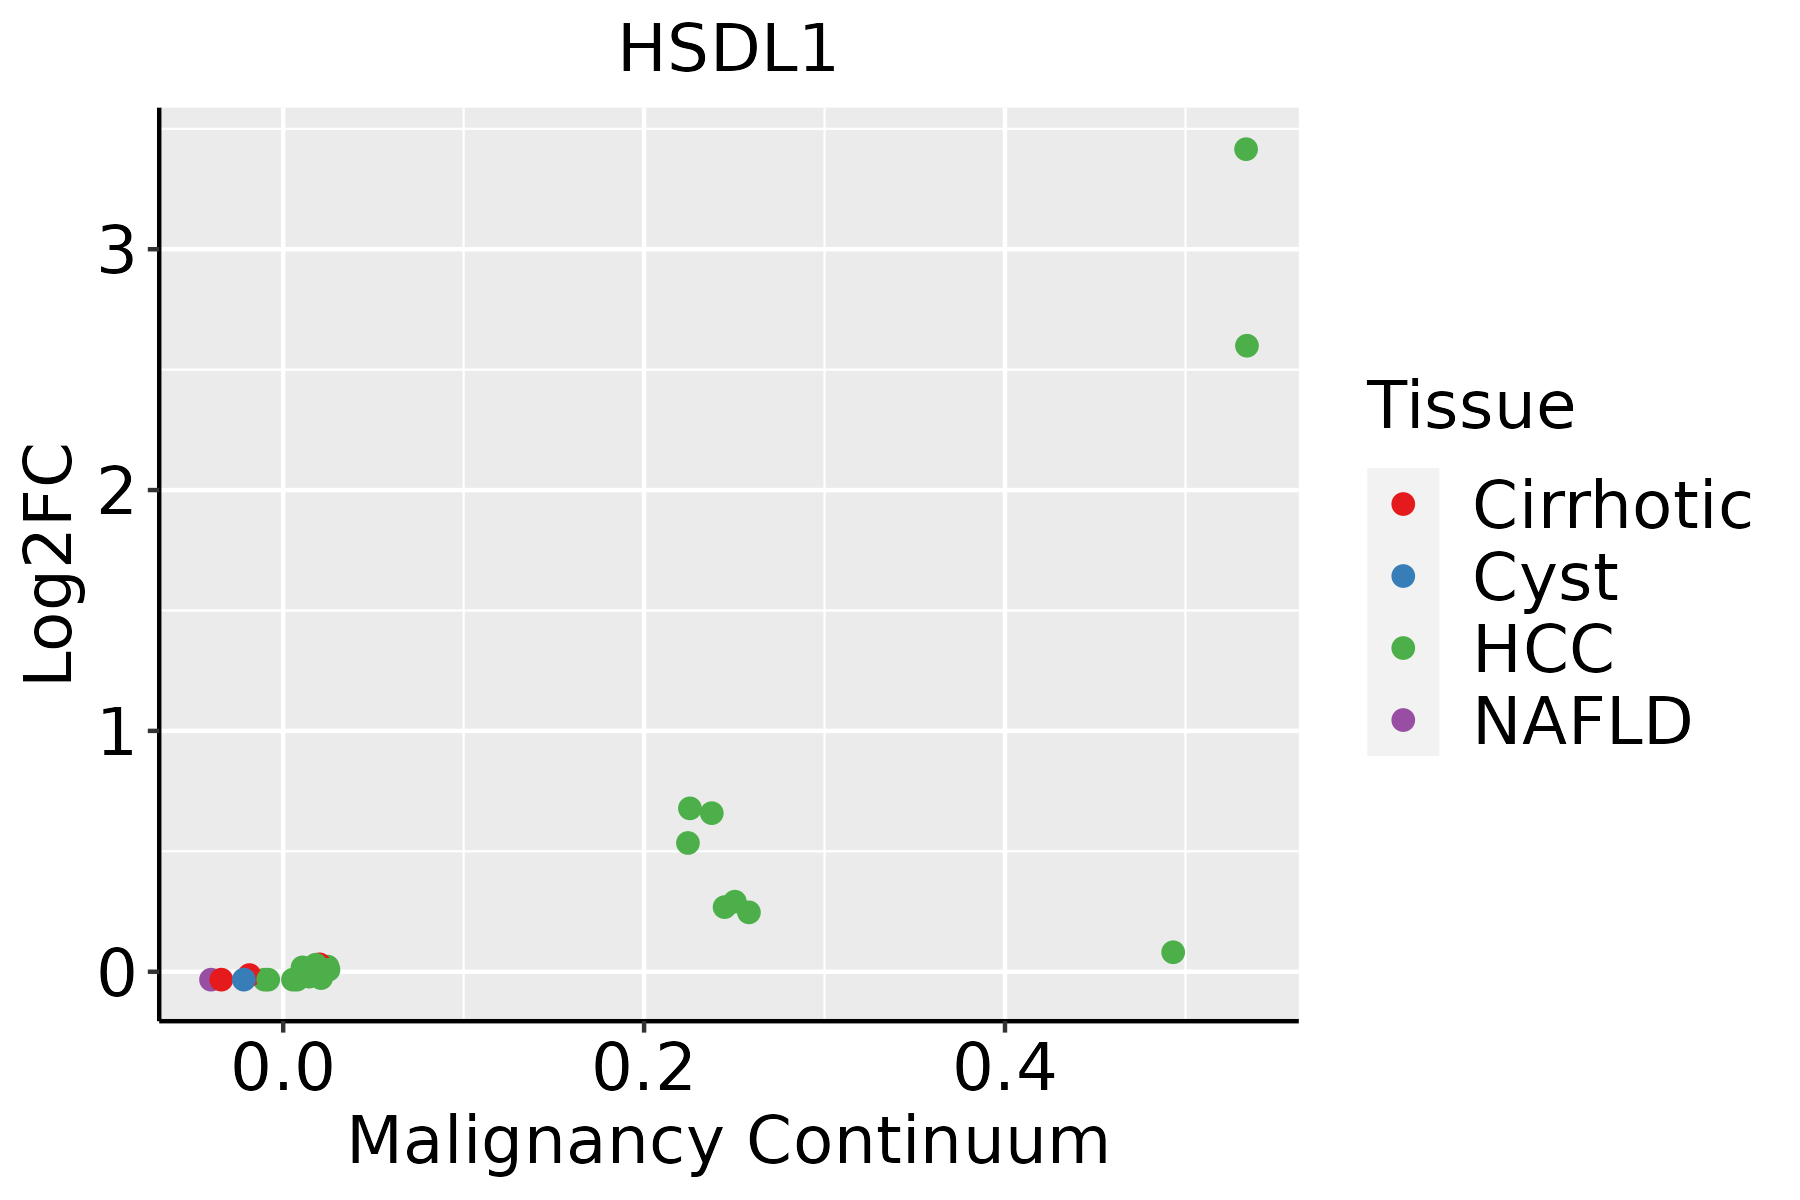 | HCC: Hepatocellular carcinoma |
| NAFLD: Non-alcoholic fatty liver disease |
| ∗log2FC in expression of this searched gene in stem-like cells from each diseased tissue sample relative to stem-like cells in normal samples in each tissue plotted against the malignancy continuum. Samples are colored based on if they are from different disease stage. |
Top |
Malignant transformation related pathway analysis |
| Find out the enriched GO biological processes and KEGG pathways involved in transition from healthy to precancer to cancer |
| Tissue | Disease Stage | Enriched GO biological Processes |
| Colorectum | AD |  |
| Colorectum | SER |  |
| Colorectum | MSS |  |
| Colorectum | MSI-H |  |
| Colorectum | FAP |  |
| ∗Top 15 enriched GO BP terms are showed in the bar plot of each disease state in each tissue. Each row represents a significant GO biological process which is colored according to the -log10(p.adjust). |
| Page: 1 2 3 4 5 6 7 8 9 |
| GO ID | Tissue | Disease Stage | Description | Gene Ratio | Bg Ratio | pvalue | p.adjust | Count |
| Page: 1 |
| Pathway ID | Tissue | Disease Stage | Description | Gene Ratio | Bg Ratio | pvalue | p.adjust | qvalue | Count |
| Page: 1 |
Top |
Cell-cell communication analysis |
| Identification of potential cell-cell interactions between two cell types and their ligand-receptor pairs for different disease states |
| Ligand | Receptor | LRpair | Pathway | Tissue | Disease Stage |
| Page: 1 |
Top |
Single-cell gene regulatory network inference analysis |
| Find out the significant the regulons (TFs) and the target genes of each regulon across cell types for different disease states |
| TF | Cell Type | Tissue | Disease Stage | Target Gene | RSS | Regulon Activity |
| ∗The dot plots of a searched regulon are shown for all cell subpopulations in each disease state of each tissue based on the regulon specific score inferred using pySCENIC and by calculating the average expression. |
| Page: 1 |
Top |
Somatic mutation of malignant transformation related genes |
| Annotation of somatic variants for genes involved in malignant transformation |
| Hugo Symbol | Variant Class | Variant Classification | dbSNP RS | HGVSc | HGVSp | HGVSp Short | SWISSPROT | BIOTYPE | SIFT | PolyPhen | Tumor Sample Barcode | Tissue | Histology | Sex | Age | Stage | Therapy Types | Drugs | Outcome |
| HSDL1 | SNV | Missense_Mutation | novel | c.391N>C | p.Glu131Gln | p.E131Q | Q3SXM5 | protein_coding | tolerated(0.14) | benign(0.145) | TCGA-AC-A3W6-01 | Breast | breast invasive carcinoma | Female | >=65 | III/IV | Unknown | Unknown | SD |
| HSDL1 | insertion | In_Frame_Ins | novel | c.925_926insAGATGTTTGTAATTTGGTTGTTTGTAATTT | p.Leu309delinsGlnMetPheValIleTrpLeuPheValIlePhe | p.L309delinsQMFVIWLFVIF | Q3SXM5 | protein_coding | TCGA-AO-A0J9-01 | Breast | breast invasive carcinoma | Female | <65 | III/IV | Chemotherapy | cyclophosphamide | PD | ||
| HSDL1 | insertion | Frame_Shift_Ins | novel | c.924_925insAAGAGTTTTGTTC | p.Leu309LysfsTer19 | p.L309Kfs*19 | Q3SXM5 | protein_coding | TCGA-AO-A0J9-01 | Breast | breast invasive carcinoma | Female | <65 | III/IV | Chemotherapy | cyclophosphamide | PD | ||
| HSDL1 | SNV | Missense_Mutation | rs756268971 | c.541G>A | p.Ala181Thr | p.A181T | Q3SXM5 | protein_coding | tolerated(0.12) | benign(0.136) | TCGA-2W-A8YY-01 | Cervix | cervical & endocervical cancer | Female | <65 | I/II | Chemotherapy | cisplatin | CR |
| HSDL1 | deletion | Frame_Shift_Del | novel | c.177_195delAGCAGACTTGATCAAGCAG | p.Arg59SerfsTer23 | p.R59Sfs*23 | Q3SXM5 | protein_coding | TCGA-VS-A8EJ-01 | Cervix | cervical & endocervical cancer | Female | <65 | I/II | Chemotherapy | cisplatin | PD | ||
| HSDL1 | SNV | Missense_Mutation | rs199812312 | c.797N>T | p.Ser266Leu | p.S266L | Q3SXM5 | protein_coding | tolerated(0.2) | benign(0.017) | TCGA-AA-3877-01 | Colorectum | colon adenocarcinoma | Female | >=65 | I/II | Unknown | Unknown | SD |
| HSDL1 | SNV | Missense_Mutation | c.97N>G | p.Thr33Ala | p.T33A | Q3SXM5 | protein_coding | tolerated(0.29) | benign(0.021) | TCGA-AA-A02R-01 | Colorectum | colon adenocarcinoma | Female | >=65 | I/II | Unknown | Unknown | PD | |
| HSDL1 | deletion | Frame_Shift_Del | c.163delC | p.Arg55AlafsTer8 | p.R55Afs*8 | Q3SXM5 | protein_coding | TCGA-CM-6171-01 | Colorectum | colon adenocarcinoma | Female | >=65 | I/II | Unknown | Unknown | SD | |||
| HSDL1 | SNV | Missense_Mutation | rs757004174 | c.164N>A | p.Arg55His | p.R55H | Q3SXM5 | protein_coding | deleterious(0.04) | benign(0.111) | TCGA-A5-A0G1-01 | Endometrium | uterine corpus endometrioid carcinoma | Female | >=65 | I/II | Unknown | Unknown | SD |
| HSDL1 | SNV | Missense_Mutation | novel | c.905N>T | p.Ala302Val | p.A302V | Q3SXM5 | protein_coding | tolerated(0.35) | benign(0.028) | TCGA-A5-A0G2-01 | Endometrium | uterine corpus endometrioid carcinoma | Female | <65 | III/IV | Unknown | Unknown | SD |
| Page: 1 2 3 4 |
Top |
Related drugs of malignant transformation related genes |
| Identification of chemicals and drugs interact with genes involved in malignant transfromation |
| (DGIdb 4.0) |
| Entrez ID | Symbol | Category | Interaction Types | Drug Claim Name | Drug Name | PMIDs |
| Page: 1 |

Copyright 2023-Present -The University of Texas Health Science Center at Houston |