
|
|||||
|
 | |
| |
| |
| |
| |
| |
|
Gene: HS6ST1 |
Gene summary for HS6ST1 |
| Gene information | Species | Human | Gene symbol | HS6ST1 | Gene ID | 9394 |
| Gene name | heparan sulfate 6-O-sulfotransferase 1 | |
| Gene Alias | HH15 | |
| Cytomap | 2q14.3 | |
| Gene Type | protein-coding | GO ID | GO:0006022 | UniProtAcc | O60243 |
Top |
Malignant transformation analysis |
| Identification of the aberrant gene expression in precancerous and cancerous lesions by comparing the gene expression of stem-like cells in diseased tissues with normal stem cells |
| Entrez ID | Symbol | Replicates | Species | Organ | Tissue | Adj P-value | Log2FC | Malignancy |
| 9394 | HS6ST1 | P23T-E | Human | Esophagus | ESCC | 5.36e-19 | 2.74e-01 | 0.108 |
| 9394 | HS6ST1 | P24T-E | Human | Esophagus | ESCC | 1.06e-04 | 1.44e-01 | 0.1287 |
| 9394 | HS6ST1 | P26T-E | Human | Esophagus | ESCC | 7.01e-08 | 3.31e-02 | 0.1276 |
| 9394 | HS6ST1 | P27T-E | Human | Esophagus | ESCC | 5.88e-09 | 9.11e-02 | 0.1055 |
| 9394 | HS6ST1 | P28T-E | Human | Esophagus | ESCC | 7.42e-24 | 3.70e-01 | 0.1149 |
| 9394 | HS6ST1 | P30T-E | Human | Esophagus | ESCC | 1.65e-28 | 9.96e-01 | 0.137 |
| 9394 | HS6ST1 | P31T-E | Human | Esophagus | ESCC | 1.85e-21 | 3.50e-01 | 0.1251 |
| 9394 | HS6ST1 | P32T-E | Human | Esophagus | ESCC | 2.27e-11 | 1.46e-01 | 0.1666 |
| 9394 | HS6ST1 | P36T-E | Human | Esophagus | ESCC | 3.39e-14 | 3.55e-01 | 0.1187 |
| 9394 | HS6ST1 | P37T-E | Human | Esophagus | ESCC | 1.07e-15 | 2.85e-01 | 0.1371 |
| 9394 | HS6ST1 | P39T-E | Human | Esophagus | ESCC | 8.27e-06 | 1.21e-01 | 0.0894 |
| 9394 | HS6ST1 | P40T-E | Human | Esophagus | ESCC | 3.24e-09 | 2.07e-01 | 0.109 |
| 9394 | HS6ST1 | P42T-E | Human | Esophagus | ESCC | 9.14e-12 | 2.56e-01 | 0.1175 |
| 9394 | HS6ST1 | P44T-E | Human | Esophagus | ESCC | 8.39e-06 | 8.86e-02 | 0.1096 |
| 9394 | HS6ST1 | P47T-E | Human | Esophagus | ESCC | 5.98e-15 | 1.62e-01 | 0.1067 |
| 9394 | HS6ST1 | P48T-E | Human | Esophagus | ESCC | 3.87e-18 | 4.12e-01 | 0.0959 |
| 9394 | HS6ST1 | P49T-E | Human | Esophagus | ESCC | 9.82e-05 | 1.81e-01 | 0.1768 |
| 9394 | HS6ST1 | P52T-E | Human | Esophagus | ESCC | 2.00e-21 | 3.60e-01 | 0.1555 |
| 9394 | HS6ST1 | P54T-E | Human | Esophagus | ESCC | 1.78e-10 | 2.22e-01 | 0.0975 |
| 9394 | HS6ST1 | P56T-E | Human | Esophagus | ESCC | 6.88e-08 | 9.76e-01 | 0.1613 |
| Page: 1 2 3 4 5 |
| Tissue | Expression Dynamics | Abbreviation |
| Esophagus | 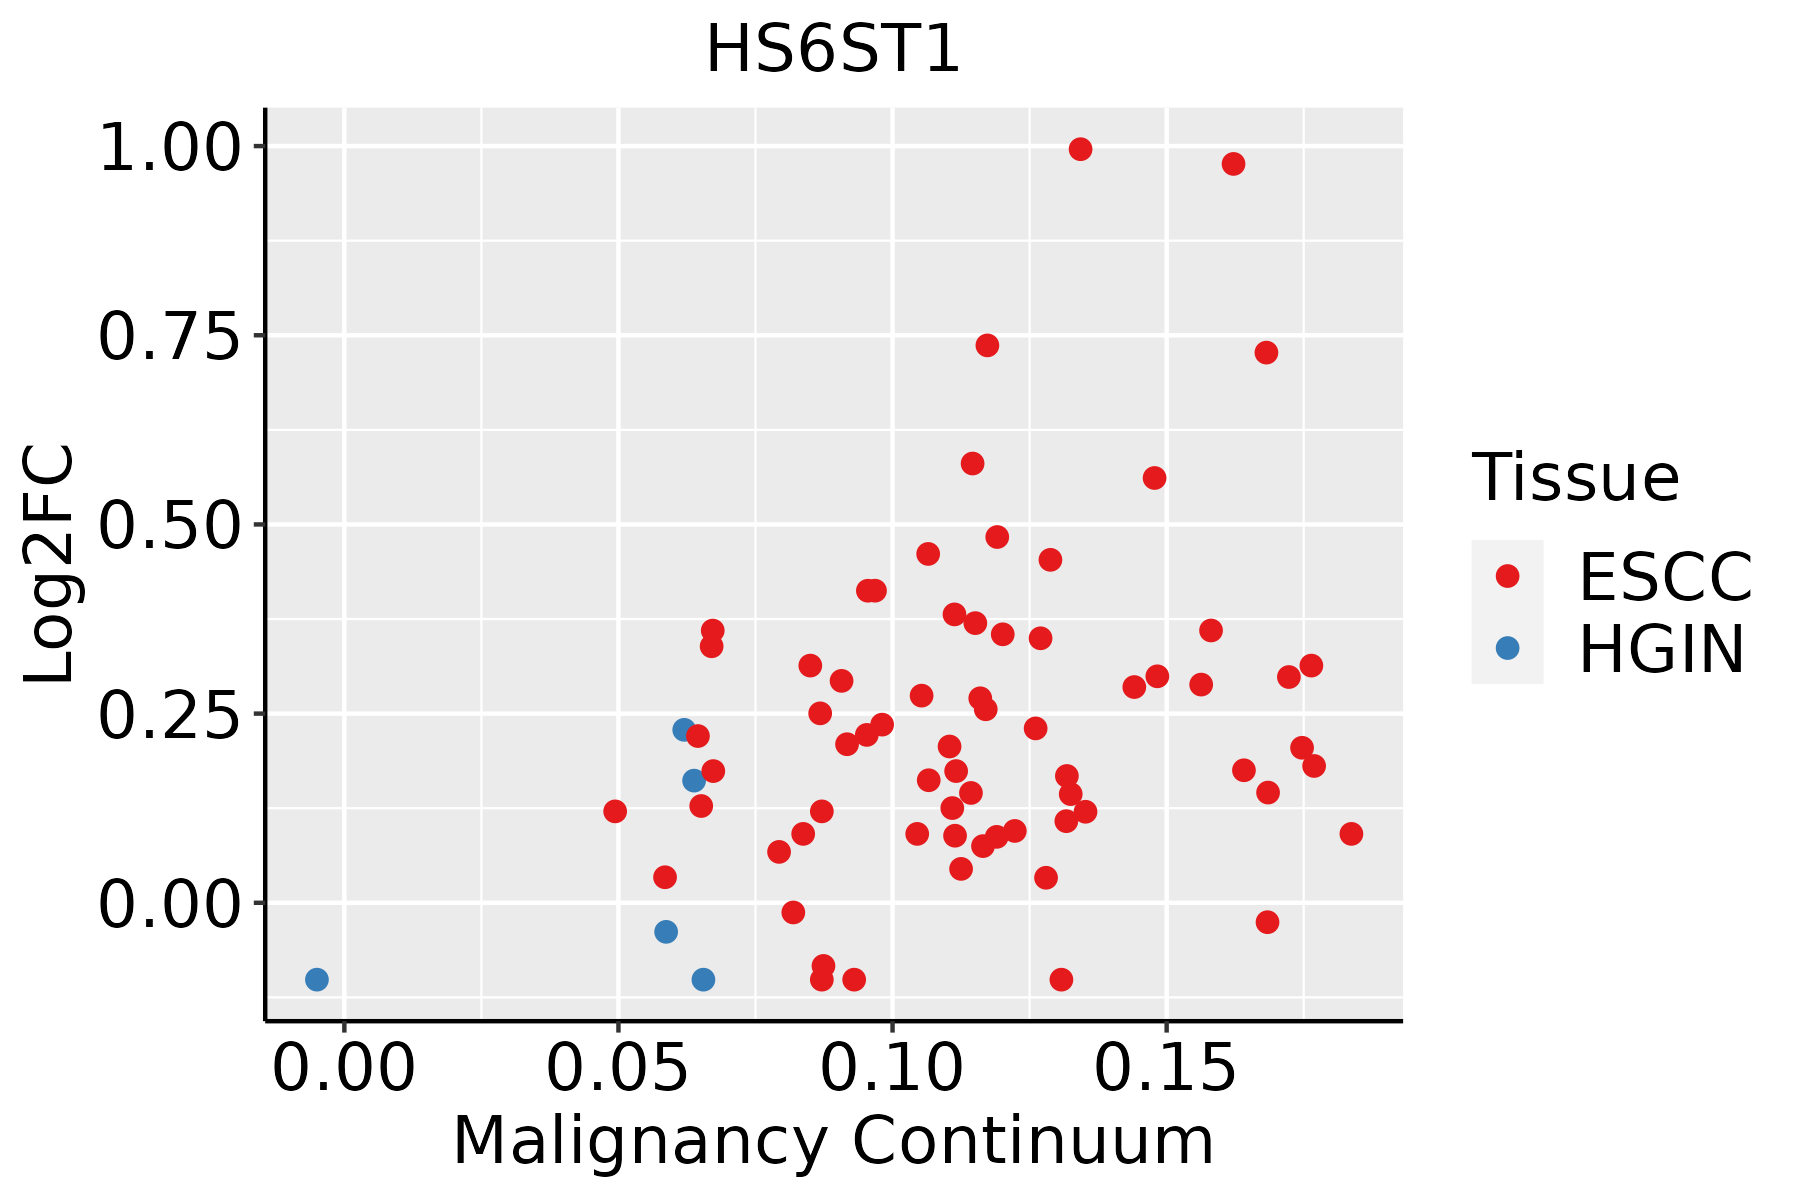 | ESCC: Esophageal squamous cell carcinoma |
| HGIN: High-grade intraepithelial neoplasias | ||
| LGIN: Low-grade intraepithelial neoplasias | ||
| Liver | 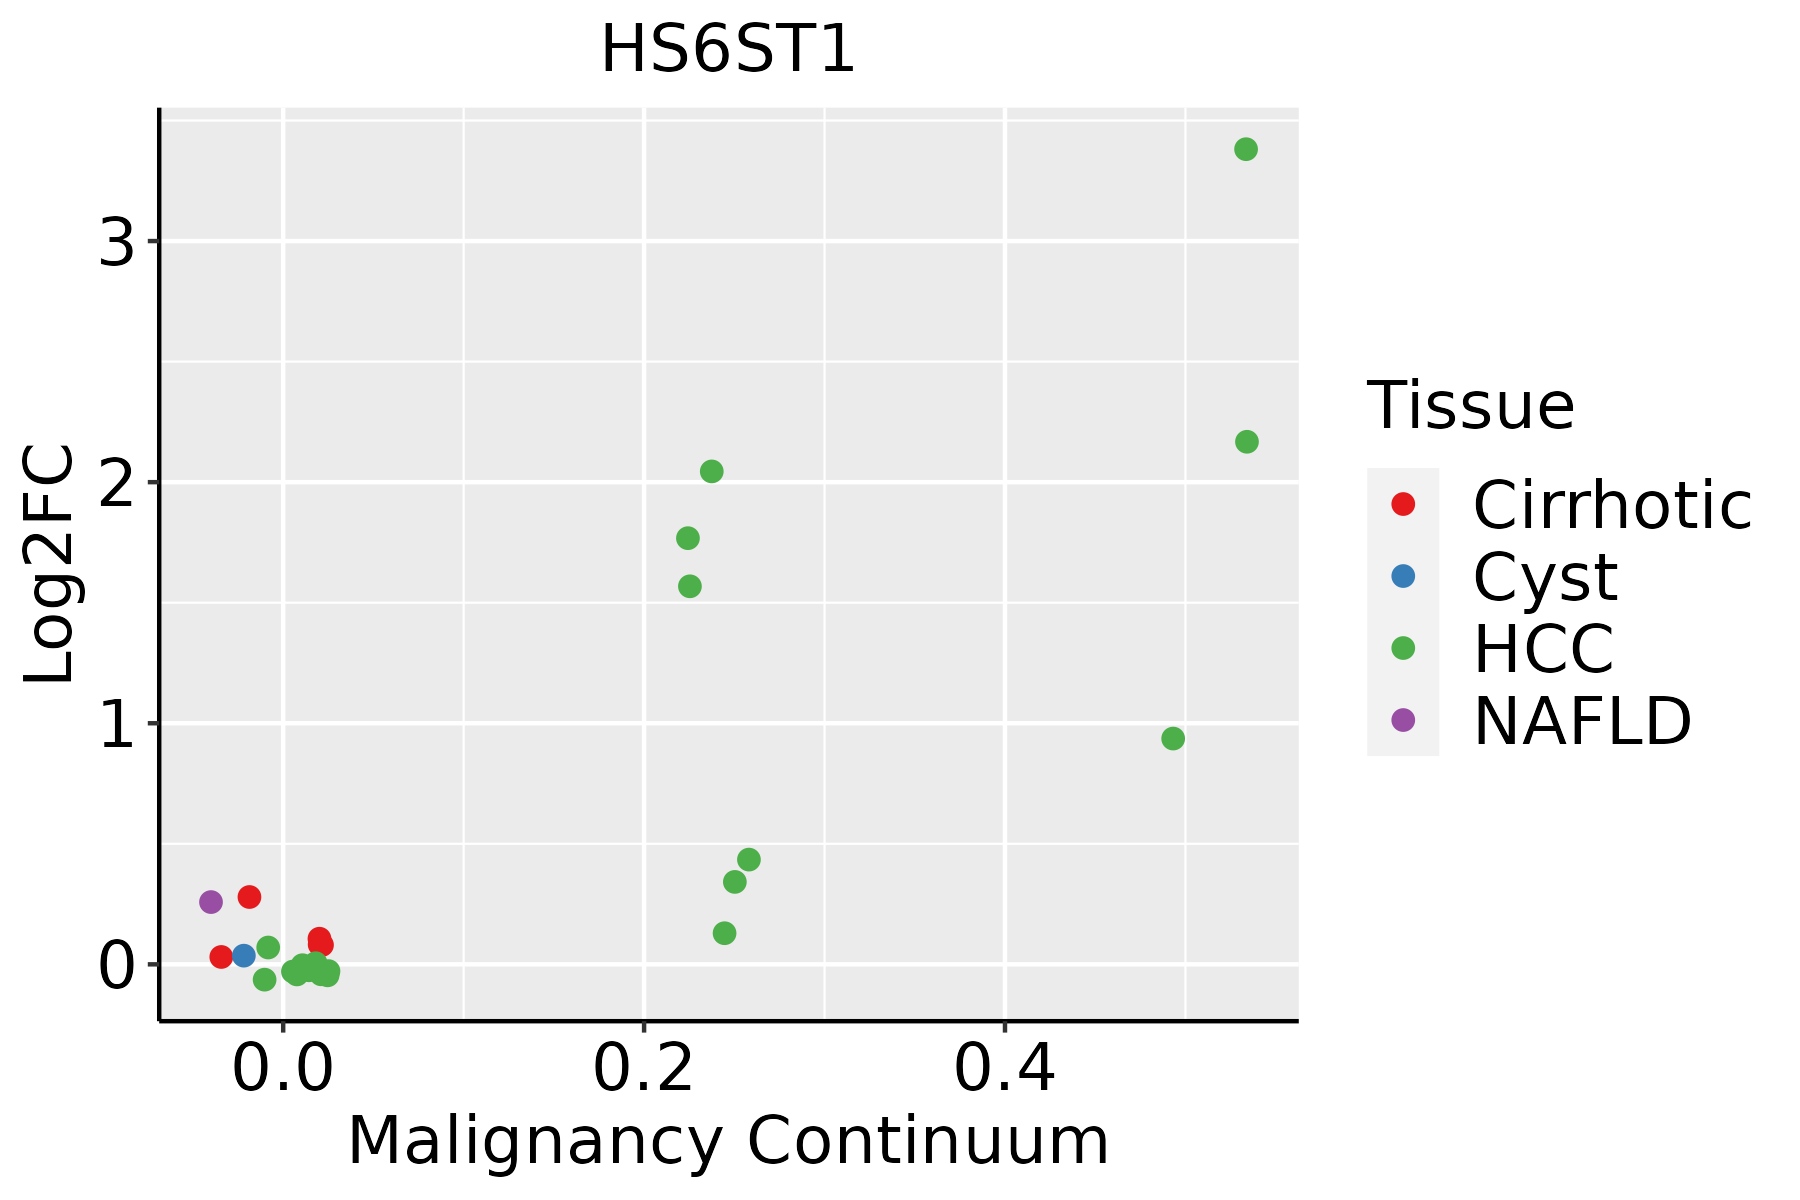 | HCC: Hepatocellular carcinoma |
| NAFLD: Non-alcoholic fatty liver disease | ||
| Oral Cavity |  | EOLP: Erosive Oral lichen planus |
| LP: leukoplakia | ||
| NEOLP: Non-erosive oral lichen planus | ||
| OSCC: Oral squamous cell carcinoma | ||
| Thyroid | 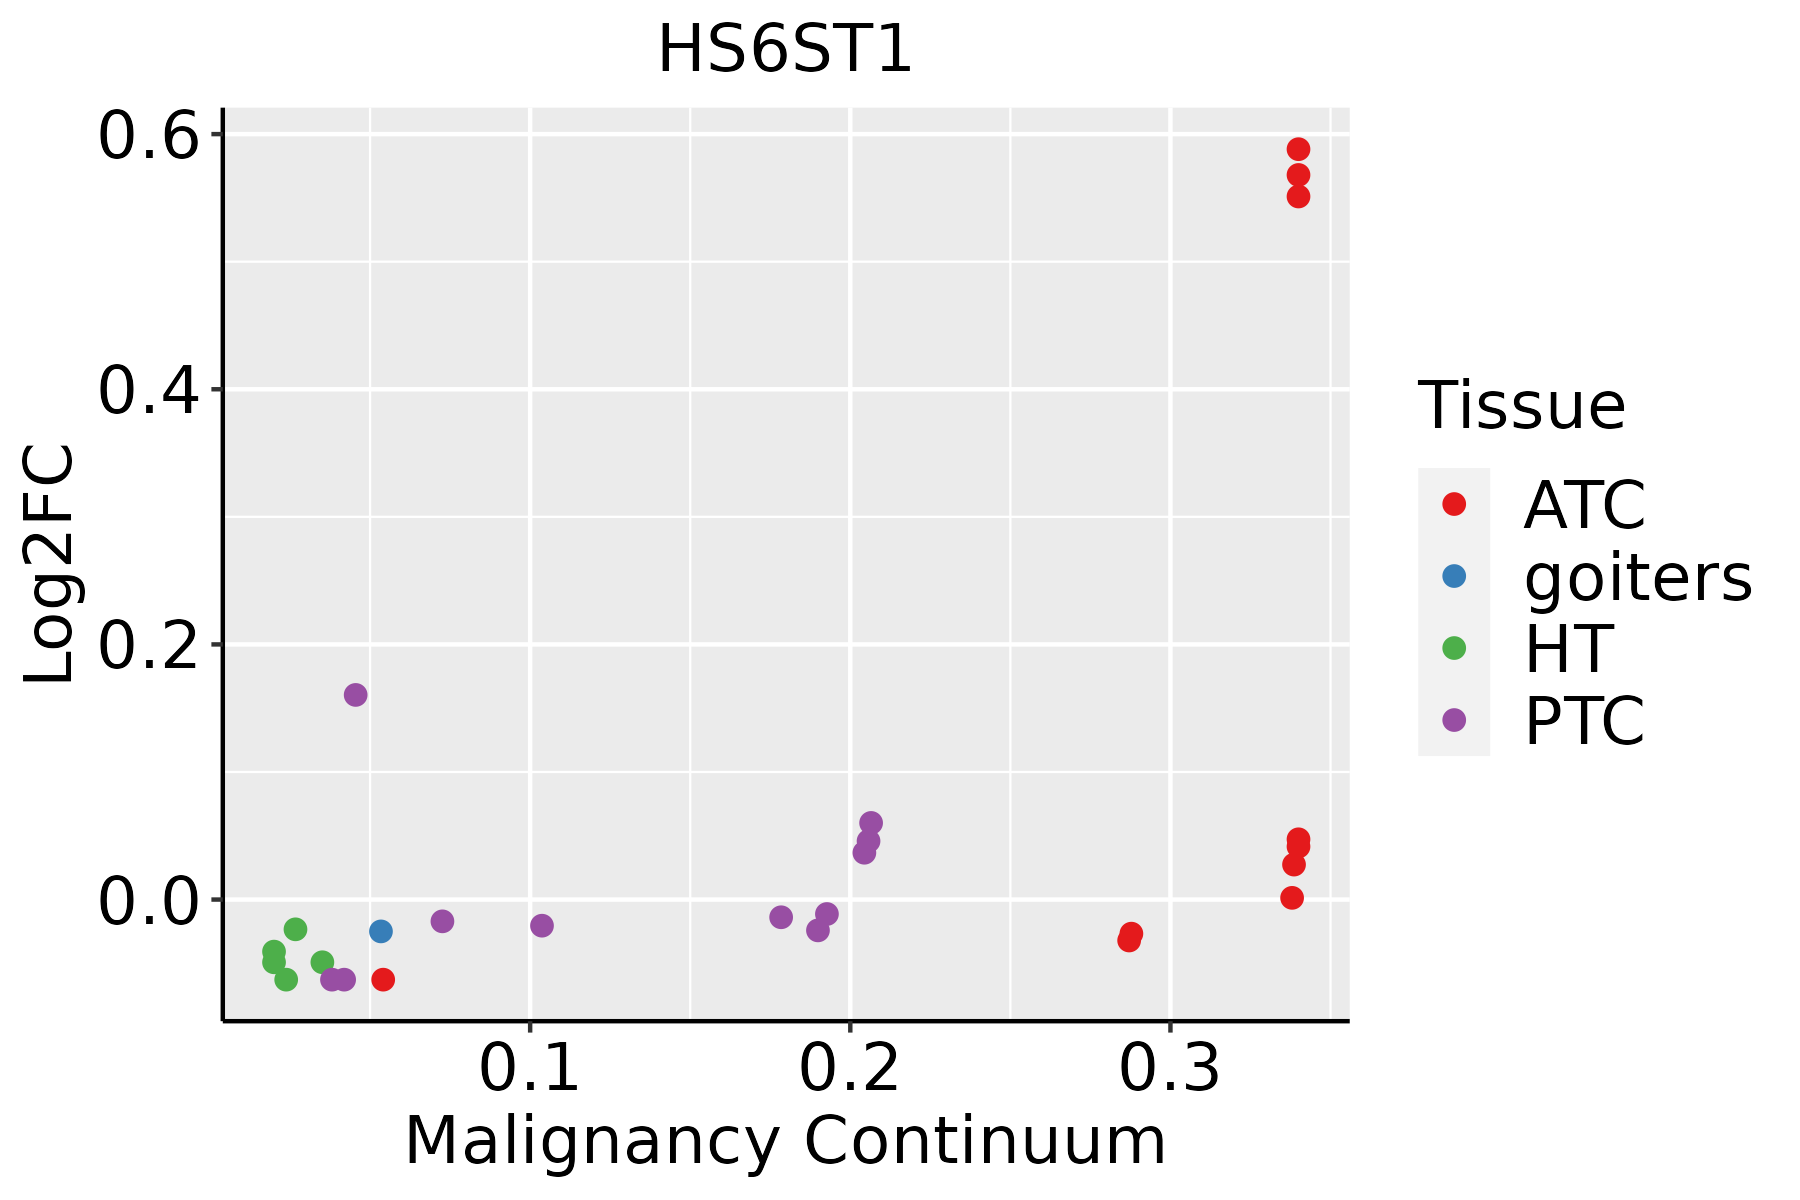 | ATC: Anaplastic thyroid cancer |
| HT: Hashimoto's thyroiditis | ||
| PTC: Papillary thyroid cancer |
| ∗log2FC in expression of this searched gene in stem-like cells from each diseased tissue sample relative to stem-like cells in normal samples in each tissue plotted against the malignancy continuum. Samples are colored based on if they are from different disease stage. |
Top |
Malignant transformation related pathway analysis |
| Find out the enriched GO biological processes and KEGG pathways involved in transition from healthy to precancer to cancer |
| Tissue | Disease Stage | Enriched GO biological Processes |
| Colorectum | AD |  |
| Colorectum | SER |  |
| Colorectum | MSS |  |
| Colorectum | MSI-H |  |
| Colorectum | FAP |  |
| ∗Top 15 enriched GO BP terms are showed in the bar plot of each disease state in each tissue. Each row represents a significant GO biological process which is colored according to the -log10(p.adjust). |
| Page: 1 2 3 4 5 6 7 8 9 |
| GO ID | Tissue | Disease Stage | Description | Gene Ratio | Bg Ratio | pvalue | p.adjust | Count |
| GO:00091002 | Esophagus | ESCC | glycoprotein metabolic process | 226/8552 | 387/18723 | 2.64e-07 | 3.94e-06 | 226 |
| GO:00091012 | Esophagus | ESCC | glycoprotein biosynthetic process | 181/8552 | 317/18723 | 2.54e-05 | 2.15e-04 | 181 |
| GO:0006029 | Esophagus | ESCC | proteoglycan metabolic process | 48/8552 | 79/18723 | 4.93e-03 | 1.89e-02 | 48 |
| GO:0030166 | Esophagus | ESCC | proteoglycan biosynthetic process | 35/8552 | 56/18723 | 8.30e-03 | 2.94e-02 | 35 |
| GO:0006024 | Esophagus | ESCC | glycosaminoglycan biosynthetic process | 45/8552 | 75/18723 | 8.75e-03 | 3.08e-02 | 45 |
| GO:0006023 | Esophagus | ESCC | aminoglycan biosynthetic process | 47/8552 | 79/18723 | 9.29e-03 | 3.23e-02 | 47 |
| GO:0030201 | Esophagus | ESCC | heparan sulfate proteoglycan metabolic process | 21/8552 | 31/18723 | 1.10e-02 | 3.70e-02 | 21 |
| GO:0009100 | Liver | HCC | glycoprotein metabolic process | 193/7958 | 387/18723 | 1.89e-03 | 9.62e-03 | 193 |
| GO:00091001 | Oral cavity | OSCC | glycoprotein metabolic process | 185/7305 | 387/18723 | 2.37e-04 | 1.54e-03 | 185 |
| GO:00091011 | Oral cavity | OSCC | glycoprotein biosynthetic process | 151/7305 | 317/18723 | 1.01e-03 | 5.26e-03 | 151 |
| GO:00091013 | Thyroid | PTC | glycoprotein biosynthetic process | 123/5968 | 317/18723 | 5.05e-03 | 2.33e-02 | 123 |
| GO:00091003 | Thyroid | PTC | glycoprotein metabolic process | 147/5968 | 387/18723 | 5.87e-03 | 2.64e-02 | 147 |
| GO:000910011 | Thyroid | ATC | glycoprotein metabolic process | 153/6293 | 387/18723 | 7.90e-03 | 3.06e-02 | 153 |
| Page: 1 |
| Pathway ID | Tissue | Disease Stage | Description | Gene Ratio | Bg Ratio | pvalue | p.adjust | qvalue | Count |
| Page: 1 |
Top |
Cell-cell communication analysis |
| Identification of potential cell-cell interactions between two cell types and their ligand-receptor pairs for different disease states |
| Ligand | Receptor | LRpair | Pathway | Tissue | Disease Stage |
| Page: 1 |
Top |
Single-cell gene regulatory network inference analysis |
| Find out the significant the regulons (TFs) and the target genes of each regulon across cell types for different disease states |
| TF | Cell Type | Tissue | Disease Stage | Target Gene | RSS | Regulon Activity |
| ∗The dot plots of a searched regulon are shown for all cell subpopulations in each disease state of each tissue based on the regulon specific score inferred using pySCENIC and by calculating the average expression. |
| Page: 1 |
Top |
Somatic mutation of malignant transformation related genes |
| Annotation of somatic variants for genes involved in malignant transformation |
| Hugo Symbol | Variant Class | Variant Classification | dbSNP RS | HGVSc | HGVSp | HGVSp Short | SWISSPROT | BIOTYPE | SIFT | PolyPhen | Tumor Sample Barcode | Tissue | Histology | Sex | Age | Stage | Therapy Types | Drugs | Outcome |
| HS6ST1 | SNV | Missense_Mutation | rs879255383 | c.233N>T | p.Ser78Leu | p.S78L | O60243 | protein_coding | tolerated(0.29) | benign(0.003) | TCGA-D8-A1J8-01 | Breast | breast invasive carcinoma | Female | >=65 | I/II | Hormone Therapy | nolvadex | SD |
| HS6ST1 | SNV | Missense_Mutation | c.924N>G | p.Phe308Leu | p.F308L | O60243 | protein_coding | deleterious(0.01) | probably_damaging(0.982) | TCGA-E2-A10C-01 | Breast | breast invasive carcinoma | Female | <65 | I/II | Chemotherapy | cytoxan | SD | |
| HS6ST1 | SNV | Missense_Mutation | novel | c.956A>G | p.Tyr319Cys | p.Y319C | O60243 | protein_coding | deleterious(0.02) | probably_damaging(0.998) | TCGA-2W-A8YY-01 | Cervix | cervical & endocervical cancer | Female | <65 | I/II | Chemotherapy | cisplatin | CR |
| HS6ST1 | SNV | Missense_Mutation | c.1145N>T | p.Arg382Leu | p.R382L | O60243 | protein_coding | tolerated(0.1) | benign(0.141) | TCGA-AA-3492-01 | Colorectum | colon adenocarcinoma | Female | >=65 | I/II | Unknown | Unknown | SD | |
| HS6ST1 | SNV | Missense_Mutation | novel | c.865N>A | p.Ala289Thr | p.A289T | O60243 | protein_coding | deleterious(0.04) | probably_damaging(0.996) | TCGA-AA-A010-01 | Colorectum | colon adenocarcinoma | Female | <65 | I/II | Chemotherapy | folinic | CR |
| HS6ST1 | SNV | Missense_Mutation | rs773632691 | c.754N>T | p.Arg252Cys | p.R252C | O60243 | protein_coding | deleterious(0) | probably_damaging(0.986) | TCGA-AA-A010-01 | Colorectum | colon adenocarcinoma | Female | <65 | I/II | Chemotherapy | folinic | CR |
| HS6ST1 | SNV | Missense_Mutation | c.589N>T | p.His197Tyr | p.H197Y | O60243 | protein_coding | deleterious(0) | probably_damaging(0.988) | TCGA-AA-A01P-01 | Colorectum | colon adenocarcinoma | Female | >=65 | III/IV | Unknown | Unknown | PD | |
| HS6ST1 | SNV | Missense_Mutation | c.1051G>A | p.Ala351Thr | p.A351T | O60243 | protein_coding | deleterious(0) | probably_damaging(0.996) | TCGA-AD-6964-01 | Colorectum | colon adenocarcinoma | Male | <65 | III/IV | Chemotherapy | folfox | PD | |
| HS6ST1 | SNV | Missense_Mutation | rs762113887 | c.893N>A | p.Arg298His | p.R298H | O60243 | protein_coding | deleterious(0) | probably_damaging(0.997) | TCGA-AZ-4313-01 | Colorectum | colon adenocarcinoma | Female | <65 | I/II | Unknown | Unknown | SD |
| HS6ST1 | SNV | Missense_Mutation | rs773632691 | c.754N>T | p.Arg252Cys | p.R252C | O60243 | protein_coding | deleterious(0) | probably_damaging(0.986) | TCGA-CM-4743-01 | Colorectum | colon adenocarcinoma | Male | >=65 | I/II | Chemotherapy | capecitabine | SD |
| Page: 1 2 3 4 |
Top |
Related drugs of malignant transformation related genes |
| Identification of chemicals and drugs interact with genes involved in malignant transfromation |
| (DGIdb 4.0) |
| Entrez ID | Symbol | Category | Interaction Types | Drug Claim Name | Drug Name | PMIDs |
| Page: 1 |

Copyright 2023-Present -The University of Texas Health Science Center at Houston |