
|
|||||
|
 | |
| |
| |
| |
| |
| |
|
Gene: HIST1H2BJ |
Gene summary for HIST1H2BJ |
| Gene information | Species | Human | Gene symbol | HIST1H2BJ | Gene ID | 8970 |
| Gene name | H2B clustered histone 11 | |
| Gene Alias | H2B/r | |
| Cytomap | 6p22.1 | |
| Gene Type | protein-coding | GO ID | GO:0001906 | UniProtAcc | A0A024RCJ2 |
Top |
Malignant transformation analysis |
| Identification of the aberrant gene expression in precancerous and cancerous lesions by comparing the gene expression of stem-like cells in diseased tissues with normal stem cells |
| Entrez ID | Symbol | Replicates | Species | Organ | Tissue | Adj P-value | Log2FC | Malignancy |
| 8970 | HIST1H2BJ | P12T-E | Human | Esophagus | ESCC | 4.75e-35 | 8.77e-01 | 0.1122 |
| 8970 | HIST1H2BJ | P15T-E | Human | Esophagus | ESCC | 1.95e-05 | 2.84e-01 | 0.1149 |
| 8970 | HIST1H2BJ | P16T-E | Human | Esophagus | ESCC | 1.42e-08 | 2.18e-01 | 0.1153 |
| 8970 | HIST1H2BJ | P17T-E | Human | Esophagus | ESCC | 5.94e-03 | 2.68e-01 | 0.1278 |
| 8970 | HIST1H2BJ | P20T-E | Human | Esophagus | ESCC | 1.29e-39 | 1.47e+00 | 0.1124 |
| 8970 | HIST1H2BJ | P21T-E | Human | Esophagus | ESCC | 1.98e-02 | 1.27e-01 | 0.1617 |
| 8970 | HIST1H2BJ | P22T-E | Human | Esophagus | ESCC | 2.90e-18 | 4.15e-01 | 0.1236 |
| 8970 | HIST1H2BJ | P23T-E | Human | Esophagus | ESCC | 2.13e-12 | 8.27e-01 | 0.108 |
| 8970 | HIST1H2BJ | P24T-E | Human | Esophagus | ESCC | 5.99e-13 | 3.78e-01 | 0.1287 |
| 8970 | HIST1H2BJ | P26T-E | Human | Esophagus | ESCC | 3.58e-08 | 2.48e-01 | 0.1276 |
| 8970 | HIST1H2BJ | P27T-E | Human | Esophagus | ESCC | 3.65e-25 | 6.41e-01 | 0.1055 |
| 8970 | HIST1H2BJ | P28T-E | Human | Esophagus | ESCC | 1.57e-10 | 3.24e-01 | 0.1149 |
| 8970 | HIST1H2BJ | P30T-E | Human | Esophagus | ESCC | 7.62e-08 | 5.11e-01 | 0.137 |
| 8970 | HIST1H2BJ | P31T-E | Human | Esophagus | ESCC | 1.51e-19 | 6.66e-01 | 0.1251 |
| 8970 | HIST1H2BJ | P32T-E | Human | Esophagus | ESCC | 7.84e-06 | 2.05e-01 | 0.1666 |
| 8970 | HIST1H2BJ | P36T-E | Human | Esophagus | ESCC | 5.07e-05 | 3.47e-01 | 0.1187 |
| 8970 | HIST1H2BJ | P37T-E | Human | Esophagus | ESCC | 7.04e-12 | 2.26e-01 | 0.1371 |
| 8970 | HIST1H2BJ | P39T-E | Human | Esophagus | ESCC | 3.24e-19 | 5.02e-01 | 0.0894 |
| 8970 | HIST1H2BJ | P40T-E | Human | Esophagus | ESCC | 3.41e-07 | 1.86e-01 | 0.109 |
| 8970 | HIST1H2BJ | P42T-E | Human | Esophagus | ESCC | 1.66e-07 | 3.70e-01 | 0.1175 |
| Page: 1 2 3 4 |
| Tissue | Expression Dynamics | Abbreviation |
| Cervix | 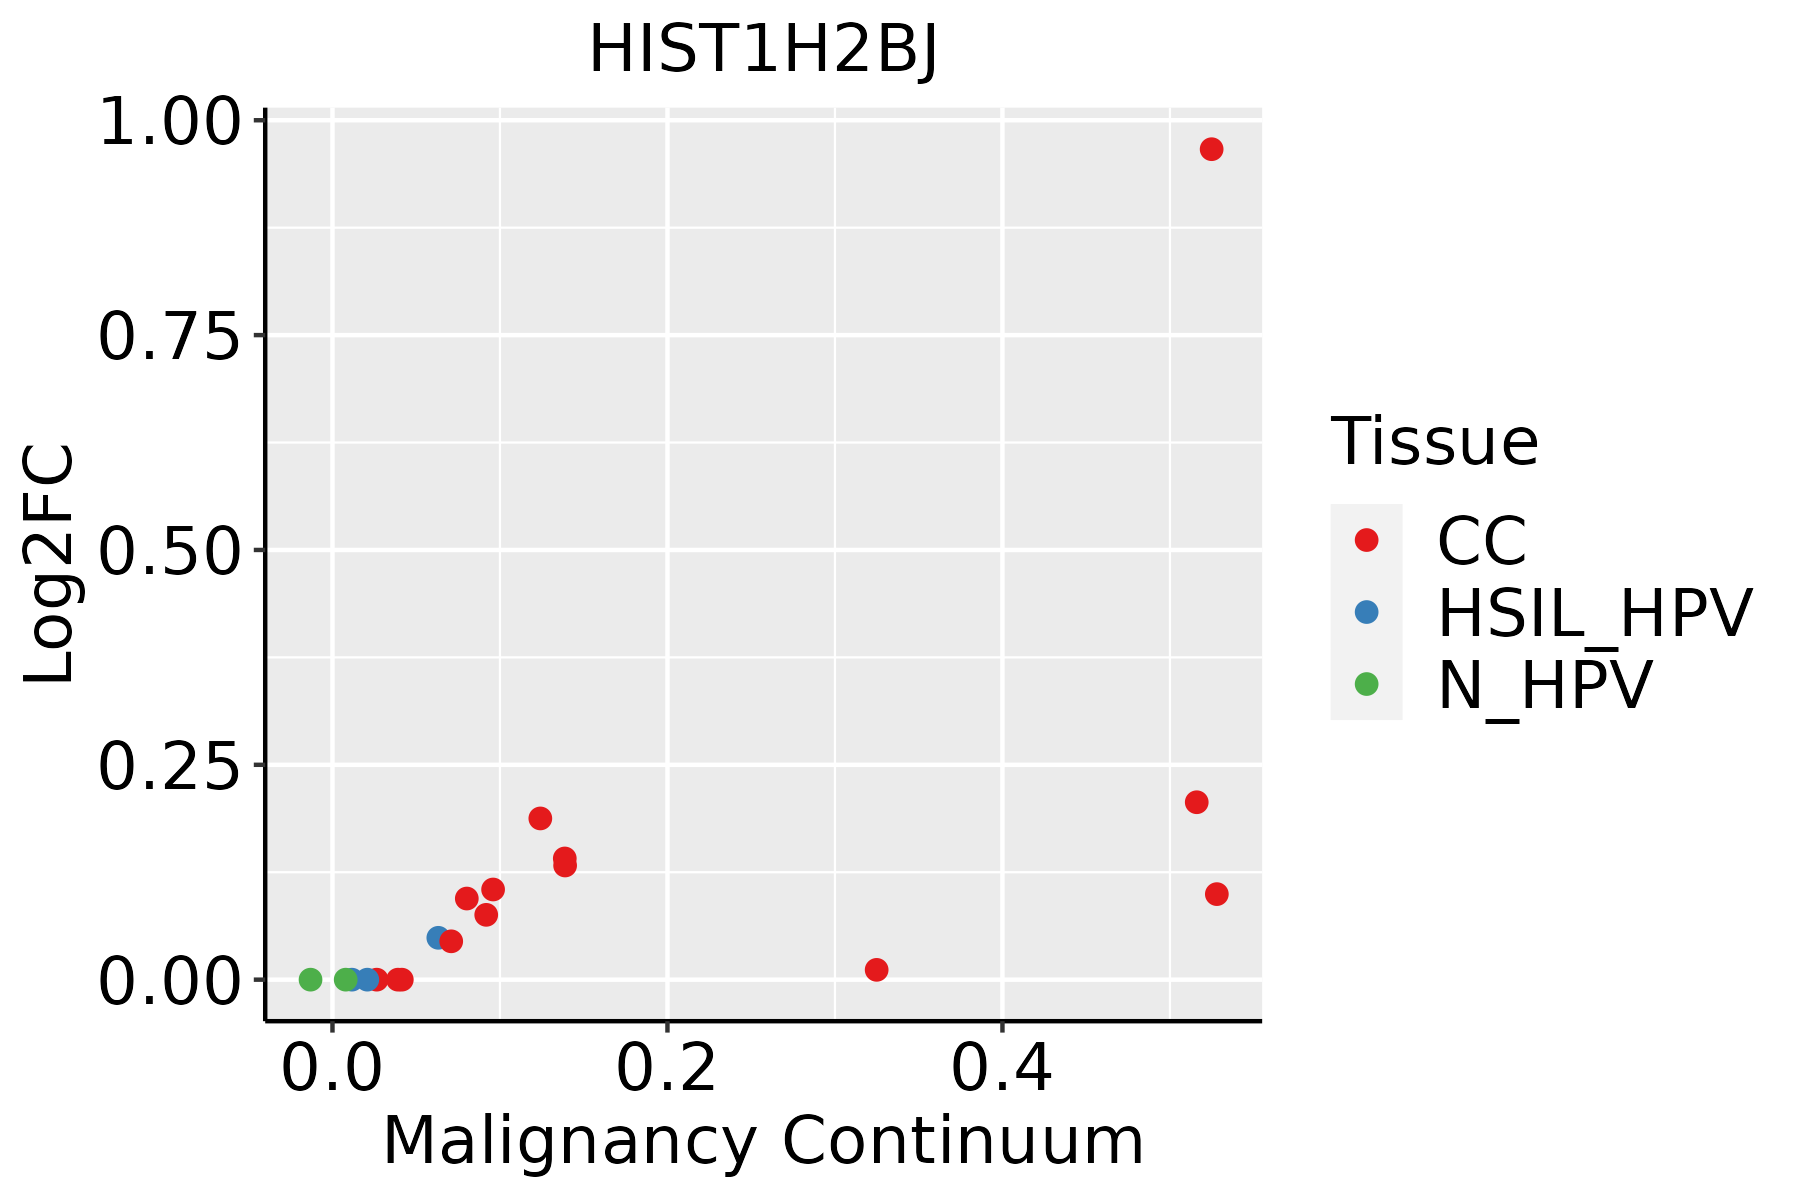 | CC: Cervix cancer |
| HSIL_HPV: HPV-infected high-grade squamous intraepithelial lesions | ||
| N_HPV: HPV-infected normal cervix | ||
| Esophagus | 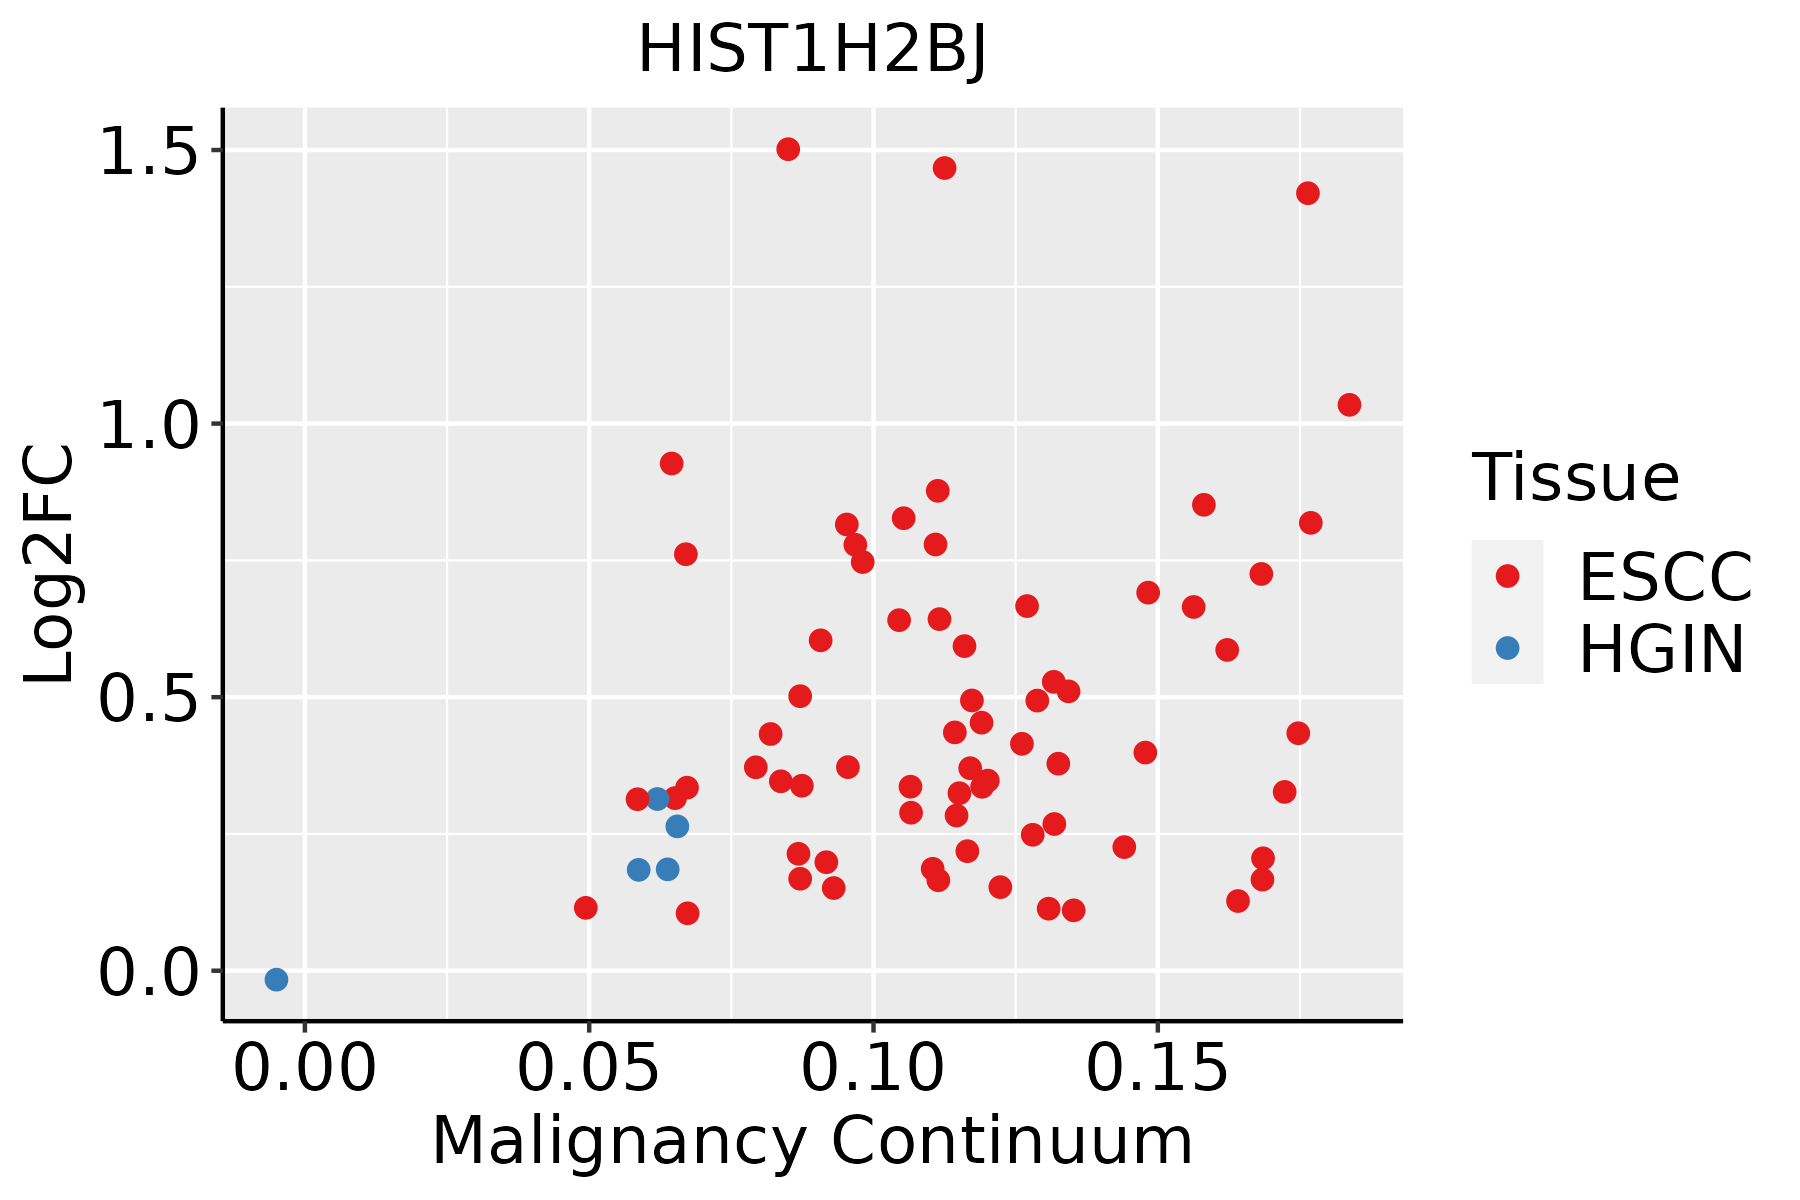 | ESCC: Esophageal squamous cell carcinoma |
| HGIN: High-grade intraepithelial neoplasias | ||
| LGIN: Low-grade intraepithelial neoplasias | ||
| Oral Cavity |  | EOLP: Erosive Oral lichen planus |
| LP: leukoplakia | ||
| NEOLP: Non-erosive oral lichen planus | ||
| OSCC: Oral squamous cell carcinoma |
| ∗log2FC in expression of this searched gene in stem-like cells from each diseased tissue sample relative to stem-like cells in normal samples in each tissue plotted against the malignancy continuum. Samples are colored based on if they are from different disease stage. |
Top |
Malignant transformation related pathway analysis |
| Find out the enriched GO biological processes and KEGG pathways involved in transition from healthy to precancer to cancer |
| Tissue | Disease Stage | Enriched GO biological Processes |
| Colorectum | AD |  |
| Colorectum | SER |  |
| Colorectum | MSS |  |
| Colorectum | MSI-H |  |
| Colorectum | FAP |  |
| ∗Top 15 enriched GO BP terms are showed in the bar plot of each disease state in each tissue. Each row represents a significant GO biological process which is colored according to the -log10(p.adjust). |
| Page: 1 2 3 4 5 6 7 8 9 |
| GO ID | Tissue | Disease Stage | Description | Gene Ratio | Bg Ratio | pvalue | p.adjust | Count |
| Page: 1 |
| Pathway ID | Tissue | Disease Stage | Description | Gene Ratio | Bg Ratio | pvalue | p.adjust | qvalue | Count |
| Page: 1 |
Top |
Cell-cell communication analysis |
| Identification of potential cell-cell interactions between two cell types and their ligand-receptor pairs for different disease states |
| Ligand | Receptor | LRpair | Pathway | Tissue | Disease Stage |
| Page: 1 |
Top |
Single-cell gene regulatory network inference analysis |
| Find out the significant the regulons (TFs) and the target genes of each regulon across cell types for different disease states |
| TF | Cell Type | Tissue | Disease Stage | Target Gene | RSS | Regulon Activity |
| ∗The dot plots of a searched regulon are shown for all cell subpopulations in each disease state of each tissue based on the regulon specific score inferred using pySCENIC and by calculating the average expression. |
| Page: 1 |
Top |
Somatic mutation of malignant transformation related genes |
| Annotation of somatic variants for genes involved in malignant transformation |
| Hugo Symbol | Variant Class | Variant Classification | dbSNP RS | HGVSc | HGVSp | HGVSp Short | SWISSPROT | BIOTYPE | SIFT | PolyPhen | Tumor Sample Barcode | Tissue | Histology | Sex | Age | Stage | Therapy Types | Drugs | Outcome |
| HIST1H2BJ | SNV | Missense_Mutation | c.178N>C | p.Met60Leu | p.M60L | P06899 | protein_coding | deleterious_low_confidence(0.01) | benign(0.039) | TCGA-A2-A25B-01 | Breast | breast invasive carcinoma | Female | <65 | I/II | Chemotherapy | taxotere | PD | |
| HIST1H2BJ | insertion | Frame_Shift_Ins | novel | c.18_19insCACGCCGTGTCCGAGGG | p.Ser7HisfsTer19 | p.S7Hfs*19 | P06899 | protein_coding | TCGA-AO-A0JF-01 | Breast | breast invasive carcinoma | Female | >=65 | I/II | Chemotherapy | doxorubicin | SD | ||
| HIST1H2BJ | SNV | Missense_Mutation | c.340N>A | p.Glu114Lys | p.E114K | P06899 | protein_coding | tolerated_low_confidence(0.07) | benign(0.124) | TCGA-AZ-6599-01 | Colorectum | colon adenocarcinoma | Male | >=65 | I/II | Unknown | Unknown | SD | |
| HIST1H2BJ | SNV | Missense_Mutation | c.80N>T | p.Gly27Val | p.G27V | P06899 | protein_coding | deleterious_low_confidence(0) | possibly_damaging(0.821) | TCGA-F4-6461-01 | Colorectum | colon adenocarcinoma | Female | <65 | III/IV | Unknown | Unknown | PD | |
| HIST1H2BJ | SNV | Missense_Mutation | novel | c.116N>A | p.Ser39Tyr | p.S39Y | P06899 | protein_coding | deleterious_low_confidence(0) | possibly_damaging(0.781) | TCGA-AX-A1CE-01 | Endometrium | uterine corpus endometrioid carcinoma | Female | <65 | I/II | Unspecific | Paclitaxel | SD |
| HIST1H2BJ | SNV | Missense_Mutation | c.48N>T | p.Lys16Asn | p.K16N | P06899 | protein_coding | deleterious_low_confidence(0.01) | benign(0.217) | TCGA-EO-A22X-01 | Endometrium | uterine corpus endometrioid carcinoma | Female | <65 | III/IV | Unspecific | Carboplatin | Complete Response | |
| HIST1H2BJ | SNV | Missense_Mutation | c.144N>C | p.Gln48His | p.Q48H | P06899 | protein_coding | deleterious_low_confidence(0) | probably_damaging(0.968) | TCGA-50-6591-01 | Lung | lung adenocarcinoma | Female | <65 | III/IV | Unknown | Unknown | PD | |
| HIST1H2BJ | SNV | Missense_Mutation | novel | c.278N>C | p.Arg93Thr | p.R93T | P06899 | protein_coding | deleterious_low_confidence(0) | probably_damaging(0.982) | TCGA-55-8506-01 | Lung | lung adenocarcinoma | Female | <65 | I/II | Unknown | Unknown | SD |
| HIST1H2BJ | SNV | Missense_Mutation | c.10N>A | p.Pro4Thr | p.P4T | P06899 | protein_coding | tolerated_low_confidence(0.17) | benign(0) | TCGA-CV-6436-01 | Oral cavity | head & neck squamous cell carcinoma | Male | <65 | I/II | Unknown | Unknown | SD | |
| HIST1H2BJ | SNV | Missense_Mutation | novel | c.310N>T | p.Pro104Ser | p.P104S | P06899 | protein_coding | deleterious_low_confidence(0) | probably_damaging(0.99) | TCGA-WA-A7GZ-01 | Oral cavity | head & neck squamous cell carcinoma | Male | <65 | I/II | Unknown | Unknown | SD |
| Page: 1 2 |
Top |
Related drugs of malignant transformation related genes |
| Identification of chemicals and drugs interact with genes involved in malignant transfromation |
| (DGIdb 4.0) |
| Entrez ID | Symbol | Category | Interaction Types | Drug Claim Name | Drug Name | PMIDs |
| Page: 1 |

Copyright 2023-Present -The University of Texas Health Science Center at Houston |