
|
|||||
|
 | |
| |
| |
| |
| |
| |
|
Gene: HEBP1 |
Gene summary for HEBP1 |
| Gene information | Species | Human | Gene symbol | HEBP1 | Gene ID | 50865 |
| Gene name | heme binding protein 1 | |
| Gene Alias | HBP | |
| Cytomap | 12p13.1 | |
| Gene Type | protein-coding | GO ID | GO:0007623 | UniProtAcc | A0A024RAS8 |
Top |
Malignant transformation analysis |
| Identification of the aberrant gene expression in precancerous and cancerous lesions by comparing the gene expression of stem-like cells in diseased tissues with normal stem cells |
| Entrez ID | Symbol | Replicates | Species | Organ | Tissue | Adj P-value | Log2FC | Malignancy |
| 50865 | HEBP1 | HTA11_99999974143_84620 | Human | Colorectum | MSS | 6.85e-03 | 2.10e-01 | 0.3005 |
| 50865 | HEBP1 | LZE2T | Human | Esophagus | ESCC | 2.74e-03 | 4.52e-01 | 0.082 |
| 50865 | HEBP1 | LZE3D | Human | Esophagus | HGIN | 4.09e-02 | 4.78e-01 | 0.0668 |
| 50865 | HEBP1 | LZE4T | Human | Esophagus | ESCC | 1.82e-12 | 3.31e-01 | 0.0811 |
| 50865 | HEBP1 | LZE7T | Human | Esophagus | ESCC | 9.75e-05 | 8.38e-02 | 0.0667 |
| 50865 | HEBP1 | LZE8T | Human | Esophagus | ESCC | 8.98e-03 | -6.71e-02 | 0.067 |
| 50865 | HEBP1 | LZE20T | Human | Esophagus | ESCC | 1.58e-06 | 3.17e-01 | 0.0662 |
| 50865 | HEBP1 | LZE22D1 | Human | Esophagus | HGIN | 1.53e-03 | 1.43e-01 | 0.0595 |
| 50865 | HEBP1 | LZE22T | Human | Esophagus | ESCC | 5.14e-10 | 5.57e-01 | 0.068 |
| 50865 | HEBP1 | LZE24T | Human | Esophagus | ESCC | 2.18e-13 | 6.46e-01 | 0.0596 |
| 50865 | HEBP1 | LZE21T | Human | Esophagus | ESCC | 2.93e-03 | 2.08e-01 | 0.0655 |
| 50865 | HEBP1 | P1T-E | Human | Esophagus | ESCC | 1.23e-07 | 4.28e-01 | 0.0875 |
| 50865 | HEBP1 | P2T-E | Human | Esophagus | ESCC | 3.42e-53 | 1.10e+00 | 0.1177 |
| 50865 | HEBP1 | P4T-E | Human | Esophagus | ESCC | 2.70e-35 | 9.22e-01 | 0.1323 |
| 50865 | HEBP1 | P5T-E | Human | Esophagus | ESCC | 1.99e-19 | 4.61e-01 | 0.1327 |
| 50865 | HEBP1 | P8T-E | Human | Esophagus | ESCC | 2.81e-25 | 6.23e-01 | 0.0889 |
| 50865 | HEBP1 | P9T-E | Human | Esophagus | ESCC | 9.58e-17 | 5.11e-01 | 0.1131 |
| 50865 | HEBP1 | P10T-E | Human | Esophagus | ESCC | 1.25e-20 | 5.62e-01 | 0.116 |
| 50865 | HEBP1 | P11T-E | Human | Esophagus | ESCC | 1.87e-09 | 7.12e-01 | 0.1426 |
| 50865 | HEBP1 | P12T-E | Human | Esophagus | ESCC | 9.13e-75 | 1.53e+00 | 0.1122 |
| Page: 1 2 3 4 5 6 7 8 |
| Tissue | Expression Dynamics | Abbreviation |
| Breast | 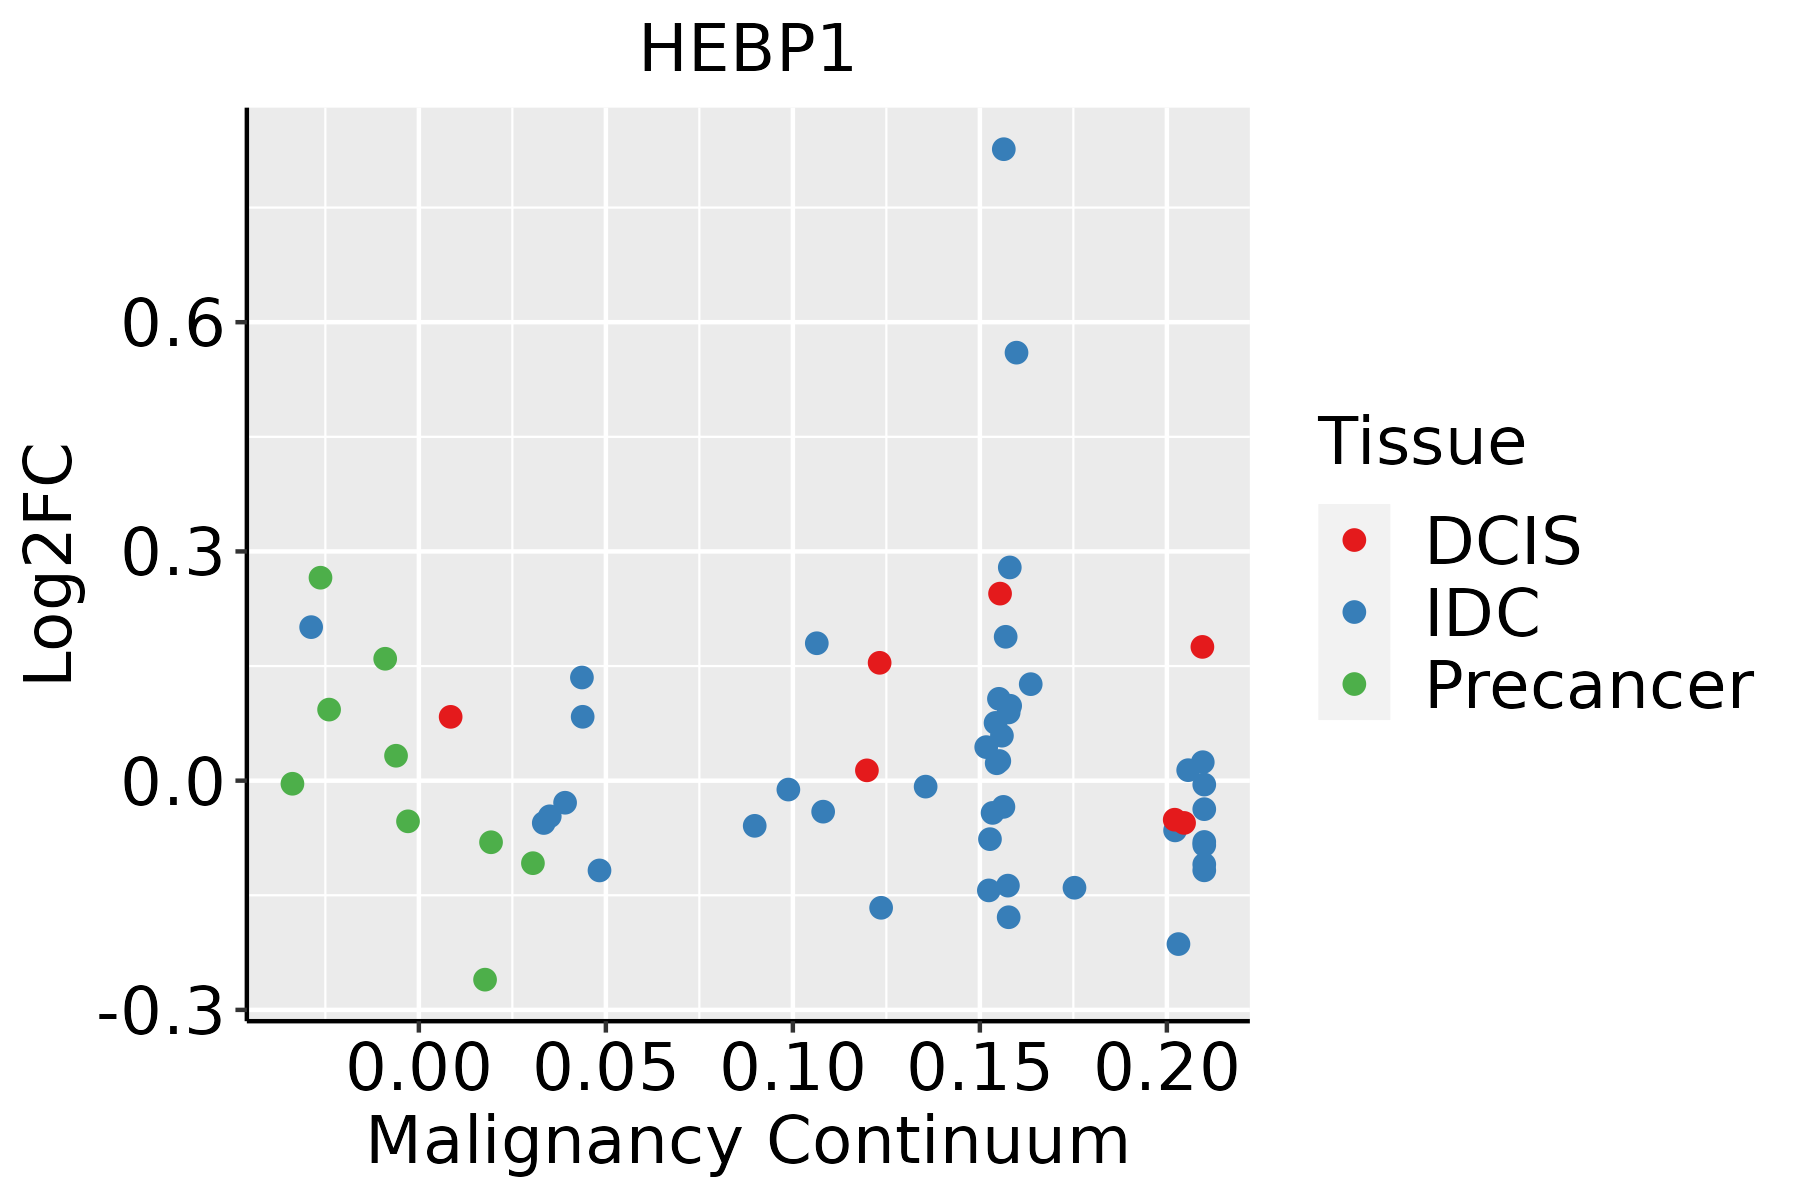 | IDC: Invasive ductal carcinoma |
| DCIS: Ductal carcinoma in situ | ||
| Precancer(BRCA1-mut): Precancerous lesion from BRCA1 mutation carriers | ||
| Colorectum (GSE201348) |  | FAP: Familial adenomatous polyposis |
| CRC: Colorectal cancer | ||
| Colorectum (HTA11) |  | AD: Adenomas |
| SER: Sessile serrated lesions | ||
| MSI-H: Microsatellite-high colorectal cancer | ||
| MSS: Microsatellite stable colorectal cancer | ||
| Esophagus | 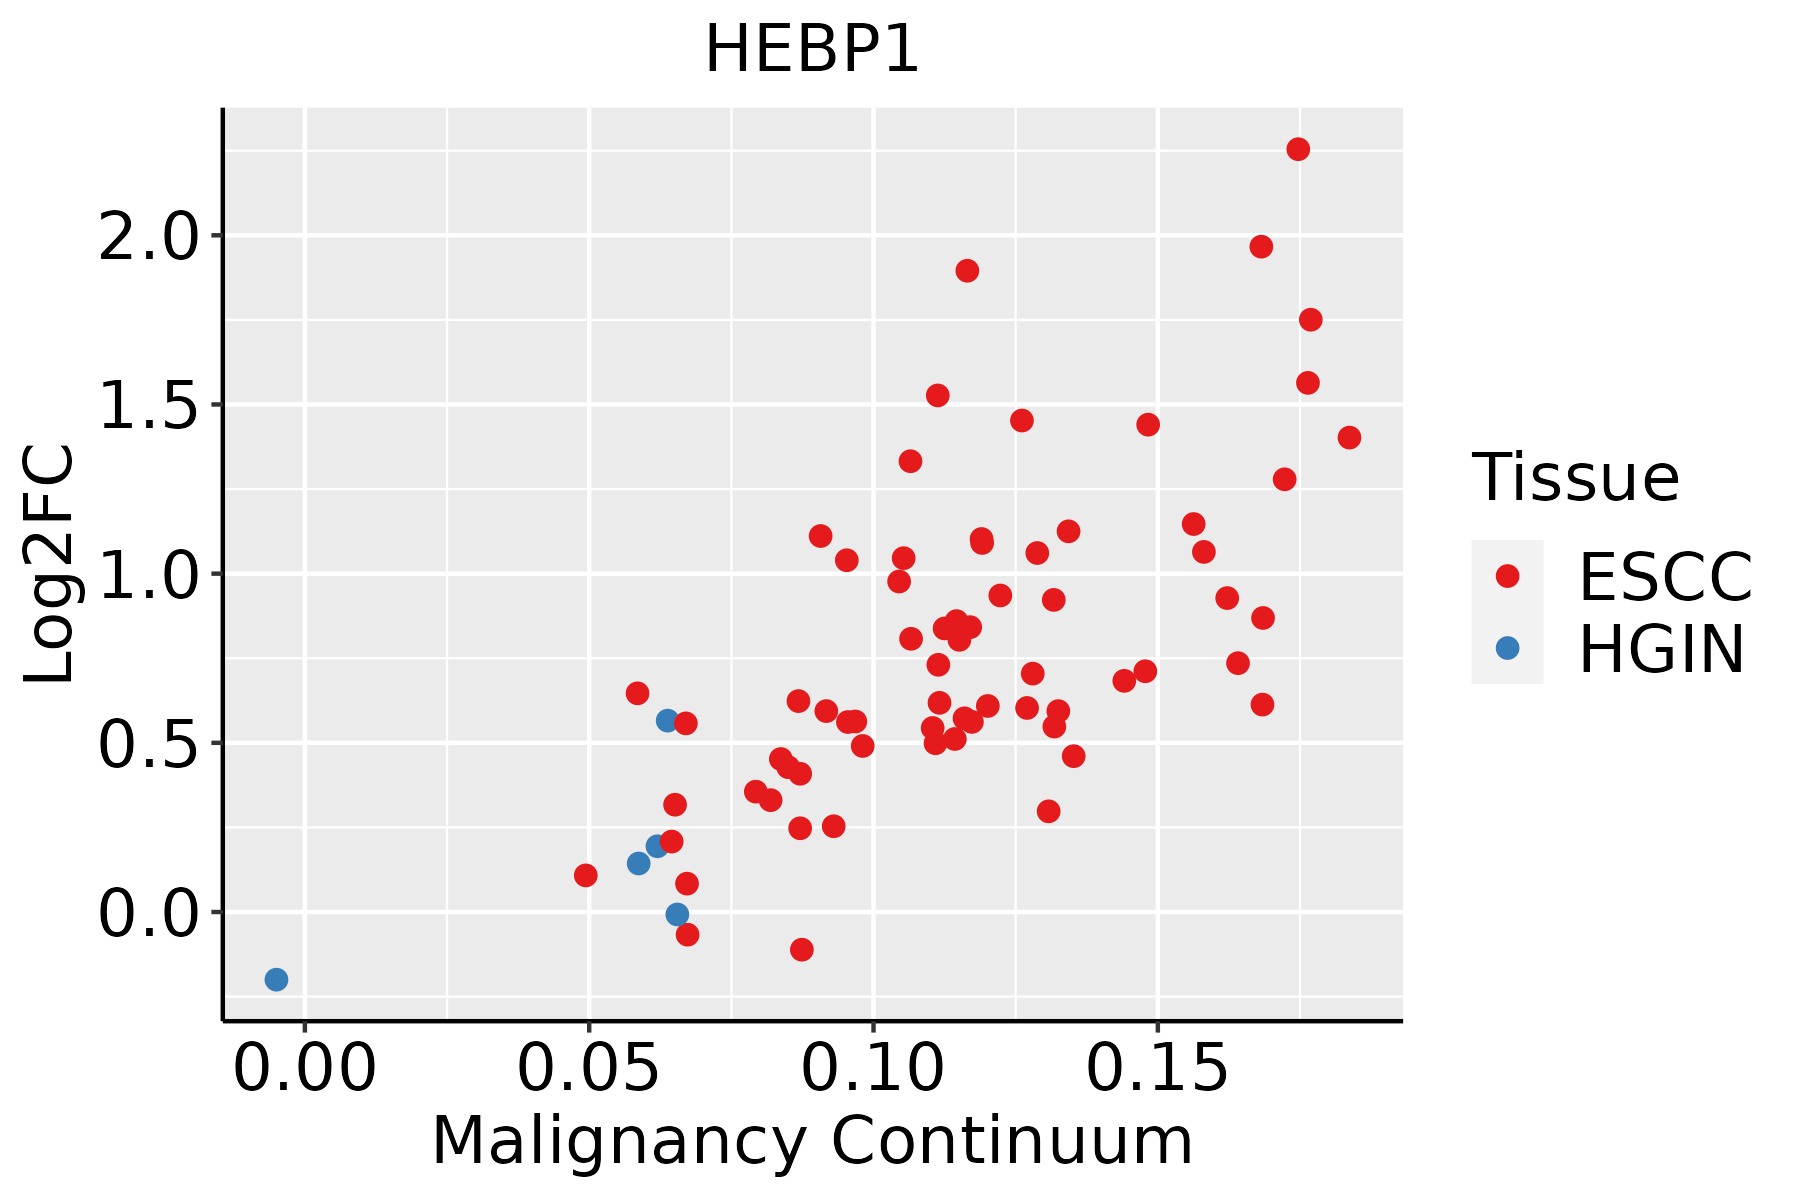 | ESCC: Esophageal squamous cell carcinoma |
| HGIN: High-grade intraepithelial neoplasias | ||
| LGIN: Low-grade intraepithelial neoplasias | ||
| Liver | 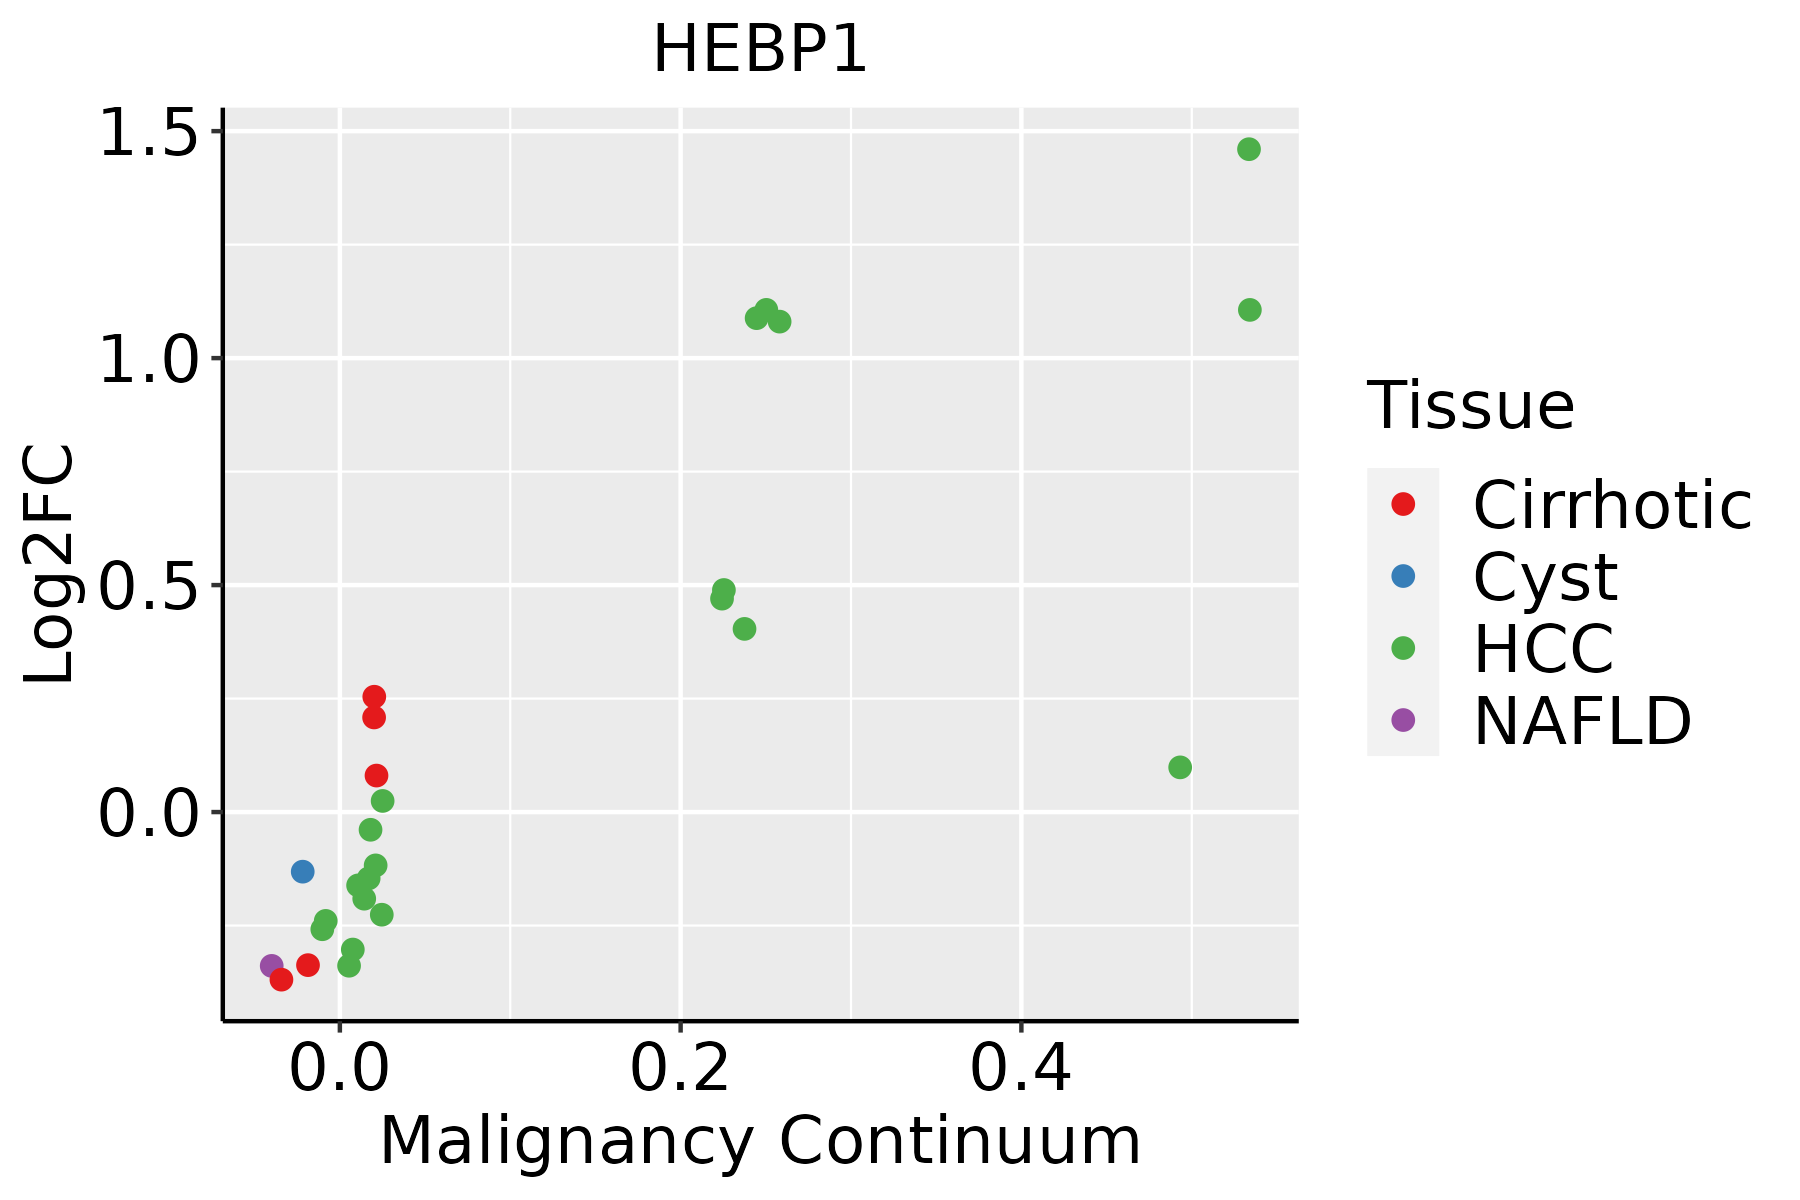 | HCC: Hepatocellular carcinoma |
| NAFLD: Non-alcoholic fatty liver disease | ||
| Oral Cavity | 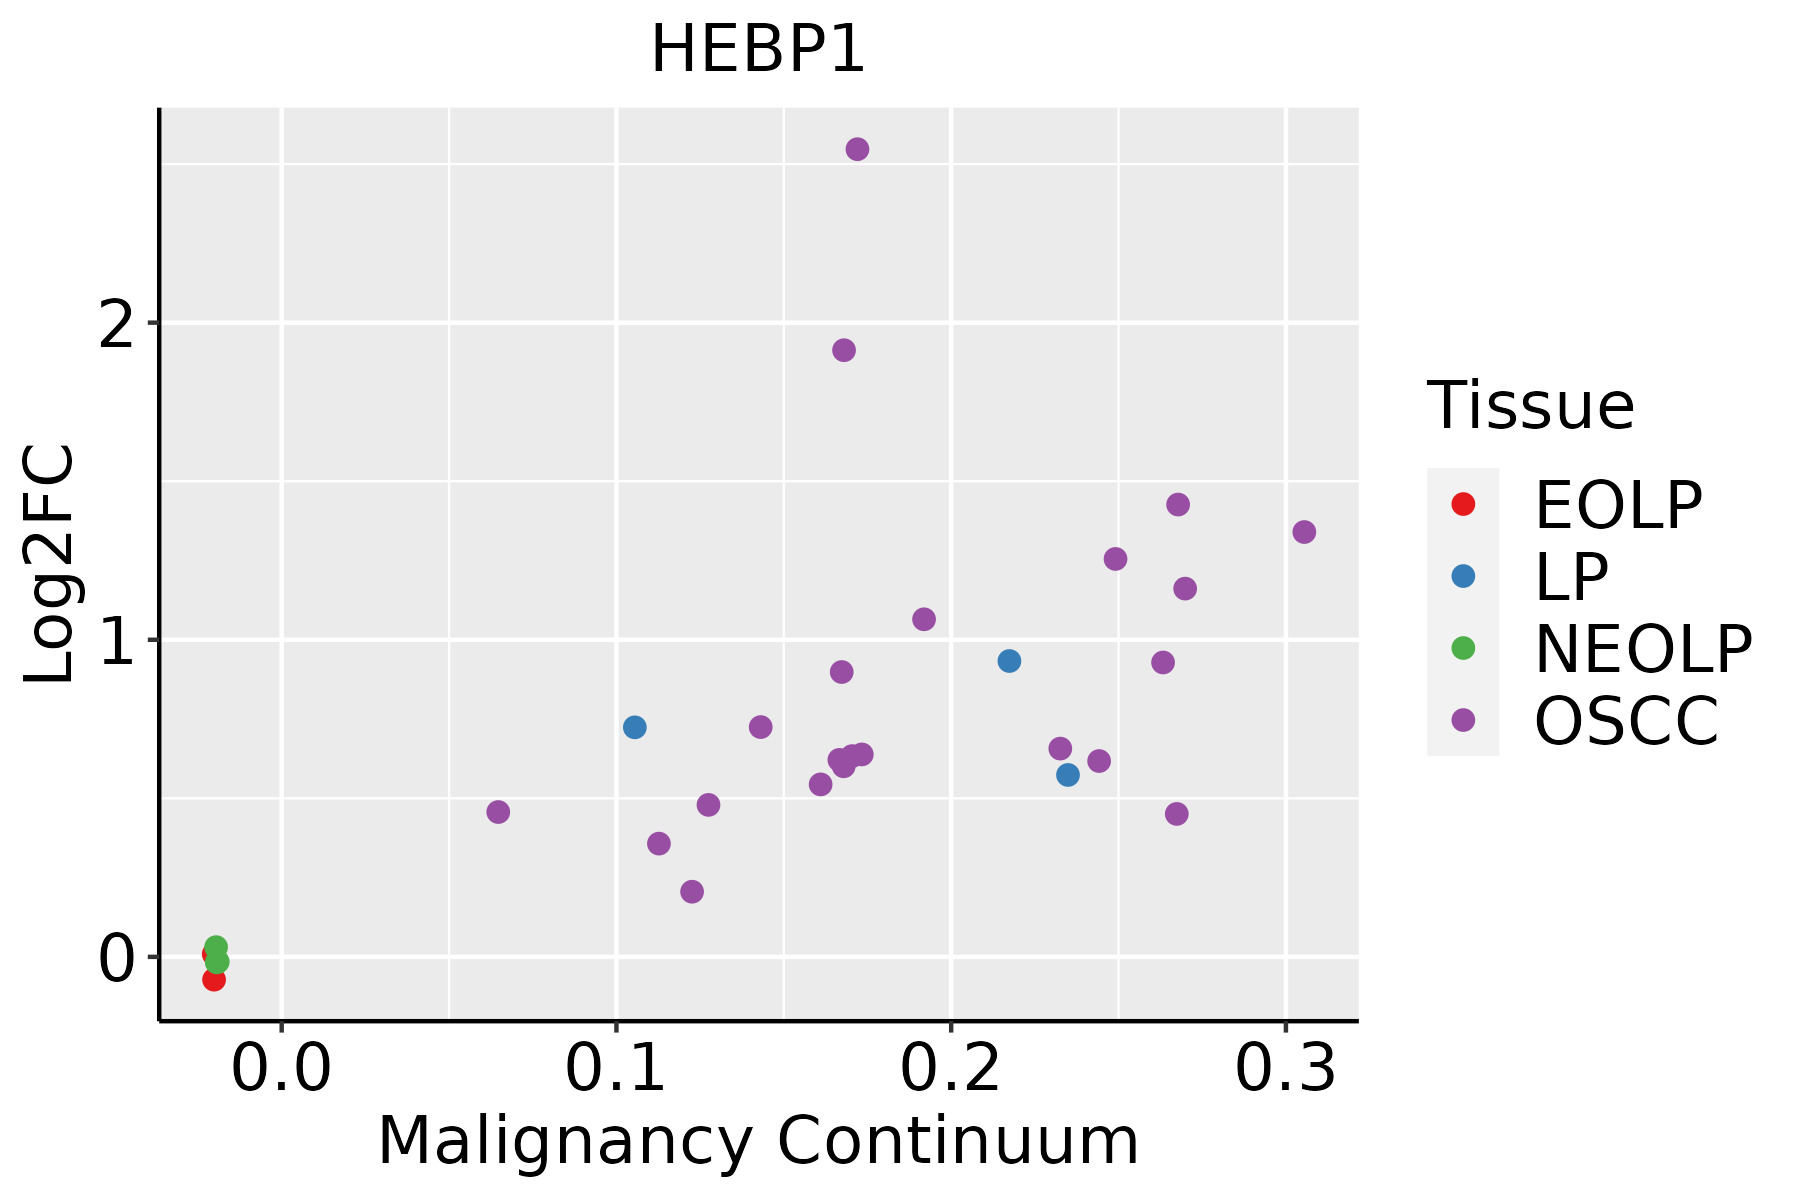 | EOLP: Erosive Oral lichen planus |
| LP: leukoplakia | ||
| NEOLP: Non-erosive oral lichen planus | ||
| OSCC: Oral squamous cell carcinoma | ||
| Skin | 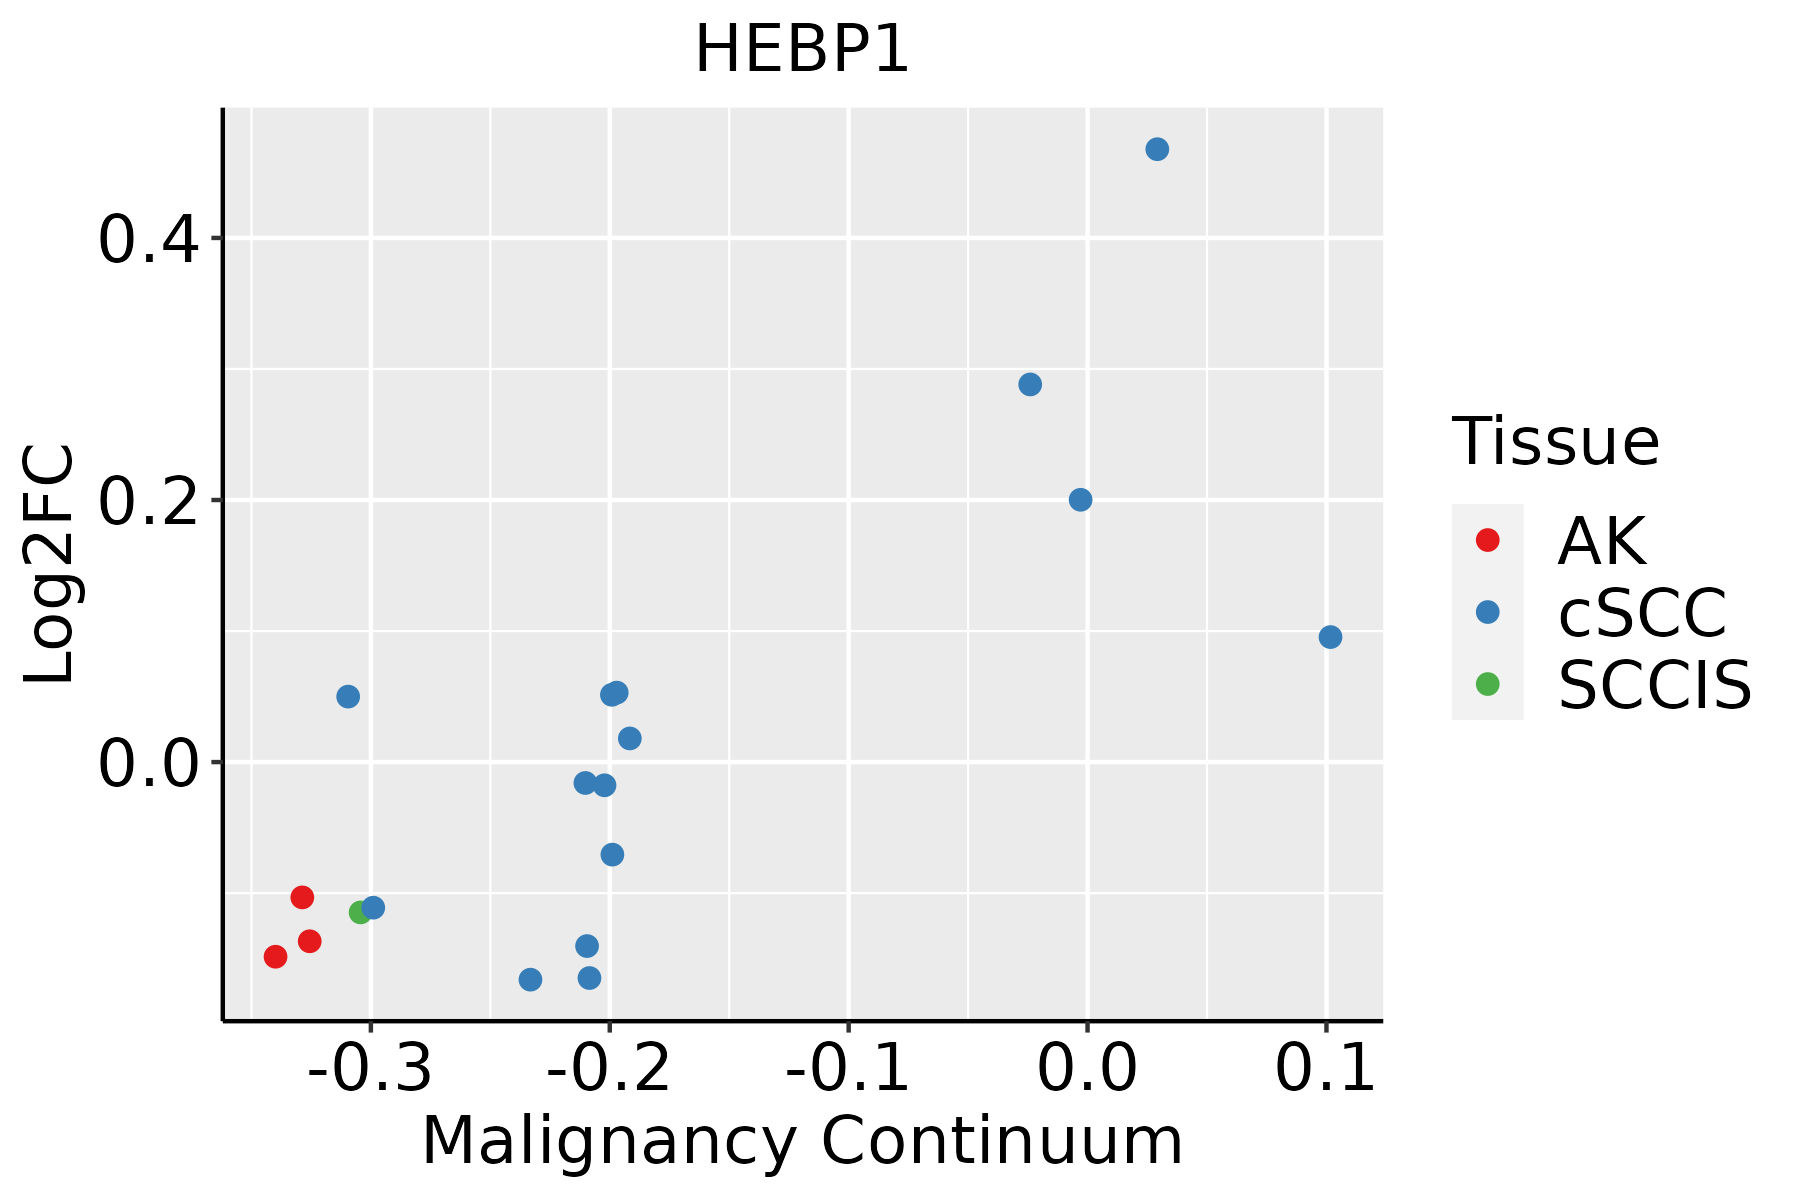 | AK: Actinic keratosis |
| cSCC: Cutaneous squamous cell carcinoma | ||
| SCCIS:squamous cell carcinoma in situ | ||
| Thyroid | 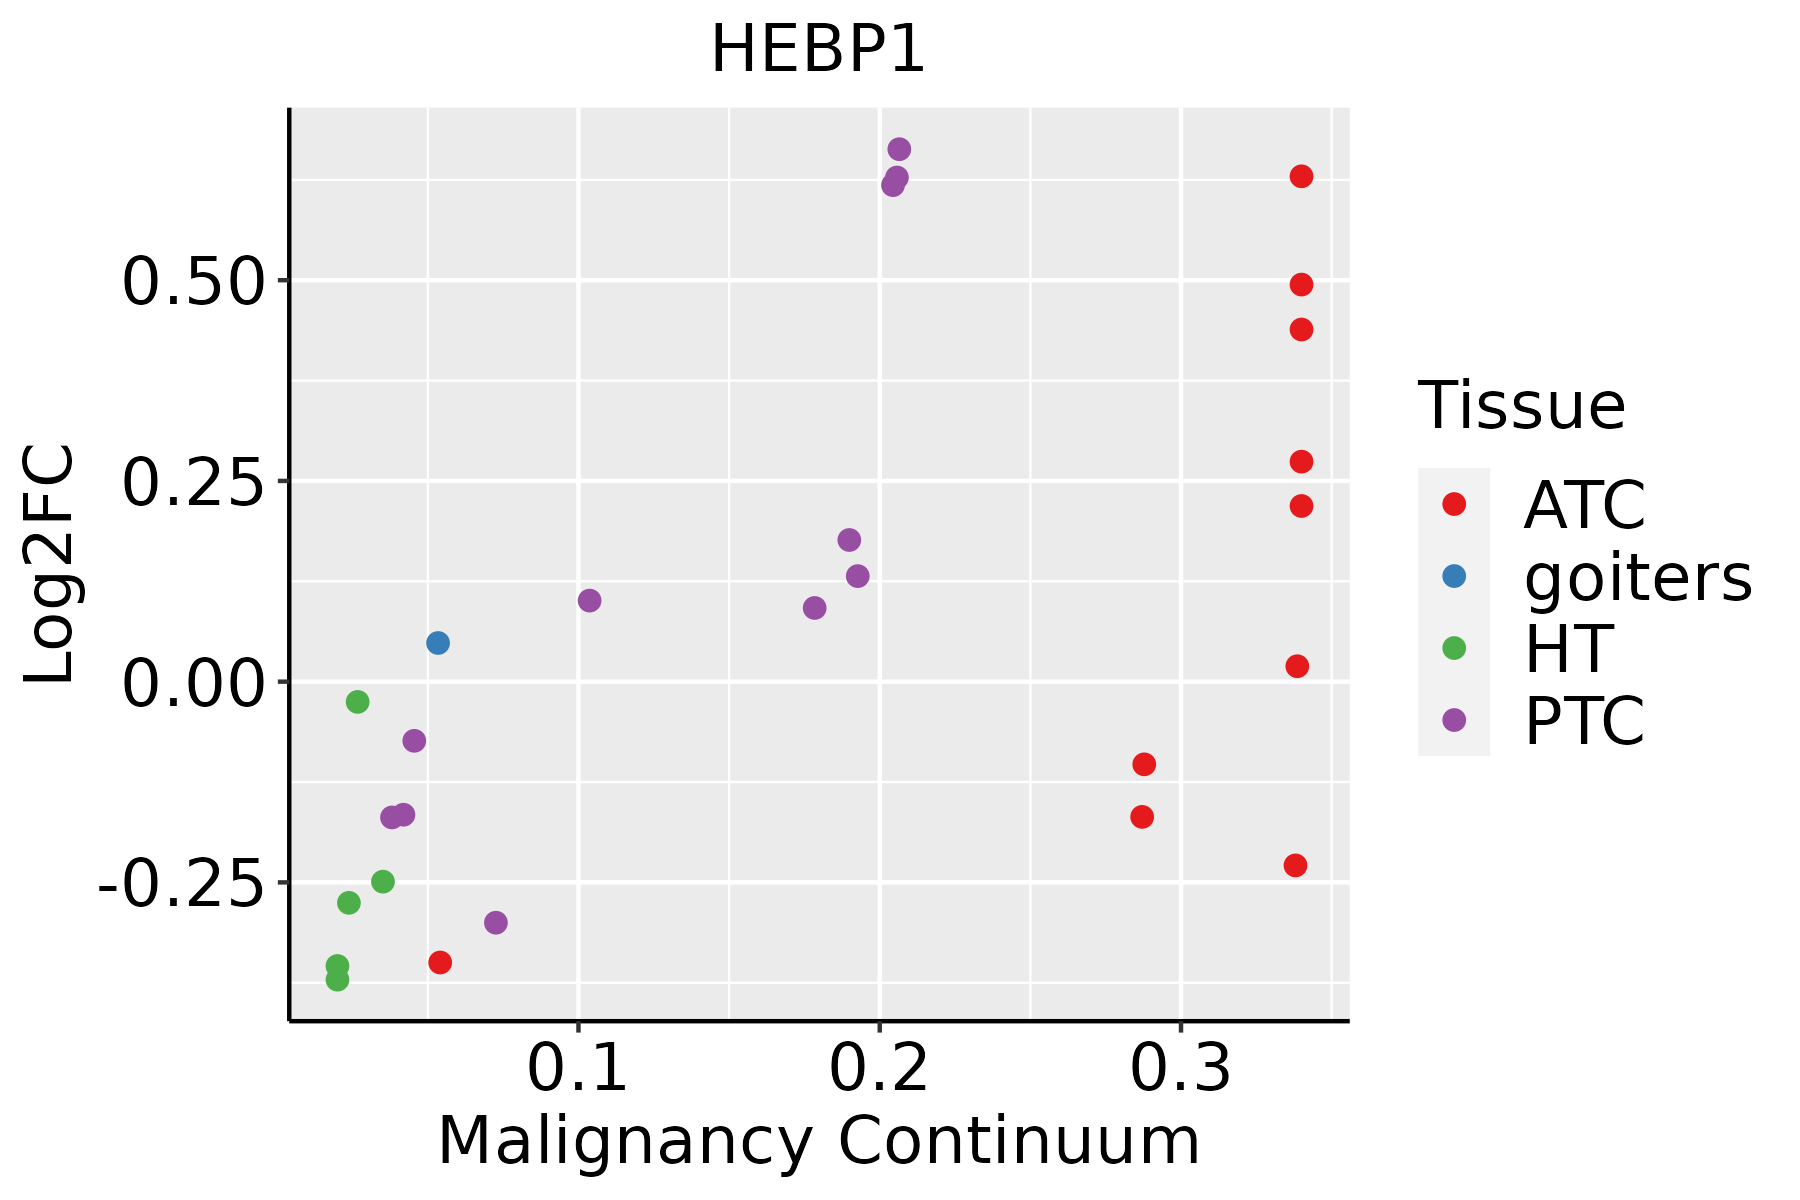 | ATC: Anaplastic thyroid cancer |
| HT: Hashimoto's thyroiditis | ||
| PTC: Papillary thyroid cancer |
| ∗log2FC in expression of this searched gene in stem-like cells from each diseased tissue sample relative to stem-like cells in normal samples in each tissue plotted against the malignancy continuum. Samples are colored based on if they are from different disease stage. |
Top |
Malignant transformation related pathway analysis |
| Find out the enriched GO biological processes and KEGG pathways involved in transition from healthy to precancer to cancer |
| Tissue | Disease Stage | Enriched GO biological Processes |
| Colorectum | AD |  |
| Colorectum | SER |  |
| Colorectum | MSS |  |
| Colorectum | MSI-H |  |
| Colorectum | FAP |  |
| ∗Top 15 enriched GO BP terms are showed in the bar plot of each disease state in each tissue. Each row represents a significant GO biological process which is colored according to the -log10(p.adjust). |
| Page: 1 2 3 4 5 6 7 8 9 |
| GO ID | Tissue | Disease Stage | Description | Gene Ratio | Bg Ratio | pvalue | p.adjust | Count |
| GO:00485117 | Breast | IDC | rhythmic process | 38/1434 | 298/18723 | 1.34e-03 | 1.39e-02 | 38 |
| GO:004851113 | Breast | DCIS | rhythmic process | 37/1390 | 298/18723 | 1.44e-03 | 1.47e-02 | 37 |
| GO:0007623 | Colorectum | AD | circadian rhythm | 72/3918 | 210/18723 | 4.50e-06 | 1.21e-04 | 72 |
| GO:0048511 | Colorectum | AD | rhythmic process | 94/3918 | 298/18723 | 1.00e-05 | 2.34e-04 | 94 |
| GO:00076232 | Colorectum | MSS | circadian rhythm | 69/3467 | 210/18723 | 4.22e-07 | 1.67e-05 | 69 |
| GO:00485112 | Colorectum | MSS | rhythmic process | 89/3467 | 298/18723 | 1.17e-06 | 3.96e-05 | 89 |
| GO:000762318 | Esophagus | HGIN | circadian rhythm | 45/2587 | 210/18723 | 1.60e-03 | 1.79e-02 | 45 |
| GO:004851118 | Esophagus | ESCC | rhythmic process | 164/8552 | 298/18723 | 6.80e-04 | 3.57e-03 | 164 |
| GO:000762319 | Esophagus | ESCC | circadian rhythm | 119/8552 | 210/18723 | 8.47e-04 | 4.36e-03 | 119 |
| GO:000762312 | Liver | Cirrhotic | circadian rhythm | 84/4634 | 210/18723 | 7.04e-07 | 1.50e-05 | 84 |
| GO:004851111 | Liver | Cirrhotic | rhythmic process | 103/4634 | 298/18723 | 8.47e-05 | 9.19e-04 | 103 |
| GO:000762321 | Liver | HCC | circadian rhythm | 117/7958 | 210/18723 | 7.29e-05 | 6.54e-04 | 117 |
| GO:004851121 | Liver | HCC | rhythmic process | 156/7958 | 298/18723 | 3.54e-04 | 2.46e-03 | 156 |
| GO:004851116 | Oral cavity | OSCC | rhythmic process | 157/7305 | 298/18723 | 1.00e-06 | 1.36e-05 | 157 |
| GO:000762316 | Oral cavity | OSCC | circadian rhythm | 110/7305 | 210/18723 | 5.40e-05 | 4.48e-04 | 110 |
| GO:000762323 | Skin | cSCC | circadian rhythm | 89/4864 | 210/18723 | 1.55e-07 | 3.51e-06 | 89 |
| GO:004851123 | Skin | cSCC | rhythmic process | 110/4864 | 298/18723 | 1.83e-05 | 2.19e-04 | 110 |
| GO:000762324 | Thyroid | HT | circadian rhythm | 33/1272 | 210/18723 | 5.38e-06 | 1.66e-04 | 33 |
| GO:004851120 | Thyroid | HT | rhythmic process | 41/1272 | 298/18723 | 1.26e-05 | 3.27e-04 | 41 |
| GO:0048511111 | Thyroid | PTC | rhythmic process | 131/5968 | 298/18723 | 7.06e-06 | 8.33e-05 | 131 |
| Page: 1 2 |
| Pathway ID | Tissue | Disease Stage | Description | Gene Ratio | Bg Ratio | pvalue | p.adjust | qvalue | Count |
| Page: 1 |
Top |
Cell-cell communication analysis |
| Identification of potential cell-cell interactions between two cell types and their ligand-receptor pairs for different disease states |
| Ligand | Receptor | LRpair | Pathway | Tissue | Disease Stage |
| Page: 1 |
Top |
Single-cell gene regulatory network inference analysis |
| Find out the significant the regulons (TFs) and the target genes of each regulon across cell types for different disease states |
| TF | Cell Type | Tissue | Disease Stage | Target Gene | RSS | Regulon Activity |
| ∗The dot plots of a searched regulon are shown for all cell subpopulations in each disease state of each tissue based on the regulon specific score inferred using pySCENIC and by calculating the average expression. |
| Page: 1 |
Top |
Somatic mutation of malignant transformation related genes |
| Annotation of somatic variants for genes involved in malignant transformation |
| Hugo Symbol | Variant Class | Variant Classification | dbSNP RS | HGVSc | HGVSp | HGVSp Short | SWISSPROT | BIOTYPE | SIFT | PolyPhen | Tumor Sample Barcode | Tissue | Histology | Sex | Age | Stage | Therapy Types | Drugs | Outcome |
| HEBP1 | insertion | Frame_Shift_Ins | novel | c.314_315insCCTTCTGTCTGTTCATTCTTATTTCATAAGGAATGAGA | p.Asn106LeufsTer53 | p.N106Lfs*53 | Q9NRV9 | protein_coding | TCGA-AN-A04C-01 | Breast | breast invasive carcinoma | Female | <65 | I/II | Unknown | Unknown | SD | ||
| HEBP1 | insertion | Frame_Shift_Ins | novel | c.203_204insG | p.Thr69HisfsTer3 | p.T69Hfs*3 | Q9NRV9 | protein_coding | TCGA-AN-A04C-01 | Breast | breast invasive carcinoma | Female | <65 | I/II | Unknown | Unknown | SD | ||
| HEBP1 | insertion | Frame_Shift_Ins | novel | c.203_204insG | p.Thr69HisfsTer3 | p.T69Hfs*3 | Q9NRV9 | protein_coding | TCGA-AN-A0FY-01 | Breast | breast invasive carcinoma | Female | <65 | I/II | Unknown | Unknown | SD | ||
| HEBP1 | SNV | Missense_Mutation | rs759302892 | c.454N>T | p.Arg152Cys | p.R152C | Q9NRV9 | protein_coding | tolerated(0.06) | possibly_damaging(0.865) | TCGA-AA-3877-01 | Colorectum | colon adenocarcinoma | Female | >=65 | I/II | Unknown | Unknown | SD |
| HEBP1 | SNV | Missense_Mutation | rs375649105 | c.288N>T | p.Lys96Asn | p.K96N | Q9NRV9 | protein_coding | tolerated(0.11) | benign(0.295) | TCGA-AG-A002-01 | Colorectum | rectum adenocarcinoma | Male | <65 | I/II | Unknown | Unknown | SD |
| HEBP1 | SNV | Missense_Mutation | c.423A>C | p.Glu141Asp | p.E141D | Q9NRV9 | protein_coding | tolerated(0.1) | possibly_damaging(0.495) | TCGA-DC-6682-01 | Colorectum | rectum adenocarcinoma | Male | <65 | I/II | Unknown | Unknown | SD | |
| HEBP1 | SNV | Missense_Mutation | novel | c.307C>T | p.Arg103Trp | p.R103W | Q9NRV9 | protein_coding | deleterious(0.02) | benign(0.049) | TCGA-A5-A1OF-01 | Endometrium | uterine corpus endometrioid carcinoma | Female | <65 | I/II | Unknown | Unknown | SD |
| HEBP1 | SNV | Missense_Mutation | novel | c.164T>C | p.Leu55Pro | p.L55P | Q9NRV9 | protein_coding | tolerated(0.13) | possibly_damaging(0.816) | TCGA-A5-A1OF-01 | Endometrium | uterine corpus endometrioid carcinoma | Female | <65 | I/II | Unknown | Unknown | SD |
| HEBP1 | SNV | Missense_Mutation | c.5N>C | p.Leu2Ser | p.L2S | Q9NRV9 | protein_coding | deleterious(0) | possibly_damaging(0.868) | TCGA-AP-A059-01 | Endometrium | uterine corpus endometrioid carcinoma | Female | >=65 | I/II | Unknown | Unknown | SD | |
| HEBP1 | SNV | Missense_Mutation | rs76698360 | c.538N>T | p.Arg180Trp | p.R180W | Q9NRV9 | protein_coding | deleterious(0) | probably_damaging(0.988) | TCGA-B5-A3FC-01 | Endometrium | uterine corpus endometrioid carcinoma | Female | <65 | I/II | Unknown | Unknown | SD |
| Page: 1 2 3 |
Top |
Related drugs of malignant transformation related genes |
| Identification of chemicals and drugs interact with genes involved in malignant transfromation |
| (DGIdb 4.0) |
| Entrez ID | Symbol | Category | Interaction Types | Drug Claim Name | Drug Name | PMIDs |
| 50865 | HEBP1 | DRUGGABLE GENOME | Pyrazino[2,1-a]isoquinolin derivative 3 | |||
| 50865 | HEBP1 | DRUGGABLE GENOME | PMID28454500-Compound-34 | |||
| 50865 | HEBP1 | DRUGGABLE GENOME | 3-phenyl propanoic derivative 3 | |||
| 50865 | HEBP1 | DRUGGABLE GENOME | PMID28454500-Compound-33 | |||
| 50865 | HEBP1 | DRUGGABLE GENOME | Trepenoid derivative 1 | |||
| 50865 | HEBP1 | DRUGGABLE GENOME | PMID28454500-Compound-13 | |||
| 50865 | HEBP1 | DRUGGABLE GENOME | Pyrazino[2,1-a]isoquinolin derivative 2 | |||
| 50865 | HEBP1 | DRUGGABLE GENOME | 4-(2-cyclohexylethoxy) aniline derivative 2 | |||
| 50865 | HEBP1 | DRUGGABLE GENOME | PMID28454500-Compound-60 | |||
| 50865 | HEBP1 | DRUGGABLE GENOME | Chalcone derivative 1 |
| Page: 1 2 3 4 5 6 7 |

Copyright 2023-Present -The University of Texas Health Science Center at Houston |