
|
|||||
|
 | |
| |
| |
| |
| |
| |
|
Gene: HDHD2 |
Gene summary for HDHD2 |
| Gene information | Species | Human | Gene symbol | HDHD2 | Gene ID | 84064 |
| Gene name | haloacid dehalogenase like hydrolase domain containing 2 | |
| Gene Alias | 3110052N05Rik | |
| Cytomap | 18q21.1 | |
| Gene Type | protein-coding | GO ID | GO:0006793 | UniProtAcc | Q9H0R4 |
Top |
Malignant transformation analysis |
| Identification of the aberrant gene expression in precancerous and cancerous lesions by comparing the gene expression of stem-like cells in diseased tissues with normal stem cells |
| Entrez ID | Symbol | Replicates | Species | Organ | Tissue | Adj P-value | Log2FC | Malignancy |
| 84064 | HDHD2 | P30T-E | Human | Esophagus | ESCC | 4.18e-09 | 3.48e-01 | 0.137 |
| 84064 | HDHD2 | P31T-E | Human | Esophagus | ESCC | 7.98e-16 | 2.22e-01 | 0.1251 |
| 84064 | HDHD2 | P32T-E | Human | Esophagus | ESCC | 7.74e-12 | 1.57e-01 | 0.1666 |
| 84064 | HDHD2 | P36T-E | Human | Esophagus | ESCC | 2.89e-04 | 2.59e-01 | 0.1187 |
| 84064 | HDHD2 | P37T-E | Human | Esophagus | ESCC | 1.22e-06 | 1.96e-01 | 0.1371 |
| 84064 | HDHD2 | P39T-E | Human | Esophagus | ESCC | 8.78e-12 | 1.74e-01 | 0.0894 |
| 84064 | HDHD2 | P42T-E | Human | Esophagus | ESCC | 1.98e-03 | 8.15e-02 | 0.1175 |
| 84064 | HDHD2 | P47T-E | Human | Esophagus | ESCC | 5.12e-09 | 6.29e-02 | 0.1067 |
| 84064 | HDHD2 | P48T-E | Human | Esophagus | ESCC | 1.44e-06 | 6.70e-02 | 0.0959 |
| 84064 | HDHD2 | P49T-E | Human | Esophagus | ESCC | 1.35e-08 | 9.78e-01 | 0.1768 |
| 84064 | HDHD2 | P52T-E | Human | Esophagus | ESCC | 2.92e-07 | 1.86e-01 | 0.1555 |
| 84064 | HDHD2 | P54T-E | Human | Esophagus | ESCC | 2.13e-07 | 2.14e-01 | 0.0975 |
| 84064 | HDHD2 | P56T-E | Human | Esophagus | ESCC | 1.99e-03 | 5.92e-01 | 0.1613 |
| 84064 | HDHD2 | P57T-E | Human | Esophagus | ESCC | 1.48e-17 | 1.85e-01 | 0.0926 |
| 84064 | HDHD2 | P61T-E | Human | Esophagus | ESCC | 2.06e-03 | 6.54e-02 | 0.099 |
| 84064 | HDHD2 | P62T-E | Human | Esophagus | ESCC | 7.14e-25 | 4.69e-01 | 0.1302 |
| 84064 | HDHD2 | P65T-E | Human | Esophagus | ESCC | 8.69e-06 | 9.58e-02 | 0.0978 |
| 84064 | HDHD2 | P74T-E | Human | Esophagus | ESCC | 1.15e-23 | 7.28e-01 | 0.1479 |
| 84064 | HDHD2 | P75T-E | Human | Esophagus | ESCC | 5.99e-13 | 1.66e-01 | 0.1125 |
| 84064 | HDHD2 | P76T-E | Human | Esophagus | ESCC | 1.97e-19 | 2.93e-01 | 0.1207 |
| Page: 1 2 3 |
| Tissue | Expression Dynamics | Abbreviation |
| Esophagus | 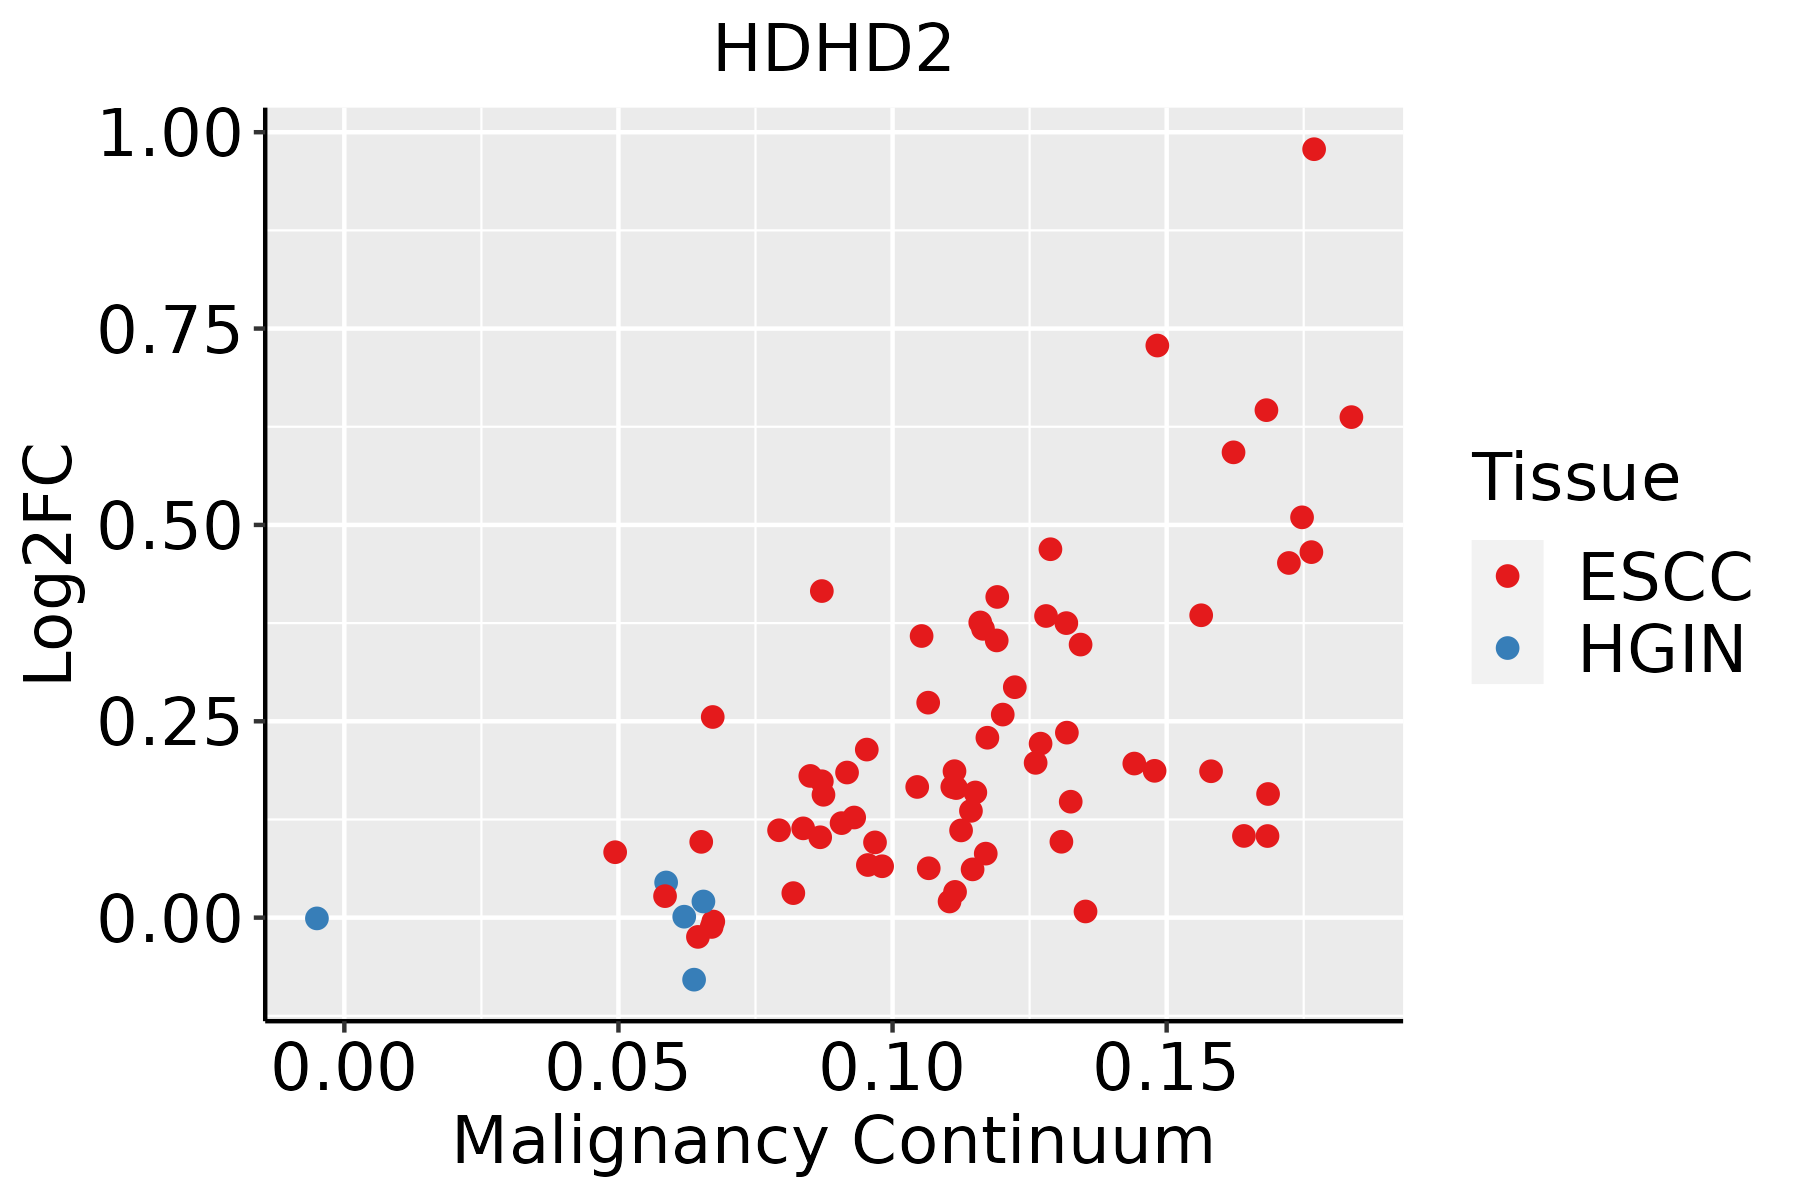 | ESCC: Esophageal squamous cell carcinoma |
| HGIN: High-grade intraepithelial neoplasias | ||
| LGIN: Low-grade intraepithelial neoplasias |
| ∗log2FC in expression of this searched gene in stem-like cells from each diseased tissue sample relative to stem-like cells in normal samples in each tissue plotted against the malignancy continuum. Samples are colored based on if they are from different disease stage. |
Top |
Malignant transformation related pathway analysis |
| Find out the enriched GO biological processes and KEGG pathways involved in transition from healthy to precancer to cancer |
| Tissue | Disease Stage | Enriched GO biological Processes |
| Colorectum | AD |  |
| Colorectum | SER |  |
| Colorectum | MSS |  |
| Colorectum | MSI-H |  |
| Colorectum | FAP |  |
| ∗Top 15 enriched GO BP terms are showed in the bar plot of each disease state in each tissue. Each row represents a significant GO biological process which is colored according to the -log10(p.adjust). |
| Page: 1 2 3 4 5 6 7 8 9 |
| GO ID | Tissue | Disease Stage | Description | Gene Ratio | Bg Ratio | pvalue | p.adjust | Count |
| GO:001631110 | Esophagus | ESCC | dephosphorylation | 251/8552 | 417/18723 | 1.26e-09 | 2.99e-08 | 251 |
| Page: 1 |
| Pathway ID | Tissue | Disease Stage | Description | Gene Ratio | Bg Ratio | pvalue | p.adjust | qvalue | Count |
| Page: 1 |
Top |
Cell-cell communication analysis |
| Identification of potential cell-cell interactions between two cell types and their ligand-receptor pairs for different disease states |
| Ligand | Receptor | LRpair | Pathway | Tissue | Disease Stage |
| Page: 1 |
Top |
Single-cell gene regulatory network inference analysis |
| Find out the significant the regulons (TFs) and the target genes of each regulon across cell types for different disease states |
| TF | Cell Type | Tissue | Disease Stage | Target Gene | RSS | Regulon Activity |
| ∗The dot plots of a searched regulon are shown for all cell subpopulations in each disease state of each tissue based on the regulon specific score inferred using pySCENIC and by calculating the average expression. |
| Page: 1 |
Top |
Somatic mutation of malignant transformation related genes |
| Annotation of somatic variants for genes involved in malignant transformation |
| Hugo Symbol | Variant Class | Variant Classification | dbSNP RS | HGVSc | HGVSp | HGVSp Short | SWISSPROT | BIOTYPE | SIFT | PolyPhen | Tumor Sample Barcode | Tissue | Histology | Sex | Age | Stage | Therapy Types | Drugs | Outcome |
| HDHD2 | SNV | Missense_Mutation | c.205N>C | p.Glu69Gln | p.E69Q | Q9H0R4 | protein_coding | tolerated(0.4) | benign(0.055) | TCGA-AC-A23C-01 | Breast | breast invasive carcinoma | Female | <65 | I/II | Chemotherapy | chemo | CR | |
| HDHD2 | SNV | Missense_Mutation | novel | c.217N>C | p.Phe73Leu | p.F73L | Q9H0R4 | protein_coding | tolerated(0.05) | benign(0.291) | TCGA-AN-A046-01 | Breast | breast invasive carcinoma | Female | >=65 | I/II | Unknown | Unknown | SD |
| HDHD2 | SNV | Missense_Mutation | novel | c.649N>A | p.Gly217Ser | p.G217S | Q9H0R4 | protein_coding | deleterious(0) | probably_damaging(0.998) | TCGA-2W-A8YY-01 | Cervix | cervical & endocervical cancer | Female | <65 | I/II | Chemotherapy | cisplatin | CR |
| HDHD2 | SNV | Missense_Mutation | rs374468528 | c.14N>A | p.Arg5His | p.R5H | Q9H0R4 | protein_coding | tolerated(0.1) | benign(0.033) | TCGA-AZ-4315-01 | Colorectum | colon adenocarcinoma | Male | <65 | I/II | Unknown | Unknown | SD |
| HDHD2 | insertion | Frame_Shift_Ins | novel | c.534_535insG | p.Lys179GlufsTer17 | p.K179Efs*17 | Q9H0R4 | protein_coding | TCGA-CM-6674-01 | Colorectum | colon adenocarcinoma | Male | <65 | I/II | Unknown | Unknown | SD | ||
| HDHD2 | SNV | Missense_Mutation | novel | c.185A>C | p.Lys62Thr | p.K62T | Q9H0R4 | protein_coding | tolerated(0.09) | benign(0.024) | TCGA-AJ-A3EL-01 | Endometrium | uterine corpus endometrioid carcinoma | Female | <65 | I/II | Unknown | Unknown | SD |
| HDHD2 | SNV | Missense_Mutation | novel | c.257N>C | p.Lys86Thr | p.K86T | Q9H0R4 | protein_coding | tolerated(0.14) | benign(0.024) | TCGA-B5-A11E-01 | Endometrium | uterine corpus endometrioid carcinoma | Female | <65 | I/II | Unknown | Unknown | SD |
| HDHD2 | SNV | Missense_Mutation | novel | c.546G>T | p.Lys182Asn | p.K182N | Q9H0R4 | protein_coding | tolerated(0.09) | benign(0.177) | TCGA-B5-A1MR-01 | Endometrium | uterine corpus endometrioid carcinoma | Female | >=65 | III/IV | Unknown | Unknown | SD |
| HDHD2 | SNV | Missense_Mutation | novel | c.421N>T | p.Ile141Leu | p.I141L | Q9H0R4 | protein_coding | deleterious(0.05) | benign(0.364) | TCGA-BG-A222-01 | Endometrium | uterine corpus endometrioid carcinoma | Female | <65 | I/II | Unknown | Unknown | SD |
| HDHD2 | SNV | Missense_Mutation | rs772089622 | c.568N>T | p.Arg190Trp | p.R190W | Q9H0R4 | protein_coding | deleterious(0.01) | probably_damaging(0.949) | TCGA-D1-A167-01 | Endometrium | uterine corpus endometrioid carcinoma | Female | >=65 | I/II | Unknown | Unknown | SD |
| Page: 1 2 |
Top |
Related drugs of malignant transformation related genes |
| Identification of chemicals and drugs interact with genes involved in malignant transfromation |
| (DGIdb 4.0) |
| Entrez ID | Symbol | Category | Interaction Types | Drug Claim Name | Drug Name | PMIDs |
| Page: 1 |

Copyright 2023-Present -The University of Texas Health Science Center at Houston |