
|
|||||
|
 | |
| |
| |
| |
| |
| |
|
Gene: HAS3 |
Gene summary for HAS3 |
| Gene information | Species | Human | Gene symbol | HAS3 | Gene ID | 3038 |
| Gene name | hyaluronan synthase 3 | |
| Gene Alias | HAS3 | |
| Cytomap | 16q22.1 | |
| Gene Type | protein-coding | GO ID | GO:0000271 | UniProtAcc | O00219 |
Top |
Malignant transformation analysis |
| Identification of the aberrant gene expression in precancerous and cancerous lesions by comparing the gene expression of stem-like cells in diseased tissues with normal stem cells |
| Entrez ID | Symbol | Replicates | Species | Organ | Tissue | Adj P-value | Log2FC | Malignancy |
| 3038 | HAS3 | P38T-E | Human | Esophagus | ESCC | 8.14e-07 | -3.53e-01 | 0.127 |
| 3038 | HAS3 | P39T-E | Human | Esophagus | ESCC | 1.32e-04 | -4.82e-01 | 0.0894 |
| 3038 | HAS3 | P48T-E | Human | Esophagus | ESCC | 1.73e-03 | 4.46e-01 | 0.0959 |
| 3038 | HAS3 | P57T-E | Human | Esophagus | ESCC | 4.39e-06 | -5.30e-01 | 0.0926 |
| 3038 | HAS3 | P61T-E | Human | Esophagus | ESCC | 2.95e-11 | -4.71e-01 | 0.099 |
| 3038 | HAS3 | P62T-E | Human | Esophagus | ESCC | 1.32e-15 | 1.20e+00 | 0.1302 |
| 3038 | HAS3 | P65T-E | Human | Esophagus | ESCC | 3.26e-18 | -4.87e-01 | 0.0978 |
| 3038 | HAS3 | P74T-E | Human | Esophagus | ESCC | 1.20e-07 | -6.60e-01 | 0.1479 |
| 3038 | HAS3 | P76T-E | Human | Esophagus | ESCC | 5.31e-08 | -4.71e-01 | 0.1207 |
| 3038 | HAS3 | P79T-E | Human | Esophagus | ESCC | 1.21e-06 | -3.23e-01 | 0.1154 |
| 3038 | HAS3 | P83T-E | Human | Esophagus | ESCC | 6.63e-05 | 6.66e-01 | 0.1738 |
| 3038 | HAS3 | P104T-E | Human | Esophagus | ESCC | 3.00e-04 | -4.84e-01 | 0.0931 |
| 3038 | HAS3 | P128T-E | Human | Esophagus | ESCC | 3.85e-02 | -4.78e-01 | 0.1241 |
| 3038 | HAS3 | P130T-E | Human | Esophagus | ESCC | 6.41e-03 | 1.52e-01 | 0.1676 |
| 3038 | HAS3 | C04 | Human | Oral cavity | OSCC | 5.81e-29 | 1.41e+00 | 0.2633 |
| 3038 | HAS3 | C21 | Human | Oral cavity | OSCC | 3.23e-20 | 8.46e-01 | 0.2678 |
| 3038 | HAS3 | C30 | Human | Oral cavity | OSCC | 1.73e-40 | 1.83e+00 | 0.3055 |
| 3038 | HAS3 | C38 | Human | Oral cavity | OSCC | 4.76e-08 | 1.17e+00 | 0.172 |
| 3038 | HAS3 | C43 | Human | Oral cavity | OSCC | 8.35e-04 | 1.14e-01 | 0.1704 |
| 3038 | HAS3 | C51 | Human | Oral cavity | OSCC | 4.62e-36 | 1.99e+00 | 0.2674 |
| Page: 1 2 3 4 |
| Tissue | Expression Dynamics | Abbreviation |
| Cervix |  | CC: Cervix cancer |
| HSIL_HPV: HPV-infected high-grade squamous intraepithelial lesions | ||
| N_HPV: HPV-infected normal cervix | ||
| Esophagus |  | ESCC: Esophageal squamous cell carcinoma |
| HGIN: High-grade intraepithelial neoplasias | ||
| LGIN: Low-grade intraepithelial neoplasias | ||
| Oral Cavity | 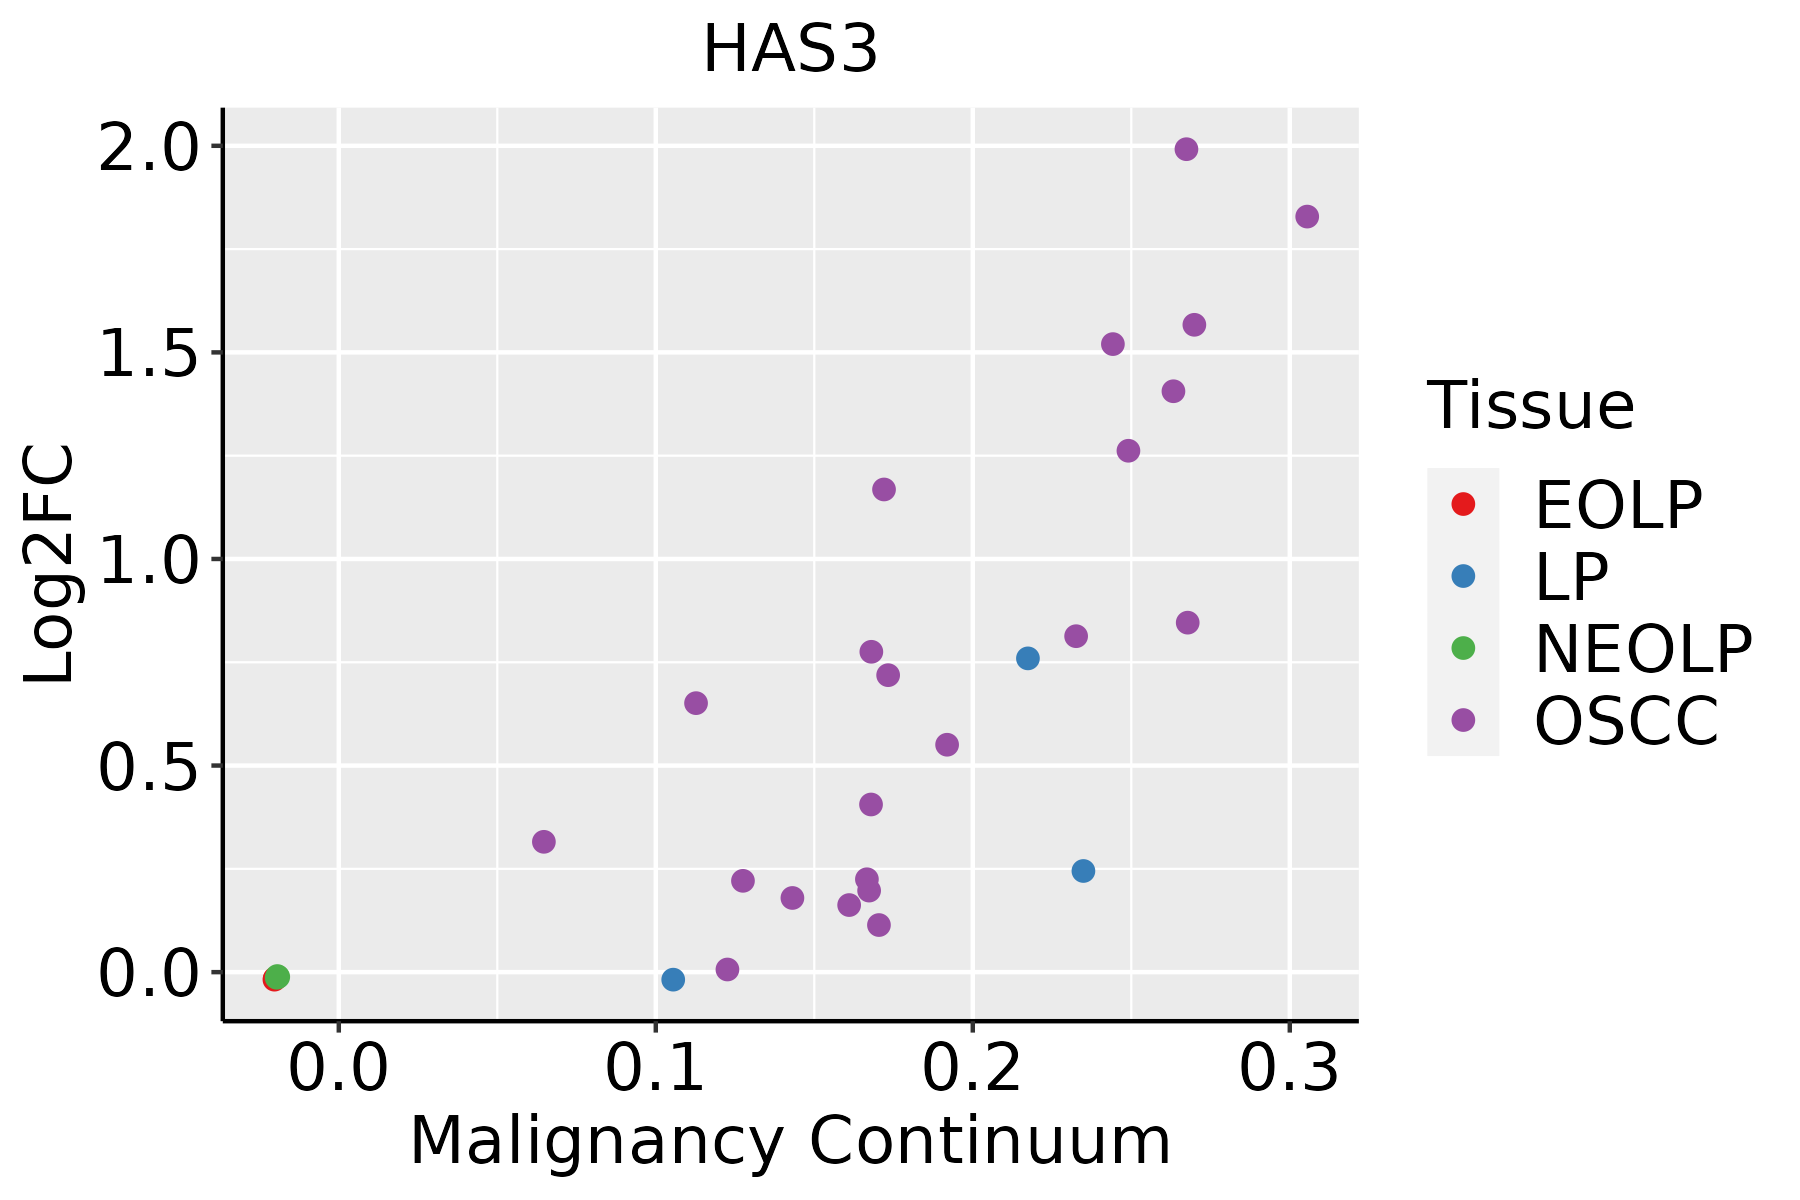 | EOLP: Erosive Oral lichen planus |
| LP: leukoplakia | ||
| NEOLP: Non-erosive oral lichen planus | ||
| OSCC: Oral squamous cell carcinoma | ||
| Prostate | 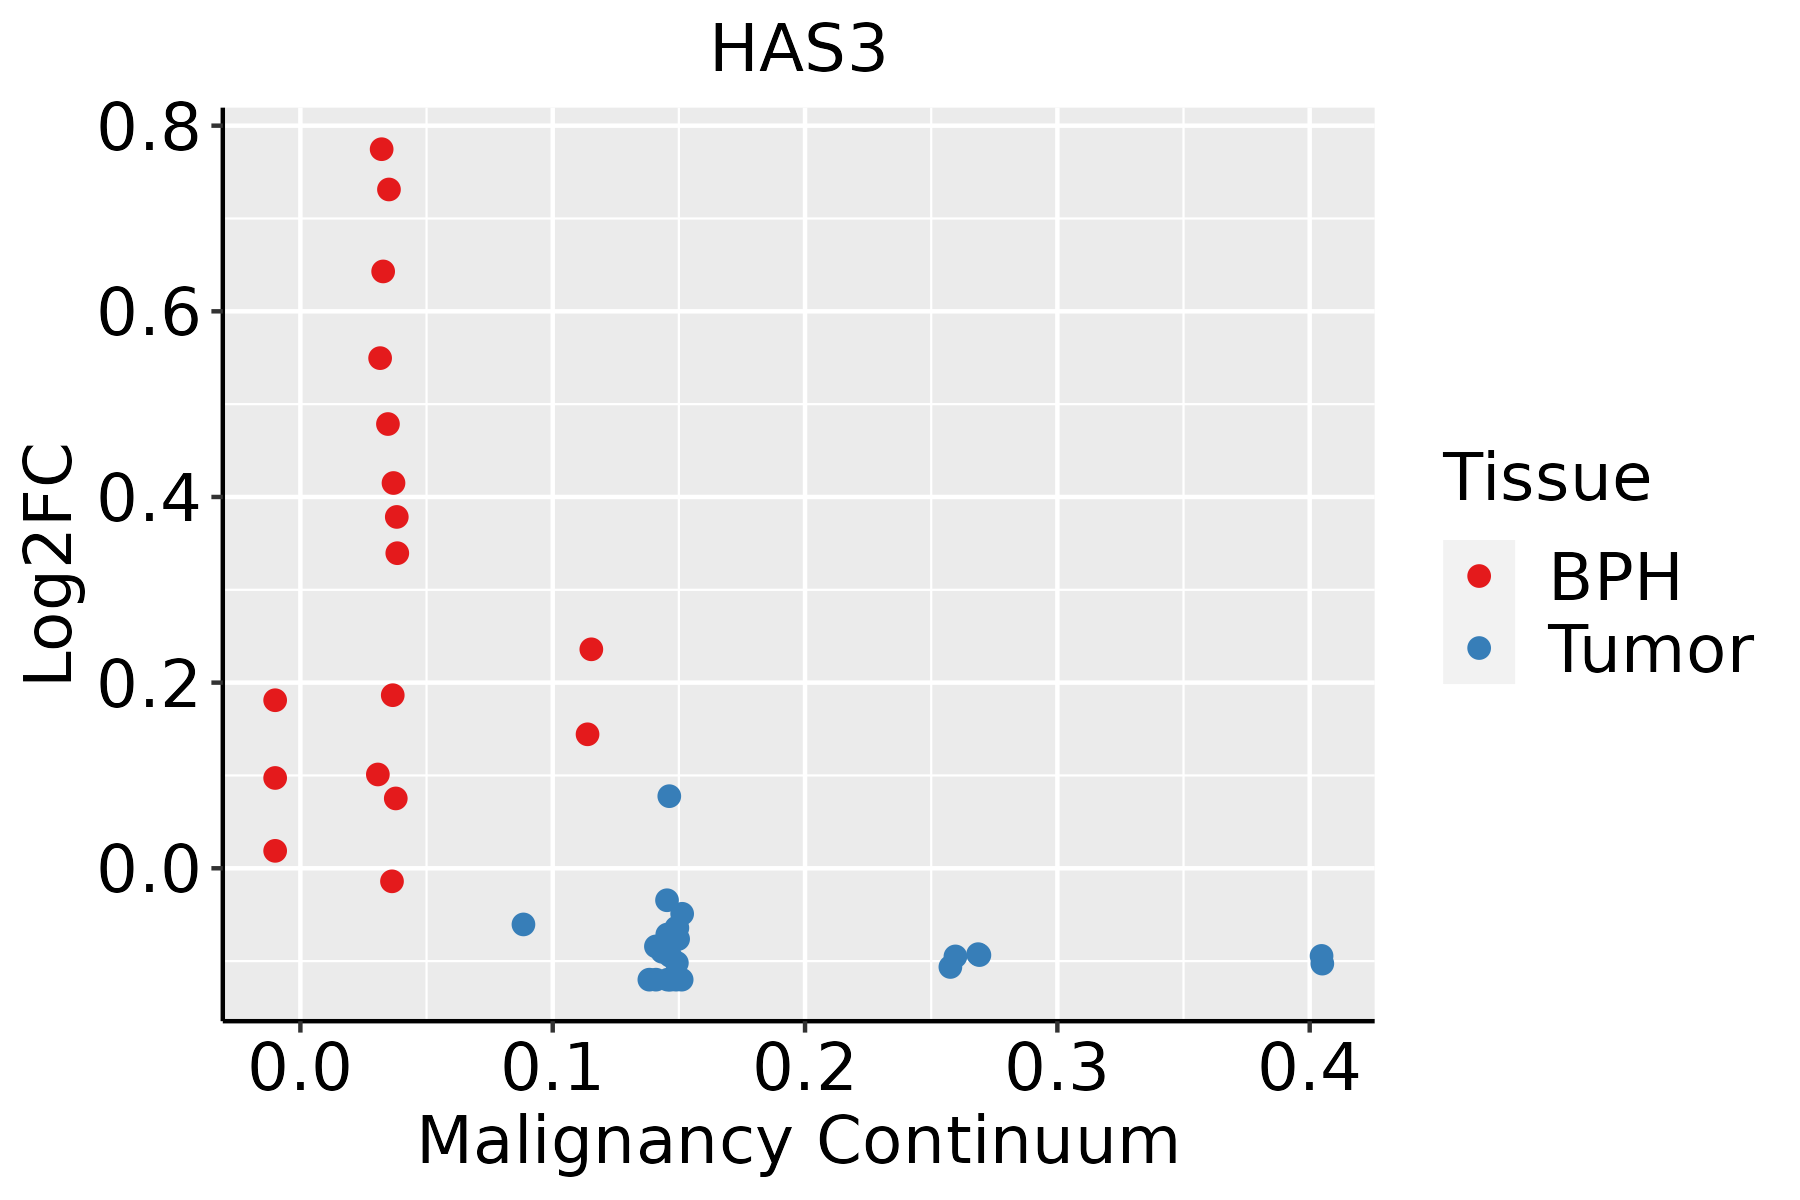 | BPH: Benign Prostatic Hyperplasia |
| Skin | 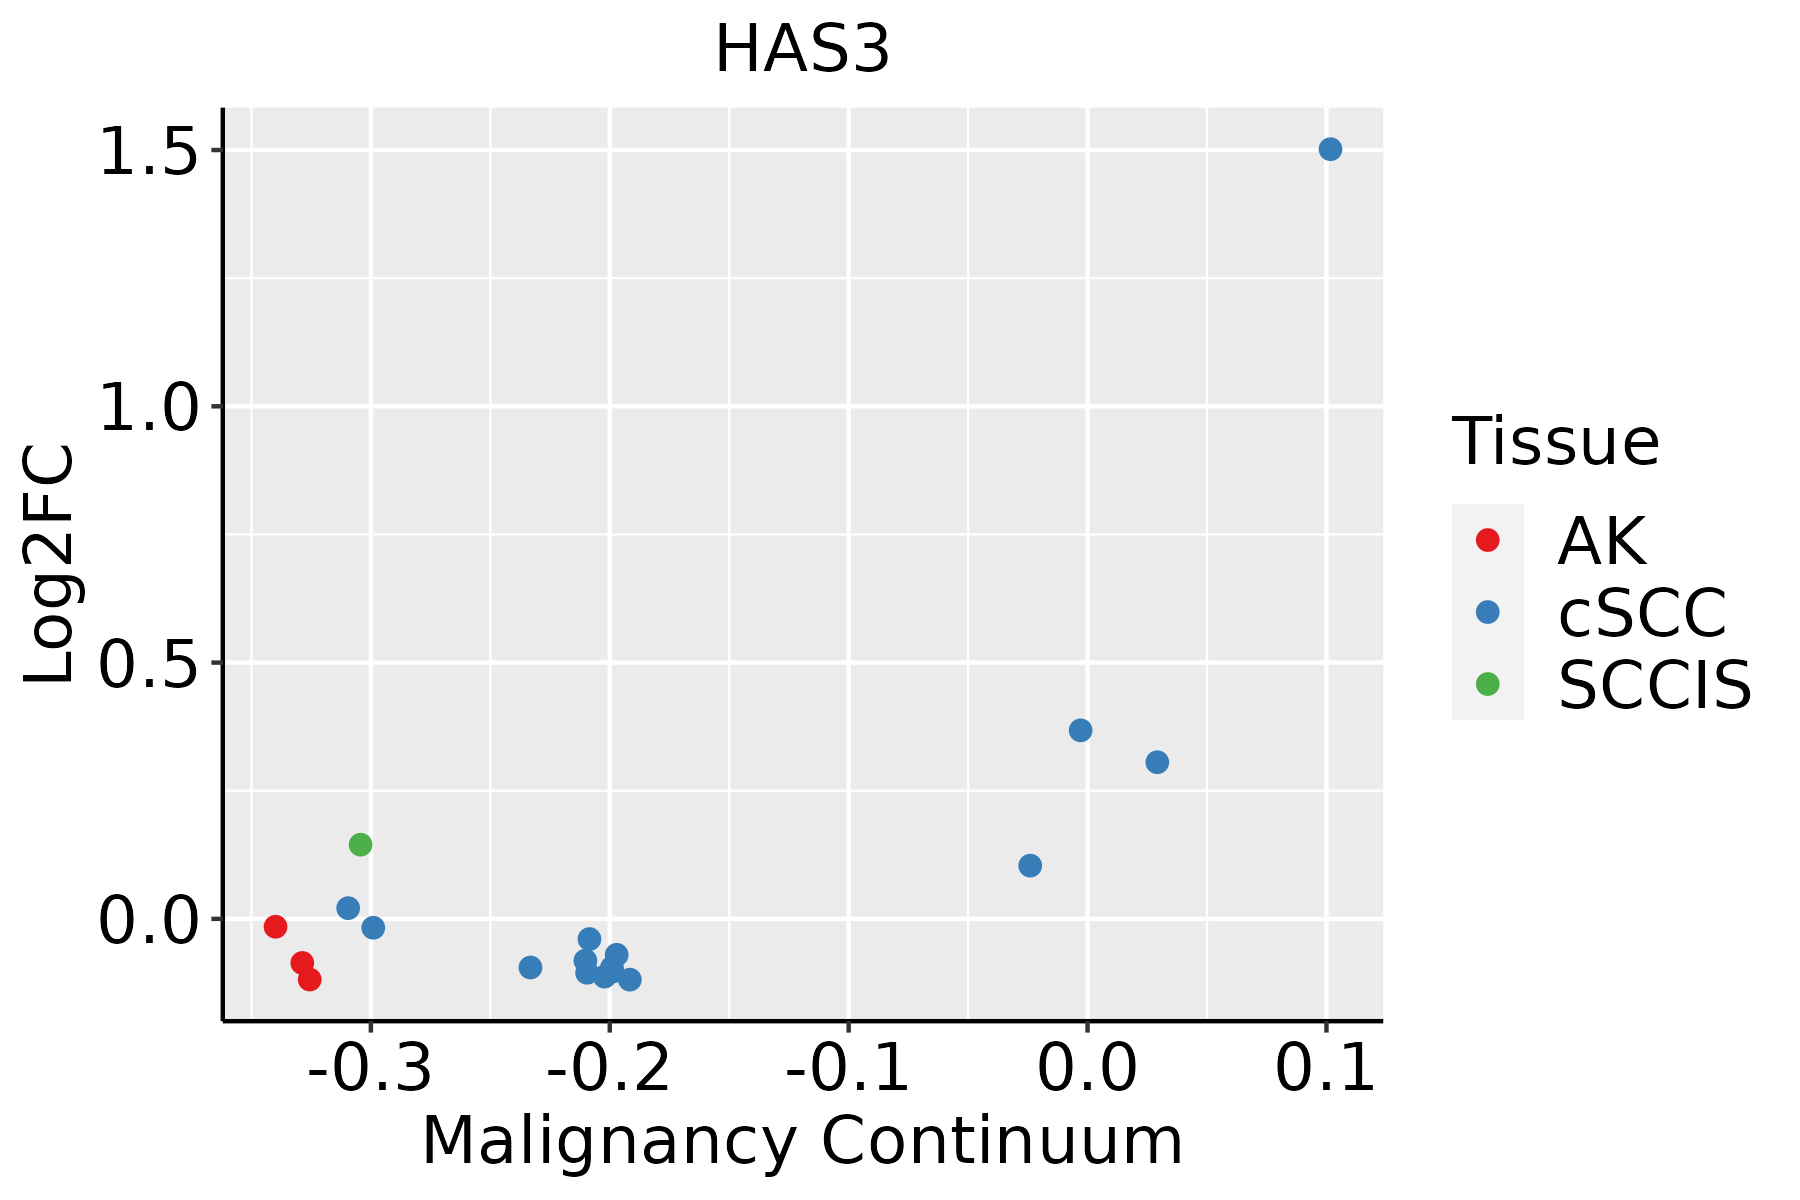 | AK: Actinic keratosis |
| cSCC: Cutaneous squamous cell carcinoma | ||
| SCCIS:squamous cell carcinoma in situ |
| ∗log2FC in expression of this searched gene in stem-like cells from each diseased tissue sample relative to stem-like cells in normal samples in each tissue plotted against the malignancy continuum. Samples are colored based on if they are from different disease stage. |
Top |
Malignant transformation related pathway analysis |
| Find out the enriched GO biological processes and KEGG pathways involved in transition from healthy to precancer to cancer |
| Tissue | Disease Stage | Enriched GO biological Processes |
| Colorectum | AD |  |
| Colorectum | SER |  |
| Colorectum | MSS |  |
| Colorectum | MSI-H |  |
| Colorectum | FAP |  |
| ∗Top 15 enriched GO BP terms are showed in the bar plot of each disease state in each tissue. Each row represents a significant GO biological process which is colored according to the -log10(p.adjust). |
| Page: 1 2 3 4 5 6 7 8 9 |
| GO ID | Tissue | Disease Stage | Description | Gene Ratio | Bg Ratio | pvalue | p.adjust | Count |
| GO:0030198 | Cervix | CC | extracellular matrix organization | 52/2311 | 301/18723 | 7.43e-03 | 3.98e-02 | 52 |
| GO:0043062 | Cervix | CC | extracellular structure organization | 52/2311 | 302/18723 | 7.92e-03 | 4.17e-02 | 52 |
| GO:0045229 | Cervix | CC | external encapsulating structure organization | 52/2311 | 304/18723 | 9.00e-03 | 4.57e-02 | 52 |
| GO:00301984 | Esophagus | ESCC | extracellular matrix organization | 171/8552 | 301/18723 | 6.08e-05 | 4.67e-04 | 171 |
| GO:00430624 | Esophagus | ESCC | extracellular structure organization | 171/8552 | 302/18723 | 7.73e-05 | 5.76e-04 | 171 |
| GO:00452294 | Esophagus | ESCC | external encapsulating structure organization | 172/8552 | 304/18723 | 7.80e-05 | 5.80e-04 | 172 |
| GO:00442626 | Esophagus | ESCC | cellular carbohydrate metabolic process | 160/8552 | 283/18723 | 1.43e-04 | 9.66e-04 | 160 |
| GO:00160514 | Esophagus | ESCC | carbohydrate biosynthetic process | 117/8552 | 202/18723 | 2.96e-04 | 1.79e-03 | 117 |
| GO:00850292 | Esophagus | ESCC | extracellular matrix assembly | 29/8552 | 45/18723 | 8.63e-03 | 3.04e-02 | 29 |
| GO:0006024 | Esophagus | ESCC | glycosaminoglycan biosynthetic process | 45/8552 | 75/18723 | 8.75e-03 | 3.08e-02 | 45 |
| GO:0006023 | Esophagus | ESCC | aminoglycan biosynthetic process | 47/8552 | 79/18723 | 9.29e-03 | 3.23e-02 | 47 |
| GO:00346372 | Esophagus | ESCC | cellular carbohydrate biosynthetic process | 46/8552 | 78/18723 | 1.24e-02 | 4.13e-02 | 46 |
| GO:00301983 | Oral cavity | OSCC | extracellular matrix organization | 146/7305 | 301/18723 | 4.67e-04 | 2.77e-03 | 146 |
| GO:0085029 | Oral cavity | OSCC | extracellular matrix assembly | 29/7305 | 45/18723 | 4.85e-04 | 2.86e-03 | 29 |
| GO:00452293 | Oral cavity | OSCC | external encapsulating structure organization | 147/7305 | 304/18723 | 5.30e-04 | 3.08e-03 | 147 |
| GO:00430623 | Oral cavity | OSCC | extracellular structure organization | 146/7305 | 302/18723 | 5.59e-04 | 3.23e-03 | 146 |
| GO:00160513 | Oral cavity | OSCC | carbohydrate biosynthetic process | 97/7305 | 202/18723 | 5.50e-03 | 2.13e-02 | 97 |
| GO:00442625 | Oral cavity | OSCC | cellular carbohydrate metabolic process | 130/7305 | 283/18723 | 9.98e-03 | 3.49e-02 | 130 |
| GO:00442624 | Prostate | BPH | cellular carbohydrate metabolic process | 66/3107 | 283/18723 | 2.06e-03 | 1.16e-02 | 66 |
| GO:00430621 | Prostate | BPH | extracellular structure organization | 67/3107 | 302/18723 | 6.67e-03 | 3.00e-02 | 67 |
| Page: 1 2 |
| Pathway ID | Tissue | Disease Stage | Description | Gene Ratio | Bg Ratio | pvalue | p.adjust | qvalue | Count |
| Page: 1 |
Top |
Cell-cell communication analysis |
| Identification of potential cell-cell interactions between two cell types and their ligand-receptor pairs for different disease states |
| Ligand | Receptor | LRpair | Pathway | Tissue | Disease Stage |
| Page: 1 |
Top |
Single-cell gene regulatory network inference analysis |
| Find out the significant the regulons (TFs) and the target genes of each regulon across cell types for different disease states |
| TF | Cell Type | Tissue | Disease Stage | Target Gene | RSS | Regulon Activity |
| ∗The dot plots of a searched regulon are shown for all cell subpopulations in each disease state of each tissue based on the regulon specific score inferred using pySCENIC and by calculating the average expression. |
| Page: 1 |
Top |
Somatic mutation of malignant transformation related genes |
| Annotation of somatic variants for genes involved in malignant transformation |
| Hugo Symbol | Variant Class | Variant Classification | dbSNP RS | HGVSc | HGVSp | HGVSp Short | SWISSPROT | BIOTYPE | SIFT | PolyPhen | Tumor Sample Barcode | Tissue | Histology | Sex | Age | Stage | Therapy Types | Drugs | Outcome |
| HAS3 | SNV | Missense_Mutation | c.386A>G | p.Asp129Gly | p.D129G | O00219 | protein_coding | deleterious(0.02) | probably_damaging(1) | TCGA-BH-A0HX-01 | Breast | breast invasive carcinoma | Female | <65 | I/II | Chemotherapy | adrimycin | SD | |
| HAS3 | SNV | Missense_Mutation | c.664C>G | p.Pro222Ala | p.P222A | O00219 | protein_coding | deleterious(0.03) | benign(0.225) | TCGA-DR-A0ZM-01 | Cervix | cervical & endocervical cancer | Female | <65 | III/IV | Unspecific | Cisplatin | SD | |
| HAS3 | SNV | Missense_Mutation | rs774289115 | c.1214N>A | p.Arg405His | p.R405H | O00219 | protein_coding | tolerated(0.05) | possibly_damaging(0.748) | TCGA-AA-3833-01 | Colorectum | colon adenocarcinoma | Female | <65 | I/II | Unknown | Unknown | SD |
| HAS3 | SNV | Missense_Mutation | rs773346129 | c.989N>A | p.Arg330Gln | p.R330Q | O00219 | protein_coding | tolerated(0.28) | benign(0.001) | TCGA-AA-A010-01 | Colorectum | colon adenocarcinoma | Female | <65 | I/II | Chemotherapy | folinic | CR |
| HAS3 | SNV | Missense_Mutation | c.148G>A | p.Ala50Thr | p.A50T | O00219 | protein_coding | tolerated(0.08) | possibly_damaging(0.651) | TCGA-AZ-6598-01 | Colorectum | colon adenocarcinoma | Female | >=65 | I/II | Unknown | Unknown | SD | |
| HAS3 | SNV | Missense_Mutation | novel | c.1081T>C | p.Tyr361His | p.Y361H | O00219 | protein_coding | deleterious(0) | probably_damaging(0.999) | TCGA-CA-6717-01 | Colorectum | colon adenocarcinoma | Male | <65 | I/II | Chemotherapy | oxaliplatin | CR |
| HAS3 | SNV | Missense_Mutation | c.148N>A | p.Ala50Thr | p.A50T | O00219 | protein_coding | tolerated(0.08) | possibly_damaging(0.651) | TCGA-G4-6304-01 | Colorectum | colon adenocarcinoma | Female | >=65 | I/II | Chemotherapy | fluorouracil | PD | |
| HAS3 | SNV | Missense_Mutation | c.631N>G | p.Ile211Val | p.I211V | O00219 | protein_coding | tolerated(1) | benign(0.007) | TCGA-DY-A1DG-01 | Colorectum | rectum adenocarcinoma | Male | >=65 | I/II | Unknown | Unknown | PD | |
| HAS3 | SNV | Missense_Mutation | novel | c.616N>A | p.Asp206Asn | p.D206N | O00219 | protein_coding | tolerated(0.14) | benign(0.026) | TCGA-A5-A0G2-01 | Endometrium | uterine corpus endometrioid carcinoma | Female | <65 | III/IV | Unknown | Unknown | SD |
| HAS3 | SNV | Missense_Mutation | novel | c.1003N>A | p.Ala335Thr | p.A335T | O00219 | protein_coding | tolerated(0.18) | probably_damaging(0.991) | TCGA-A5-A0G2-01 | Endometrium | uterine corpus endometrioid carcinoma | Female | <65 | III/IV | Unknown | Unknown | SD |
| Page: 1 2 3 4 5 |
Top |
Related drugs of malignant transformation related genes |
| Identification of chemicals and drugs interact with genes involved in malignant transfromation |
| (DGIdb 4.0) |
| Entrez ID | Symbol | Category | Interaction Types | Drug Claim Name | Drug Name | PMIDs |
| 3038 | HAS3 | CLINICALLY ACTIONABLE, DRUGGABLE GENOME | HYDROCORTISONE | HYDROCORTISONE | 13130151 | |
| 3038 | HAS3 | CLINICALLY ACTIONABLE, DRUGGABLE GENOME | anthracyclines and related substances | |||
| 3038 | HAS3 | CLINICALLY ACTIONABLE, DRUGGABLE GENOME | RETINOIC ACID | 10772242 |
| Page: 1 |

Copyright 2023-Present -The University of Texas Health Science Center at Houston |