
|
|||||
|
 | |
| |
| |
| |
| |
| |
|
Gene: HACD4 |
Gene summary for HACD4 |
| Gene information | Species | Human | Gene symbol | HACD4 | Gene ID | 401494 |
| Gene name | 3-hydroxyacyl-CoA dehydratase 4 | |
| Gene Alias | PTPLAD2 | |
| Cytomap | 9p21.3 | |
| Gene Type | protein-coding | GO ID | GO:0000038 | UniProtAcc | Q5VWC8 |
Top |
Malignant transformation analysis |
| Identification of the aberrant gene expression in precancerous and cancerous lesions by comparing the gene expression of stem-like cells in diseased tissues with normal stem cells |
| Entrez ID | Symbol | Replicates | Species | Organ | Tissue | Adj P-value | Log2FC | Malignancy |
| 401494 | HACD4 | P57T-E | Human | Esophagus | ESCC | 1.42e-02 | 5.18e-02 | 0.0926 |
| 401494 | HACD4 | P62T-E | Human | Esophagus | ESCC | 2.94e-21 | 4.31e-01 | 0.1302 |
| 401494 | HACD4 | P65T-E | Human | Esophagus | ESCC | 1.18e-03 | 4.97e-02 | 0.0978 |
| 401494 | HACD4 | P74T-E | Human | Esophagus | ESCC | 2.67e-16 | 5.14e-01 | 0.1479 |
| 401494 | HACD4 | P75T-E | Human | Esophagus | ESCC | 2.29e-04 | 6.13e-02 | 0.1125 |
| 401494 | HACD4 | P76T-E | Human | Esophagus | ESCC | 4.18e-07 | 1.27e-01 | 0.1207 |
| 401494 | HACD4 | P89T-E | Human | Esophagus | ESCC | 2.26e-11 | 6.79e-01 | 0.1752 |
| 401494 | HACD4 | P91T-E | Human | Esophagus | ESCC | 2.06e-20 | 1.82e+00 | 0.1828 |
| 401494 | HACD4 | P127T-E | Human | Esophagus | ESCC | 2.85e-02 | 1.20e-02 | 0.0826 |
| 401494 | HACD4 | HCC1 | Human | Liver | HCC | 4.85e-05 | 7.92e-01 | 0.5336 |
| 401494 | HACD4 | HCC2 | Human | Liver | HCC | 9.15e-15 | 1.34e+00 | 0.5341 |
| 401494 | HACD4 | HCC5 | Human | Liver | HCC | 8.39e-12 | 9.27e-01 | 0.4932 |
| 401494 | HACD4 | C04 | Human | Oral cavity | OSCC | 1.40e-03 | 3.53e-01 | 0.2633 |
| 401494 | HACD4 | C21 | Human | Oral cavity | OSCC | 9.20e-27 | 9.04e-01 | 0.2678 |
| 401494 | HACD4 | C30 | Human | Oral cavity | OSCC | 4.26e-16 | 8.22e-01 | 0.3055 |
| 401494 | HACD4 | C38 | Human | Oral cavity | OSCC | 8.83e-06 | 9.39e-01 | 0.172 |
| 401494 | HACD4 | C51 | Human | Oral cavity | OSCC | 4.37e-09 | 7.11e-01 | 0.2674 |
| 401494 | HACD4 | C08 | Human | Oral cavity | OSCC | 3.39e-08 | 2.98e-01 | 0.1919 |
| 401494 | HACD4 | LN38 | Human | Oral cavity | OSCC | 3.77e-03 | 1.01e+00 | 0.168 |
| Page: 1 2 |
| Tissue | Expression Dynamics | Abbreviation |
| Esophagus | 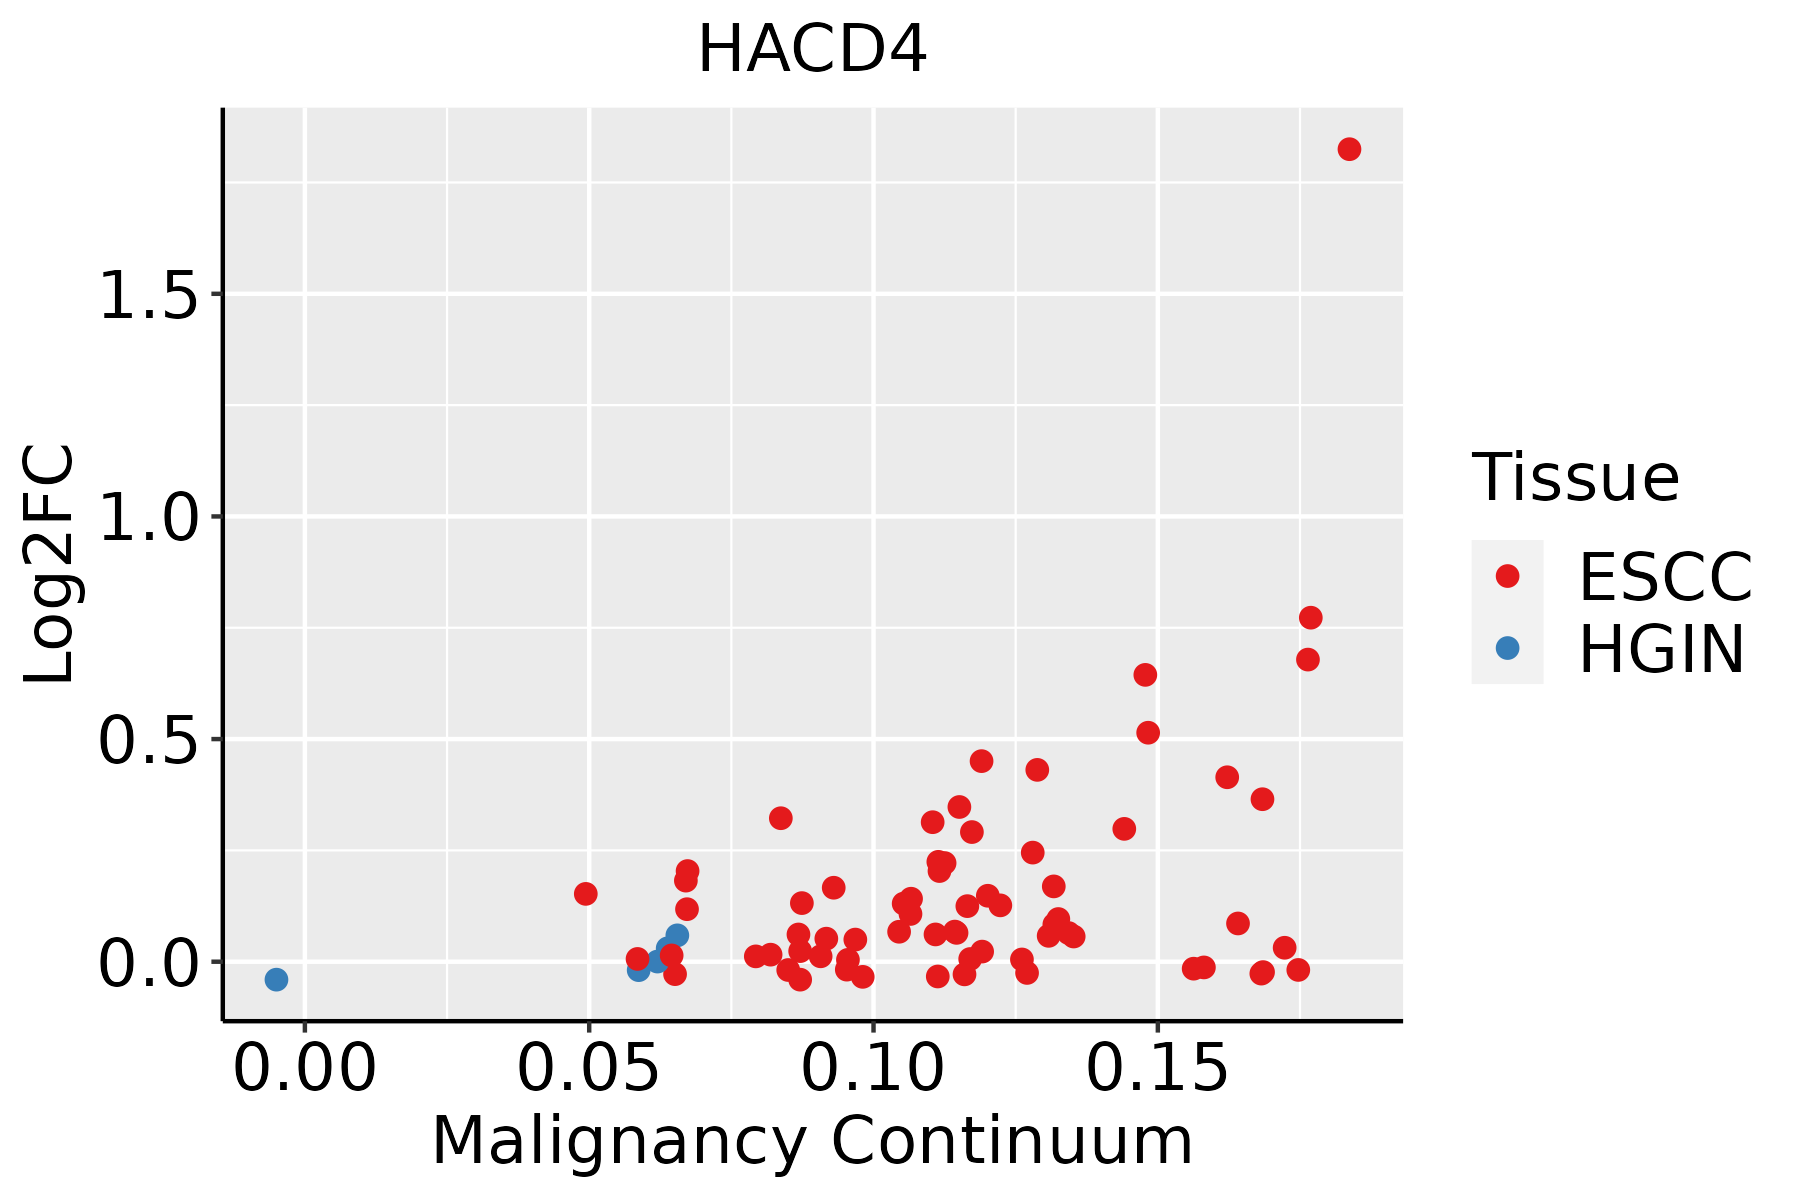 | ESCC: Esophageal squamous cell carcinoma |
| HGIN: High-grade intraepithelial neoplasias | ||
| LGIN: Low-grade intraepithelial neoplasias | ||
| Liver | 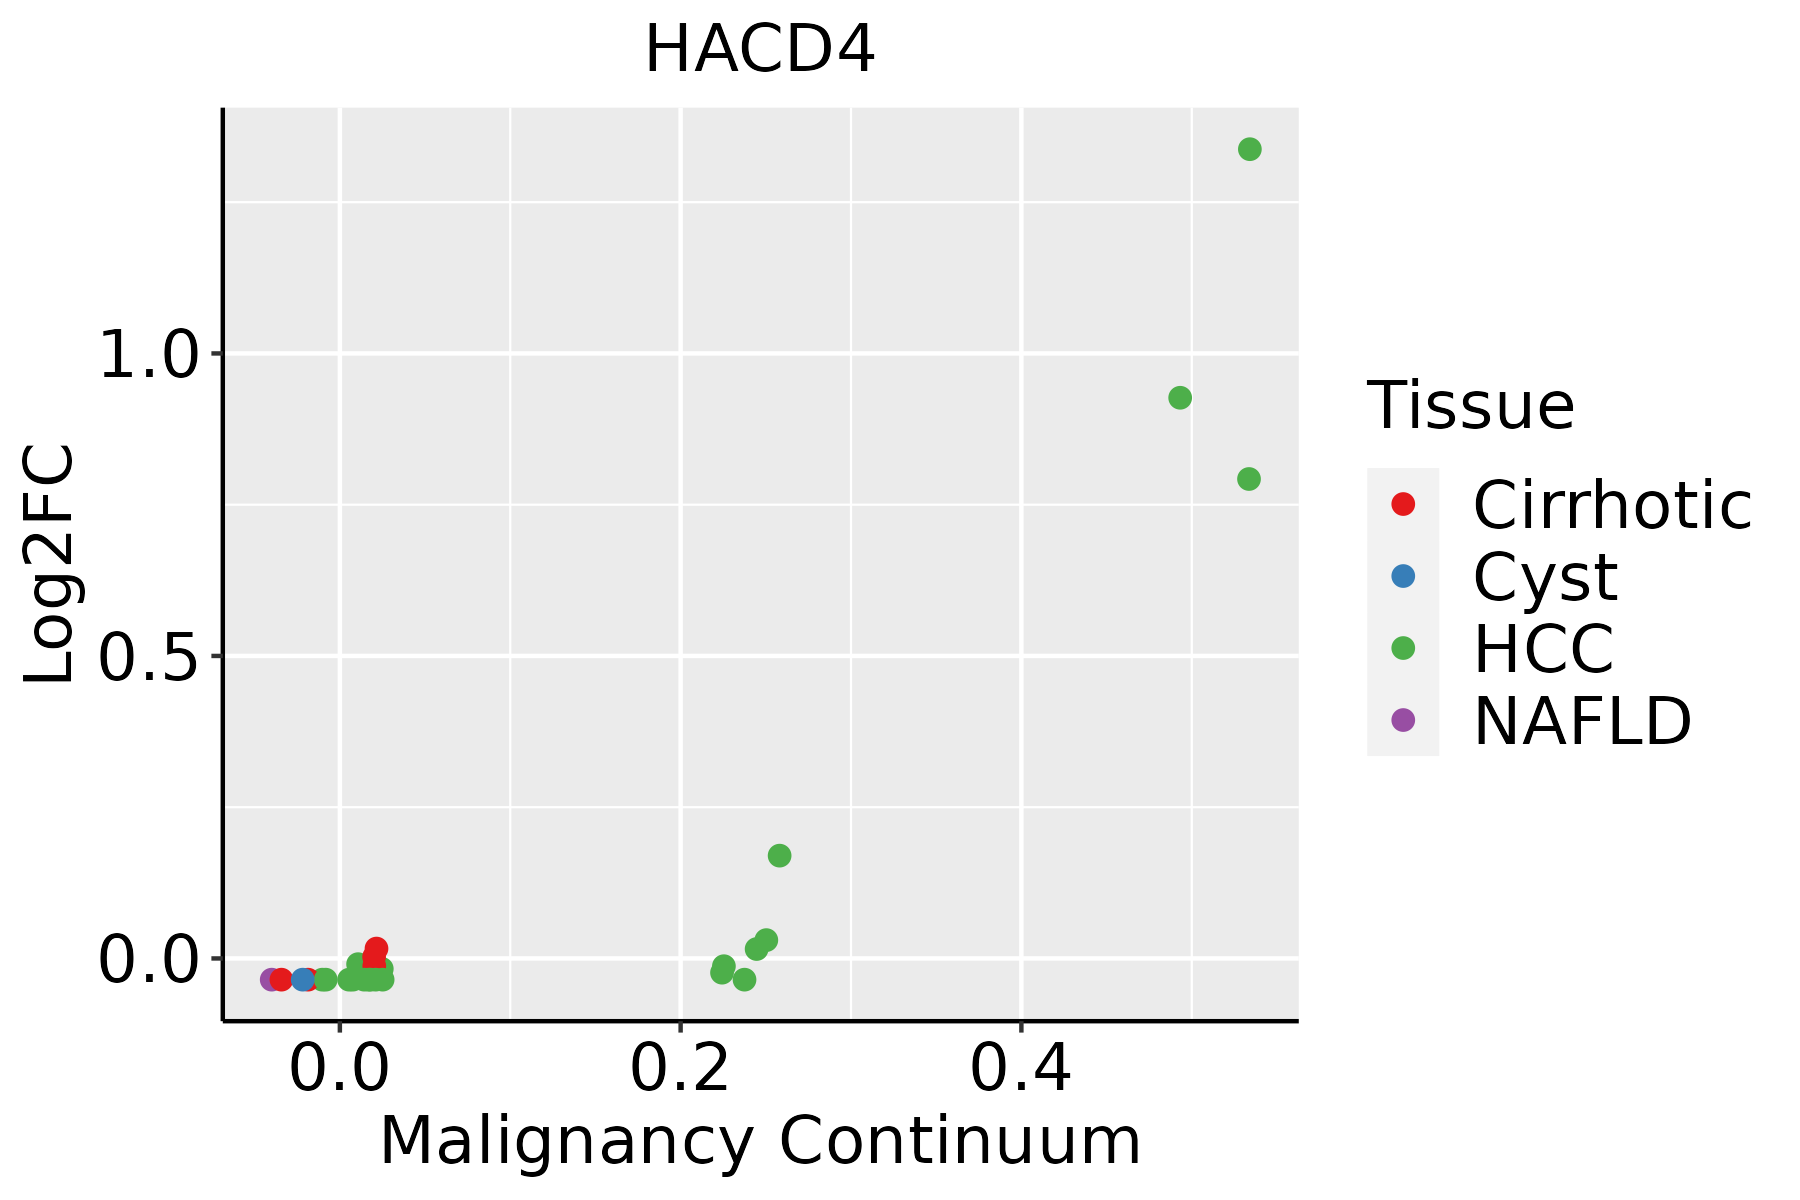 | HCC: Hepatocellular carcinoma |
| NAFLD: Non-alcoholic fatty liver disease | ||
| Oral Cavity |  | EOLP: Erosive Oral lichen planus |
| LP: leukoplakia | ||
| NEOLP: Non-erosive oral lichen planus | ||
| OSCC: Oral squamous cell carcinoma |
| ∗log2FC in expression of this searched gene in stem-like cells from each diseased tissue sample relative to stem-like cells in normal samples in each tissue plotted against the malignancy continuum. Samples are colored based on if they are from different disease stage. |
Top |
Malignant transformation related pathway analysis |
| Find out the enriched GO biological processes and KEGG pathways involved in transition from healthy to precancer to cancer |
| Tissue | Disease Stage | Enriched GO biological Processes |
| Colorectum | AD |  |
| Colorectum | SER |  |
| Colorectum | MSS |  |
| Colorectum | MSI-H |  |
| Colorectum | FAP |  |
| ∗Top 15 enriched GO BP terms are showed in the bar plot of each disease state in each tissue. Each row represents a significant GO biological process which is colored according to the -log10(p.adjust). |
| Page: 1 2 3 4 5 6 7 8 9 |
| GO ID | Tissue | Disease Stage | Description | Gene Ratio | Bg Ratio | pvalue | p.adjust | Count |
| GO:00066433 | Esophagus | ESCC | membrane lipid metabolic process | 130/8552 | 203/18723 | 9.29e-08 | 1.54e-06 | 130 |
| GO:00464673 | Esophagus | ESCC | membrane lipid biosynthetic process | 91/8552 | 142/18723 | 7.19e-06 | 7.19e-05 | 91 |
| GO:00066652 | Esophagus | ESCC | sphingolipid metabolic process | 96/8552 | 155/18723 | 3.21e-05 | 2.66e-04 | 96 |
| GO:00066318 | Esophagus | ESCC | fatty acid metabolic process | 217/8552 | 390/18723 | 4.21e-05 | 3.39e-04 | 217 |
| GO:00463948 | Esophagus | ESCC | carboxylic acid biosynthetic process | 175/8552 | 314/18723 | 1.98e-04 | 1.26e-03 | 175 |
| GO:00160538 | Esophagus | ESCC | organic acid biosynthetic process | 175/8552 | 316/18723 | 3.04e-04 | 1.82e-03 | 175 |
| GO:00301481 | Esophagus | ESCC | sphingolipid biosynthetic process | 62/8552 | 103/18723 | 2.10e-03 | 9.38e-03 | 62 |
| GO:001605321 | Liver | HCC | organic acid biosynthetic process | 200/7958 | 316/18723 | 5.24e-14 | 3.22e-12 | 200 |
| GO:000663122 | Liver | HCC | fatty acid metabolic process | 238/7958 | 390/18723 | 8.24e-14 | 4.84e-12 | 238 |
| GO:004639421 | Liver | HCC | carboxylic acid biosynthetic process | 198/7958 | 314/18723 | 1.19e-13 | 6.78e-12 | 198 |
| GO:007233021 | Liver | HCC | monocarboxylic acid biosynthetic process | 129/7958 | 214/18723 | 1.08e-07 | 2.09e-06 | 129 |
| GO:000663321 | Liver | HCC | fatty acid biosynthetic process | 96/7958 | 163/18723 | 1.71e-05 | 1.85e-04 | 96 |
| GO:00066431 | Liver | HCC | membrane lipid metabolic process | 115/7958 | 203/18723 | 3.17e-05 | 3.22e-04 | 115 |
| GO:0006665 | Liver | HCC | sphingolipid metabolic process | 85/7958 | 155/18723 | 1.27e-03 | 6.92e-03 | 85 |
| GO:0046467 | Liver | HCC | membrane lipid biosynthetic process | 78/7958 | 142/18723 | 1.85e-03 | 9.46e-03 | 78 |
| GO:00066432 | Oral cavity | OSCC | membrane lipid metabolic process | 111/7305 | 203/18723 | 4.02e-06 | 4.69e-05 | 111 |
| GO:00066651 | Oral cavity | OSCC | sphingolipid metabolic process | 84/7305 | 155/18723 | 8.64e-05 | 6.61e-04 | 84 |
| GO:00464672 | Oral cavity | OSCC | membrane lipid biosynthetic process | 77/7305 | 142/18723 | 1.63e-04 | 1.13e-03 | 77 |
| GO:00160537 | Oral cavity | OSCC | organic acid biosynthetic process | 155/7305 | 316/18723 | 1.64e-04 | 1.13e-03 | 155 |
| GO:00463947 | Oral cavity | OSCC | carboxylic acid biosynthetic process | 154/7305 | 314/18723 | 1.73e-04 | 1.19e-03 | 154 |
| Page: 1 2 |
| Pathway ID | Tissue | Disease Stage | Description | Gene Ratio | Bg Ratio | pvalue | p.adjust | qvalue | Count |
| hsa012129 | Esophagus | ESCC | Fatty acid metabolism | 41/4205 | 57/8465 | 5.13e-04 | 1.75e-03 | 8.98e-04 | 41 |
| hsa0121214 | Esophagus | ESCC | Fatty acid metabolism | 41/4205 | 57/8465 | 5.13e-04 | 1.75e-03 | 8.98e-04 | 41 |
| hsa012128 | Oral cavity | OSCC | Fatty acid metabolism | 35/3704 | 57/8465 | 5.37e-03 | 1.29e-02 | 6.55e-03 | 35 |
| hsa0121213 | Oral cavity | OSCC | Fatty acid metabolism | 35/3704 | 57/8465 | 5.37e-03 | 1.29e-02 | 6.55e-03 | 35 |
| Page: 1 |
Top |
Cell-cell communication analysis |
| Identification of potential cell-cell interactions between two cell types and their ligand-receptor pairs for different disease states |
| Ligand | Receptor | LRpair | Pathway | Tissue | Disease Stage |
| Page: 1 |
Top |
Single-cell gene regulatory network inference analysis |
| Find out the significant the regulons (TFs) and the target genes of each regulon across cell types for different disease states |
| TF | Cell Type | Tissue | Disease Stage | Target Gene | RSS | Regulon Activity |
| ∗The dot plots of a searched regulon are shown for all cell subpopulations in each disease state of each tissue based on the regulon specific score inferred using pySCENIC and by calculating the average expression. |
| Page: 1 |
Top |
Somatic mutation of malignant transformation related genes |
| Annotation of somatic variants for genes involved in malignant transformation |
| Hugo Symbol | Variant Class | Variant Classification | dbSNP RS | HGVSc | HGVSp | HGVSp Short | SWISSPROT | BIOTYPE | SIFT | PolyPhen | Tumor Sample Barcode | Tissue | Histology | Sex | Age | Stage | Therapy Types | Drugs | Outcome |
| HACD4 | SNV | Missense_Mutation | rs189125285 | c.410N>C | p.Ile137Thr | p.I137T | Q5VWC8 | protein_coding | tolerated(0.16) | benign(0.005) | TCGA-BH-A0BP-01 | Breast | breast invasive carcinoma | Female | >=65 | I/II | Unknown | Unknown | SD |
| HACD4 | SNV | Missense_Mutation | c.561N>A | p.Asp187Glu | p.D187E | Q5VWC8 | protein_coding | tolerated(0.87) | benign(0.245) | TCGA-E2-A14Z-01 | Breast | breast invasive carcinoma | Female | <65 | I/II | Hormone Therapy | arimidex | PD | |
| HACD4 | SNV | Missense_Mutation | rs770928473 | c.126N>G | p.Phe42Leu | p.F42L | Q5VWC8 | protein_coding | tolerated(0.48) | benign(0.005) | TCGA-GM-A2DI-01 | Breast | breast invasive carcinoma | Female | <65 | I/II | Chemotherapy | taxotere | CR |
| HACD4 | SNV | Missense_Mutation | novel | c.425C>T | p.Ala142Val | p.A142V | Q5VWC8 | protein_coding | tolerated(0.54) | benign(0) | TCGA-VS-A8EI-01 | Cervix | cervical & endocervical cancer | Female | <65 | I/II | Chemotherapy | cisplatin | CR |
| HACD4 | SNV | Missense_Mutation | c.118G>T | p.Val40Phe | p.V40F | Q5VWC8 | protein_coding | deleterious(0) | benign(0.015) | TCGA-A6-2686-01 | Colorectum | colon adenocarcinoma | Female | >=65 | I/II | Unknown | Unknown | SD | |
| HACD4 | deletion | Frame_Shift_Del | rs774509822 | c.689delA | p.Lys230ArgfsTer45 | p.K230Rfs*45 | Q5VWC8 | protein_coding | TCGA-A6-2672-01 | Colorectum | colon adenocarcinoma | Female | >=65 | III/IV | Unknown | Unknown | SD | ||
| HACD4 | SNV | Missense_Mutation | novel | c.99N>T | p.Trp33Cys | p.W33C | Q5VWC8 | protein_coding | deleterious(0) | probably_damaging(0.995) | TCGA-A5-A1OF-01 | Endometrium | uterine corpus endometrioid carcinoma | Female | <65 | I/II | Unknown | Unknown | SD |
| HACD4 | SNV | Missense_Mutation | c.44N>T | p.Arg15Met | p.R15M | Q5VWC8 | protein_coding | tolerated(0.06) | possibly_damaging(0.62) | TCGA-AP-A0LM-01 | Endometrium | uterine corpus endometrioid carcinoma | Female | <65 | III/IV | Chemotherapy | cisplatin | SD | |
| HACD4 | SNV | Missense_Mutation | c.372N>T | p.Leu124Phe | p.L124F | Q5VWC8 | protein_coding | deleterious(0.01) | probably_damaging(0.933) | TCGA-B5-A0JY-01 | Endometrium | uterine corpus endometrioid carcinoma | Female | <65 | III/IV | Chemotherapy | doxorubicin | SD | |
| HACD4 | SNV | Missense_Mutation | novel | c.126N>A | p.Phe42Leu | p.F42L | Q5VWC8 | protein_coding | tolerated(0.48) | benign(0.005) | TCGA-B5-A0JY-01 | Endometrium | uterine corpus endometrioid carcinoma | Female | <65 | III/IV | Chemotherapy | doxorubicin | SD |
| Page: 1 2 3 |
Top |
Related drugs of malignant transformation related genes |
| Identification of chemicals and drugs interact with genes involved in malignant transfromation |
| (DGIdb 4.0) |
| Entrez ID | Symbol | Category | Interaction Types | Drug Claim Name | Drug Name | PMIDs |
| Page: 1 |

Copyright 2023-Present -The University of Texas Health Science Center at Houston |