
|
|||||
|
 | |
| |
| |
| |
| |
| |
|
Gene: GSE1 |
Gene summary for GSE1 |
| Gene information | Species | Human | Gene symbol | GSE1 | Gene ID | 23199 |
| Gene name | Gse1 coiled-coil protein | |
| Gene Alias | CRHSP24 | |
| Cytomap | 16q24.1 | |
| Gene Type | protein-coding | GO ID | GO:0003674 | UniProtAcc | Q14687 |
Top |
Malignant transformation analysis |
| Identification of the aberrant gene expression in precancerous and cancerous lesions by comparing the gene expression of stem-like cells in diseased tissues with normal stem cells |
| Entrez ID | Symbol | Replicates | Species | Organ | Tissue | Adj P-value | Log2FC | Malignancy |
| 23199 | GSE1 | A001-C-014 | Human | Colorectum | FAP | 5.35e-10 | 5.82e-03 | 0.0135 |
| 23199 | GSE1 | A002-C-016 | Human | Colorectum | FAP | 2.67e-14 | -7.77e-02 | 0.0521 |
| 23199 | GSE1 | A015-C-002 | Human | Colorectum | FAP | 3.47e-10 | 9.63e-02 | -0.0763 |
| 23199 | GSE1 | A001-C-203 | Human | Colorectum | FAP | 7.89e-09 | 9.21e-02 | -0.0481 |
| 23199 | GSE1 | A002-C-116 | Human | Colorectum | FAP | 1.17e-29 | 1.08e-01 | -0.0452 |
| 23199 | GSE1 | A014-C-008 | Human | Colorectum | FAP | 4.16e-12 | 1.51e-01 | -0.191 |
| 23199 | GSE1 | A018-E-020 | Human | Colorectum | FAP | 2.22e-17 | 1.16e-01 | -0.2034 |
| 23199 | GSE1 | F034 | Human | Colorectum | FAP | 1.98e-14 | 1.76e-01 | -0.0665 |
| 23199 | GSE1 | F072B | Human | Colorectum | FAP | 2.18e-03 | 4.66e-02 | 0.257 |
| 23199 | GSE1 | CRC-1-8810 | Human | Colorectum | CRC | 1.07e-03 | -1.18e-01 | 0.6257 |
| 23199 | GSE1 | CRC-3-11773 | Human | Colorectum | CRC | 6.74e-12 | 4.16e-01 | 0.2564 |
| 23199 | GSE1 | AEH-subject3 | Human | Endometrium | AEH | 1.21e-08 | 3.22e-01 | -0.2576 |
| 23199 | GSE1 | AEH-subject4 | Human | Endometrium | AEH | 2.92e-02 | 2.70e-01 | -0.2657 |
| 23199 | GSE1 | EEC-subject3 | Human | Endometrium | EEC | 3.01e-04 | 1.30e-01 | -0.2525 |
| 23199 | GSE1 | GSM6177620_NYU_UCEC1_lib1_lib1 | Human | Endometrium | EEC | 6.37e-13 | 2.35e-01 | -0.1869 |
| 23199 | GSE1 | GSM6177620_NYU_UCEC1_lib2_lib2 | Human | Endometrium | EEC | 6.43e-07 | 8.18e-03 | -0.1875 |
| 23199 | GSE1 | GSM6177620_NYU_UCEC1_lib3_lib3 | Human | Endometrium | EEC | 1.54e-11 | 1.12e-01 | -0.1883 |
| 23199 | GSE1 | GSM6177621_NYU_UCEC2_lib1_lib1 | Human | Endometrium | EEC | 1.86e-08 | -2.48e-03 | -0.1934 |
| 23199 | GSE1 | GSM6177622_NYU_UCEC3_lib1_lib1 | Human | Endometrium | EEC | 1.02e-14 | 1.06e-01 | -0.1917 |
| 23199 | GSE1 | GSM6177622_NYU_UCEC3_lib2_lib2 | Human | Endometrium | EEC | 7.83e-13 | 5.90e-02 | -0.1916 |
| Page: 1 2 3 4 |
| Tissue | Expression Dynamics | Abbreviation |
| Cervix | 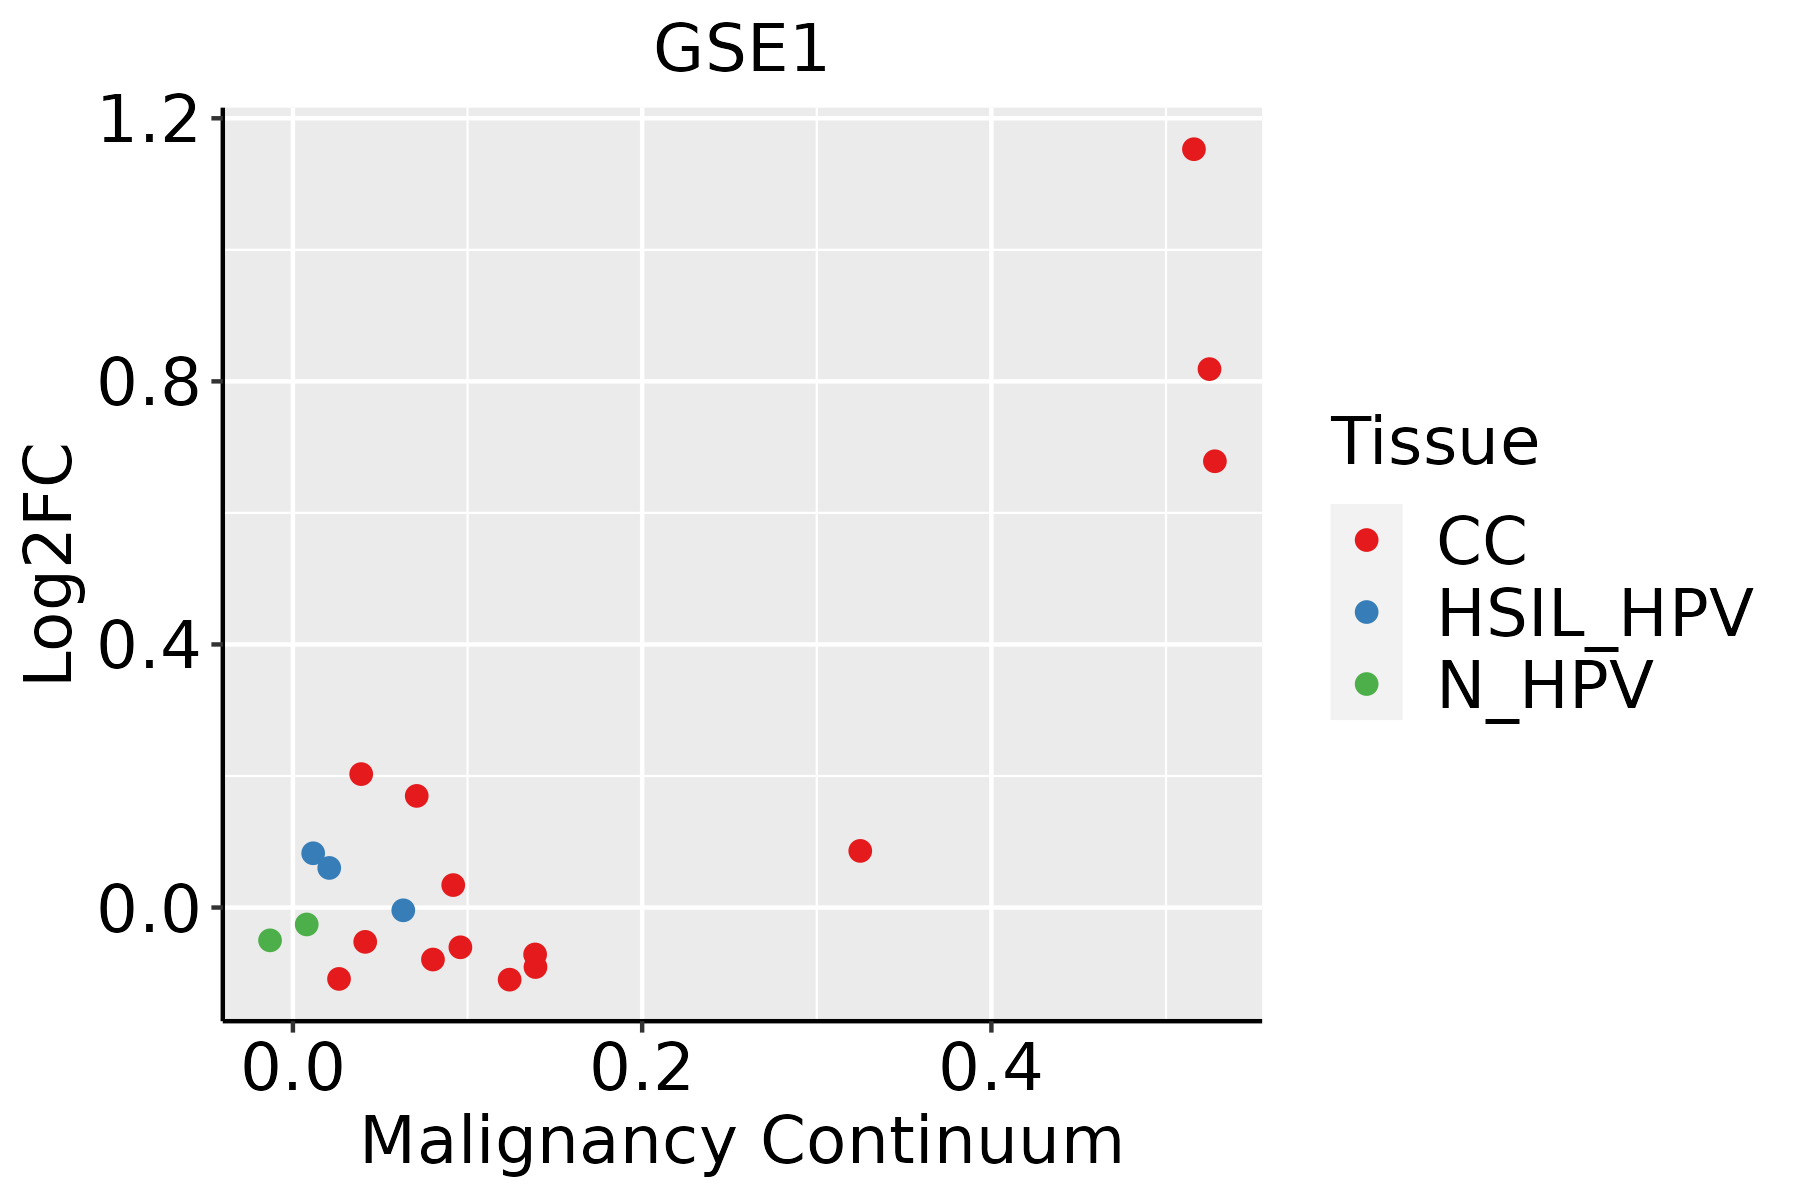 | CC: Cervix cancer |
| HSIL_HPV: HPV-infected high-grade squamous intraepithelial lesions | ||
| N_HPV: HPV-infected normal cervix | ||
| Colorectum (GSE201348) | 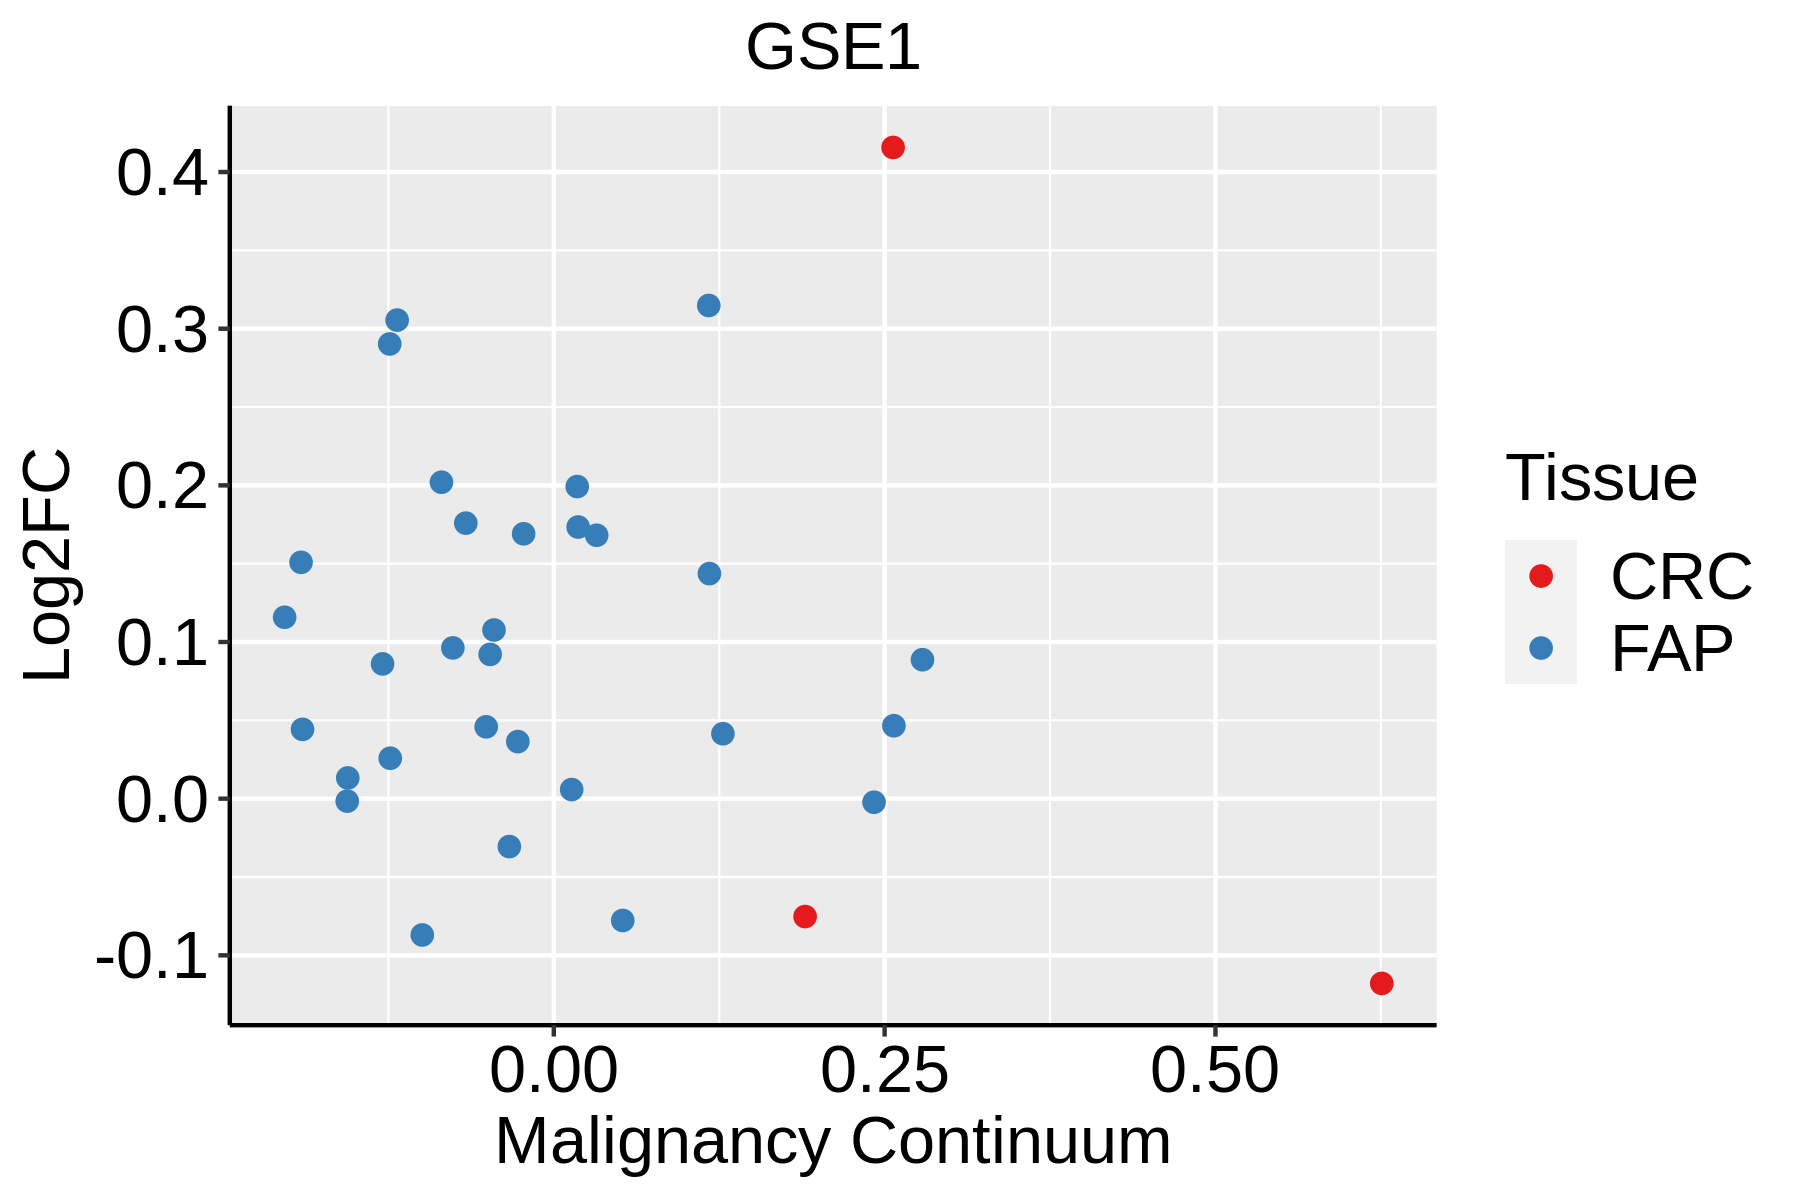 | FAP: Familial adenomatous polyposis |
| CRC: Colorectal cancer | ||
| Colorectum (HTA11) |  | AD: Adenomas |
| SER: Sessile serrated lesions | ||
| MSI-H: Microsatellite-high colorectal cancer | ||
| MSS: Microsatellite stable colorectal cancer | ||
| Endometrium | 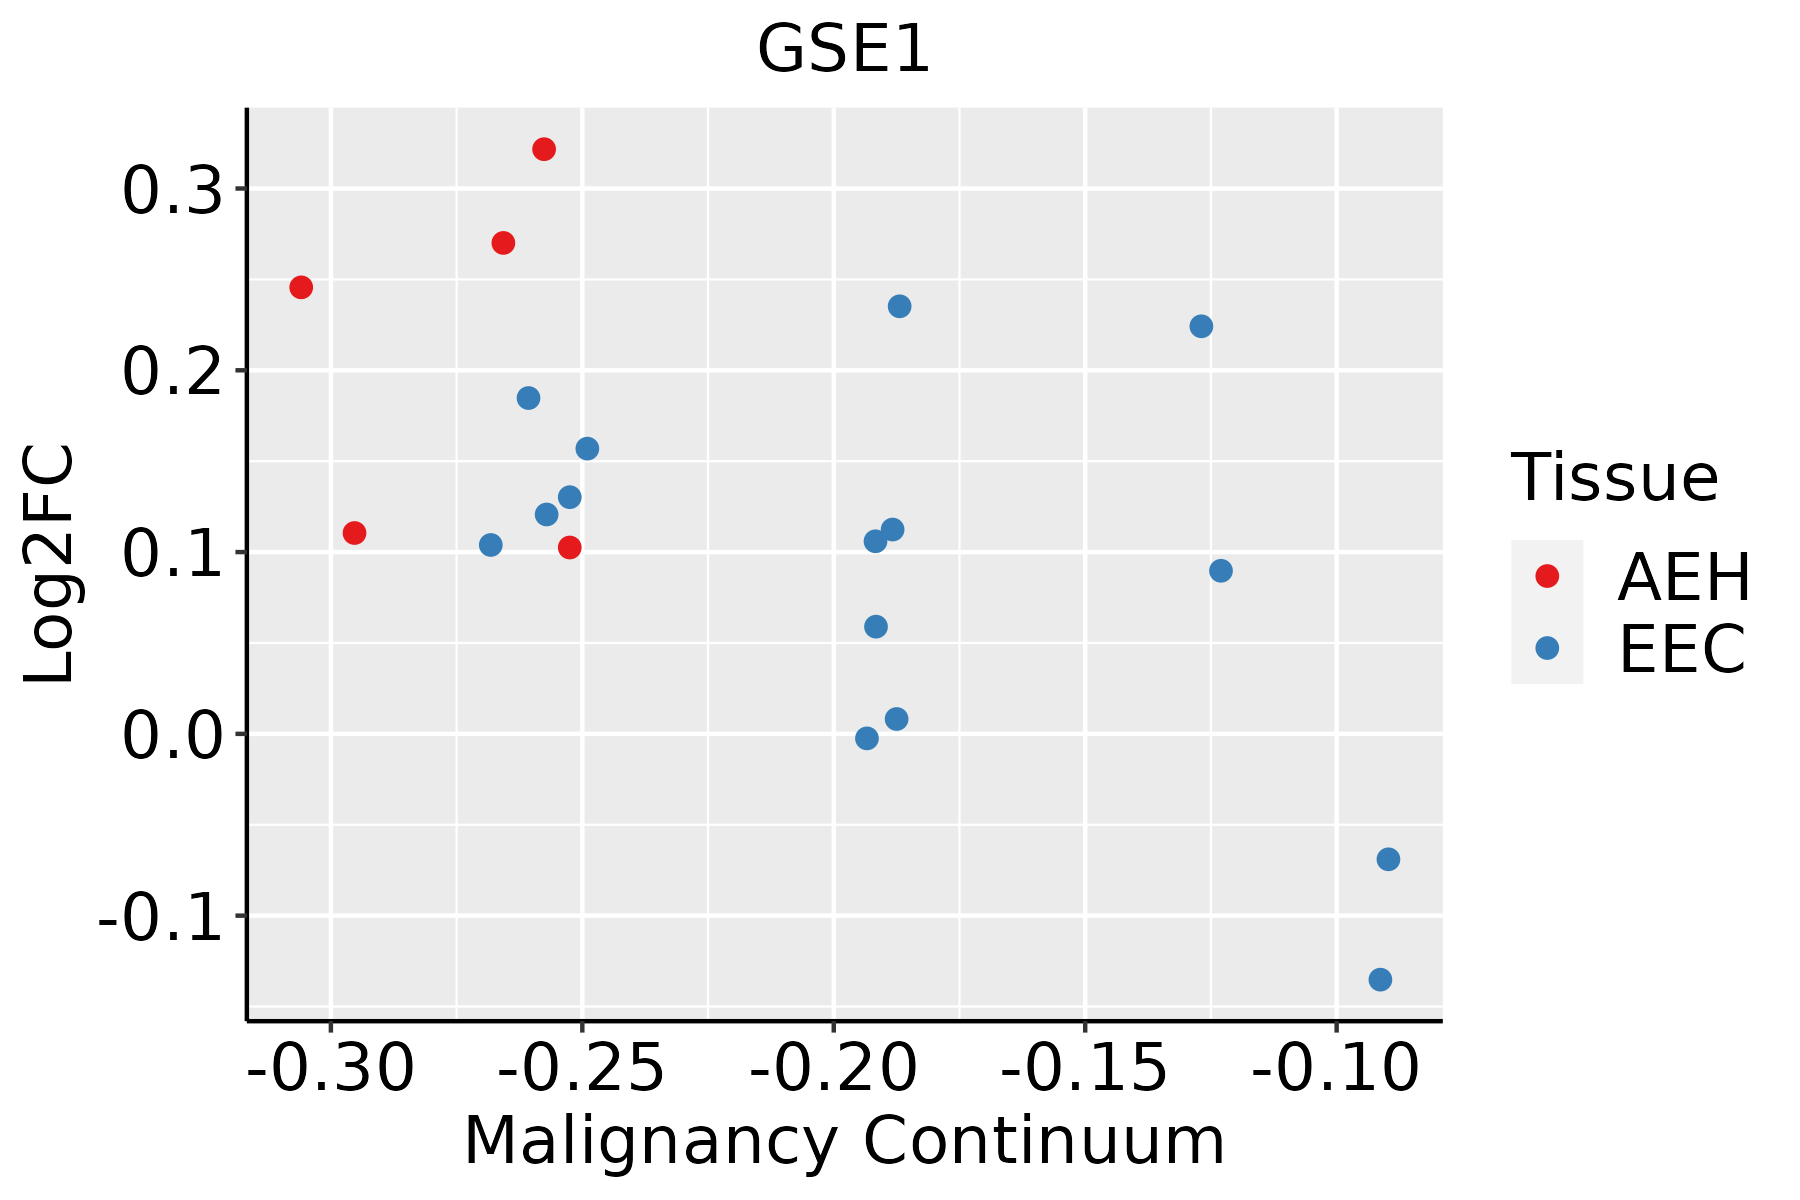 | AEH: Atypical endometrial hyperplasia |
| EEC: Endometrioid Cancer | ||
| Liver | 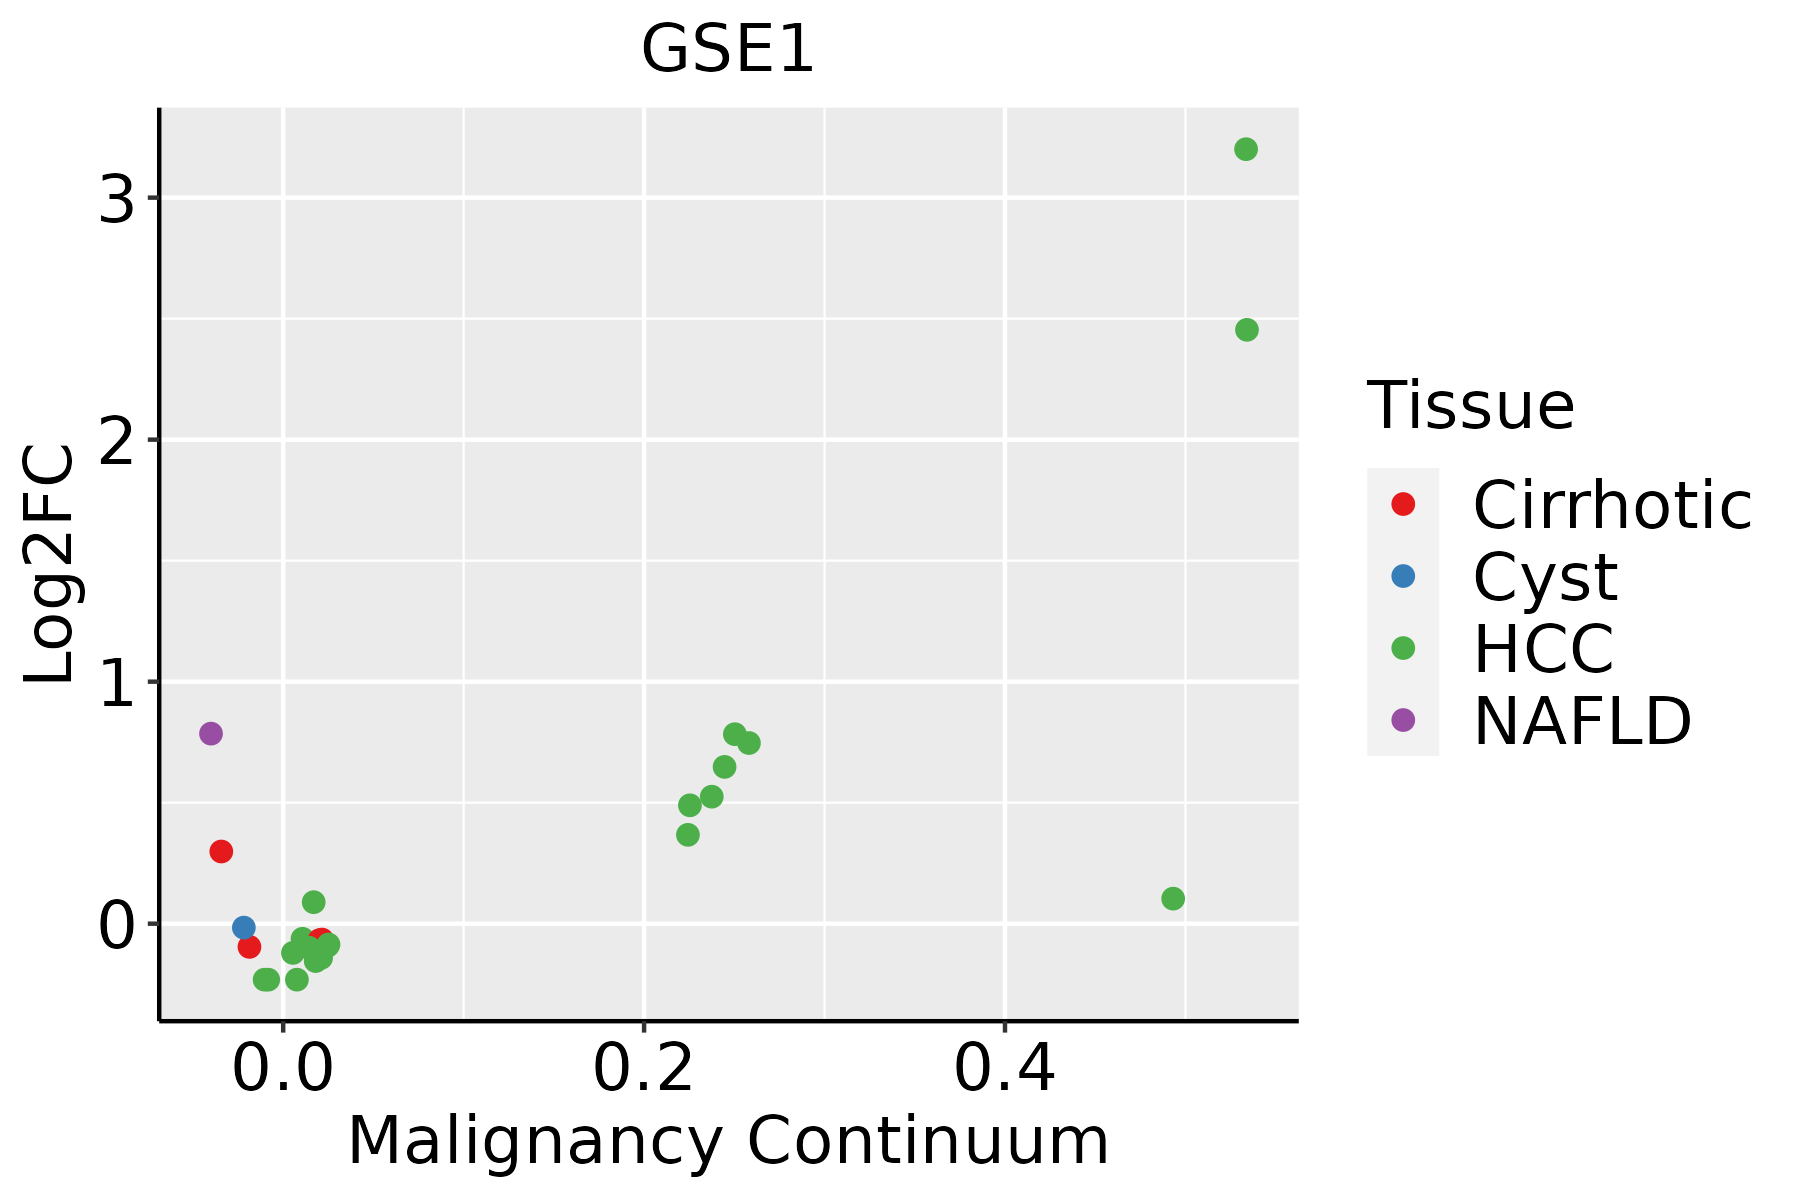 | HCC: Hepatocellular carcinoma |
| NAFLD: Non-alcoholic fatty liver disease | ||
| Prostate | 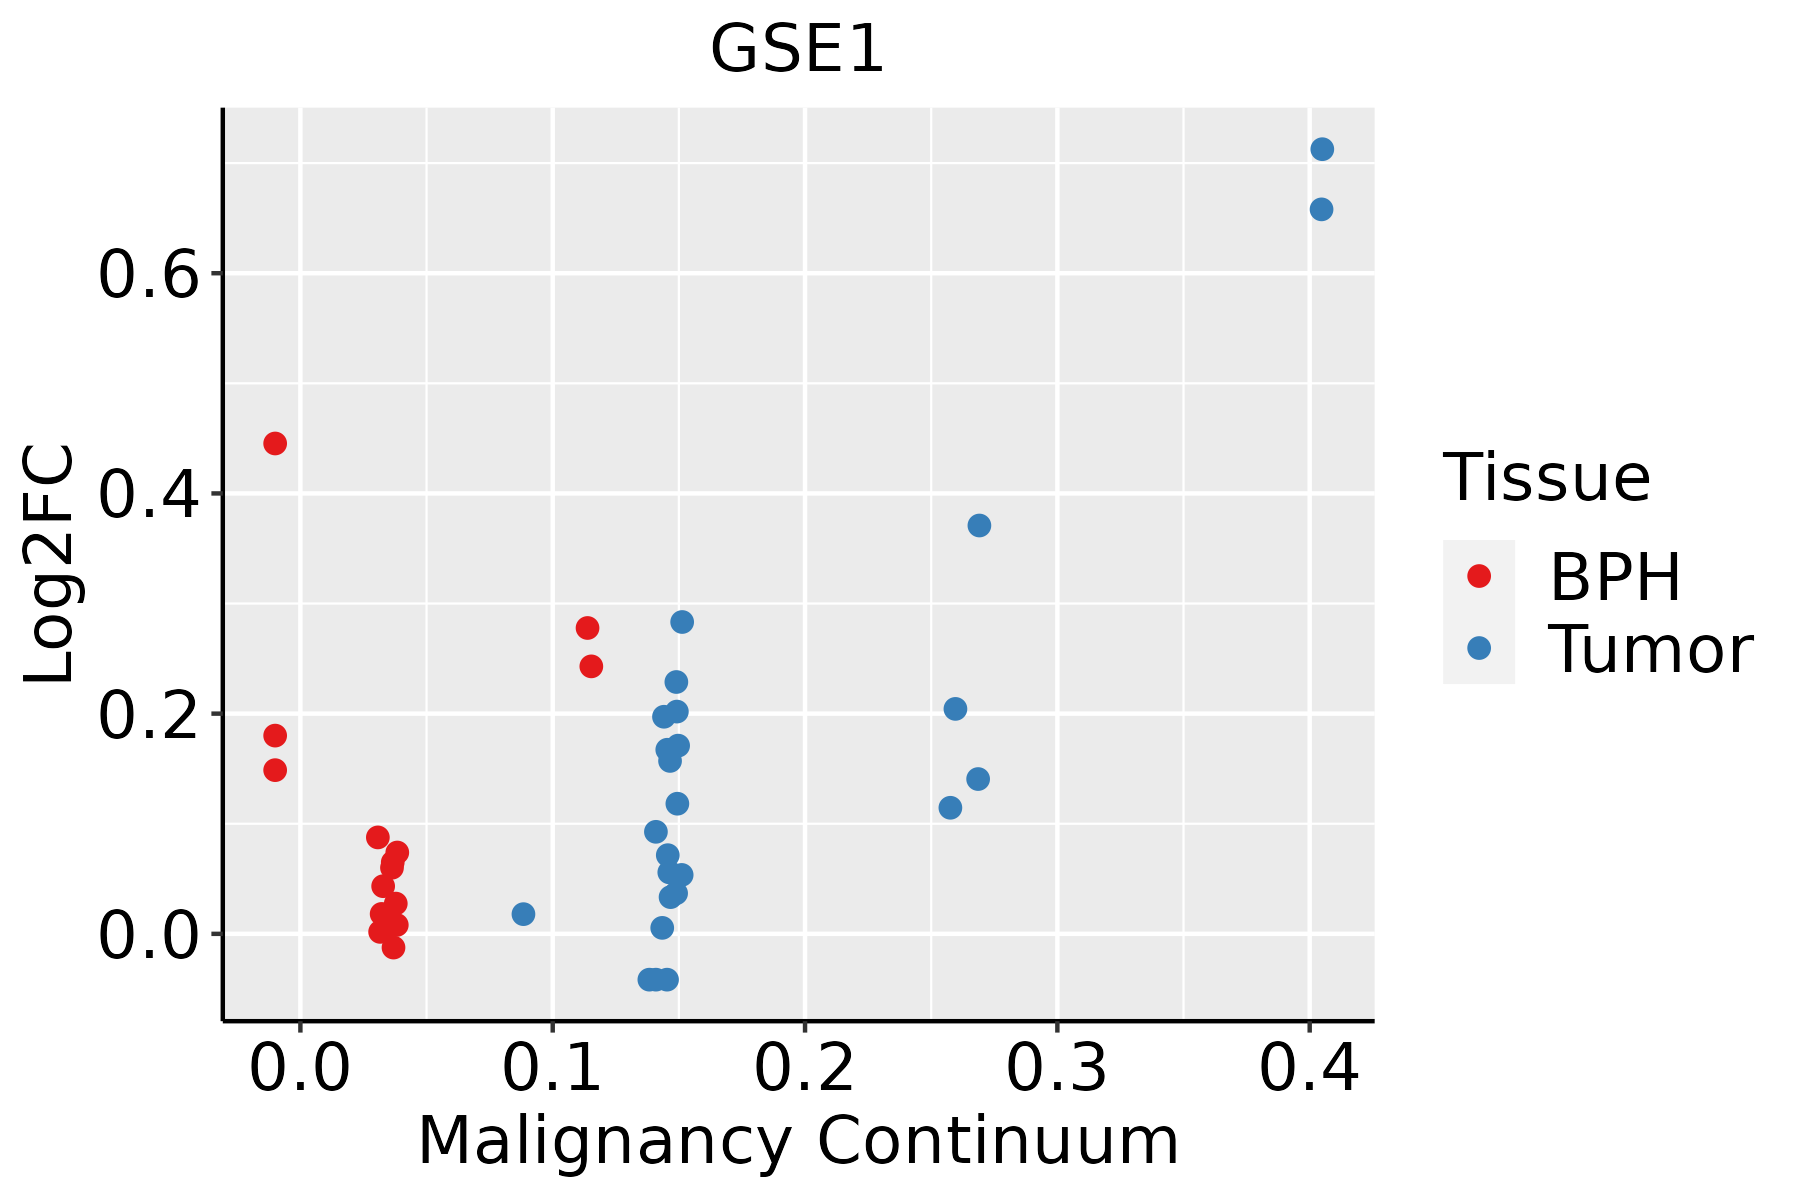 | BPH: Benign Prostatic Hyperplasia |
| Thyroid | 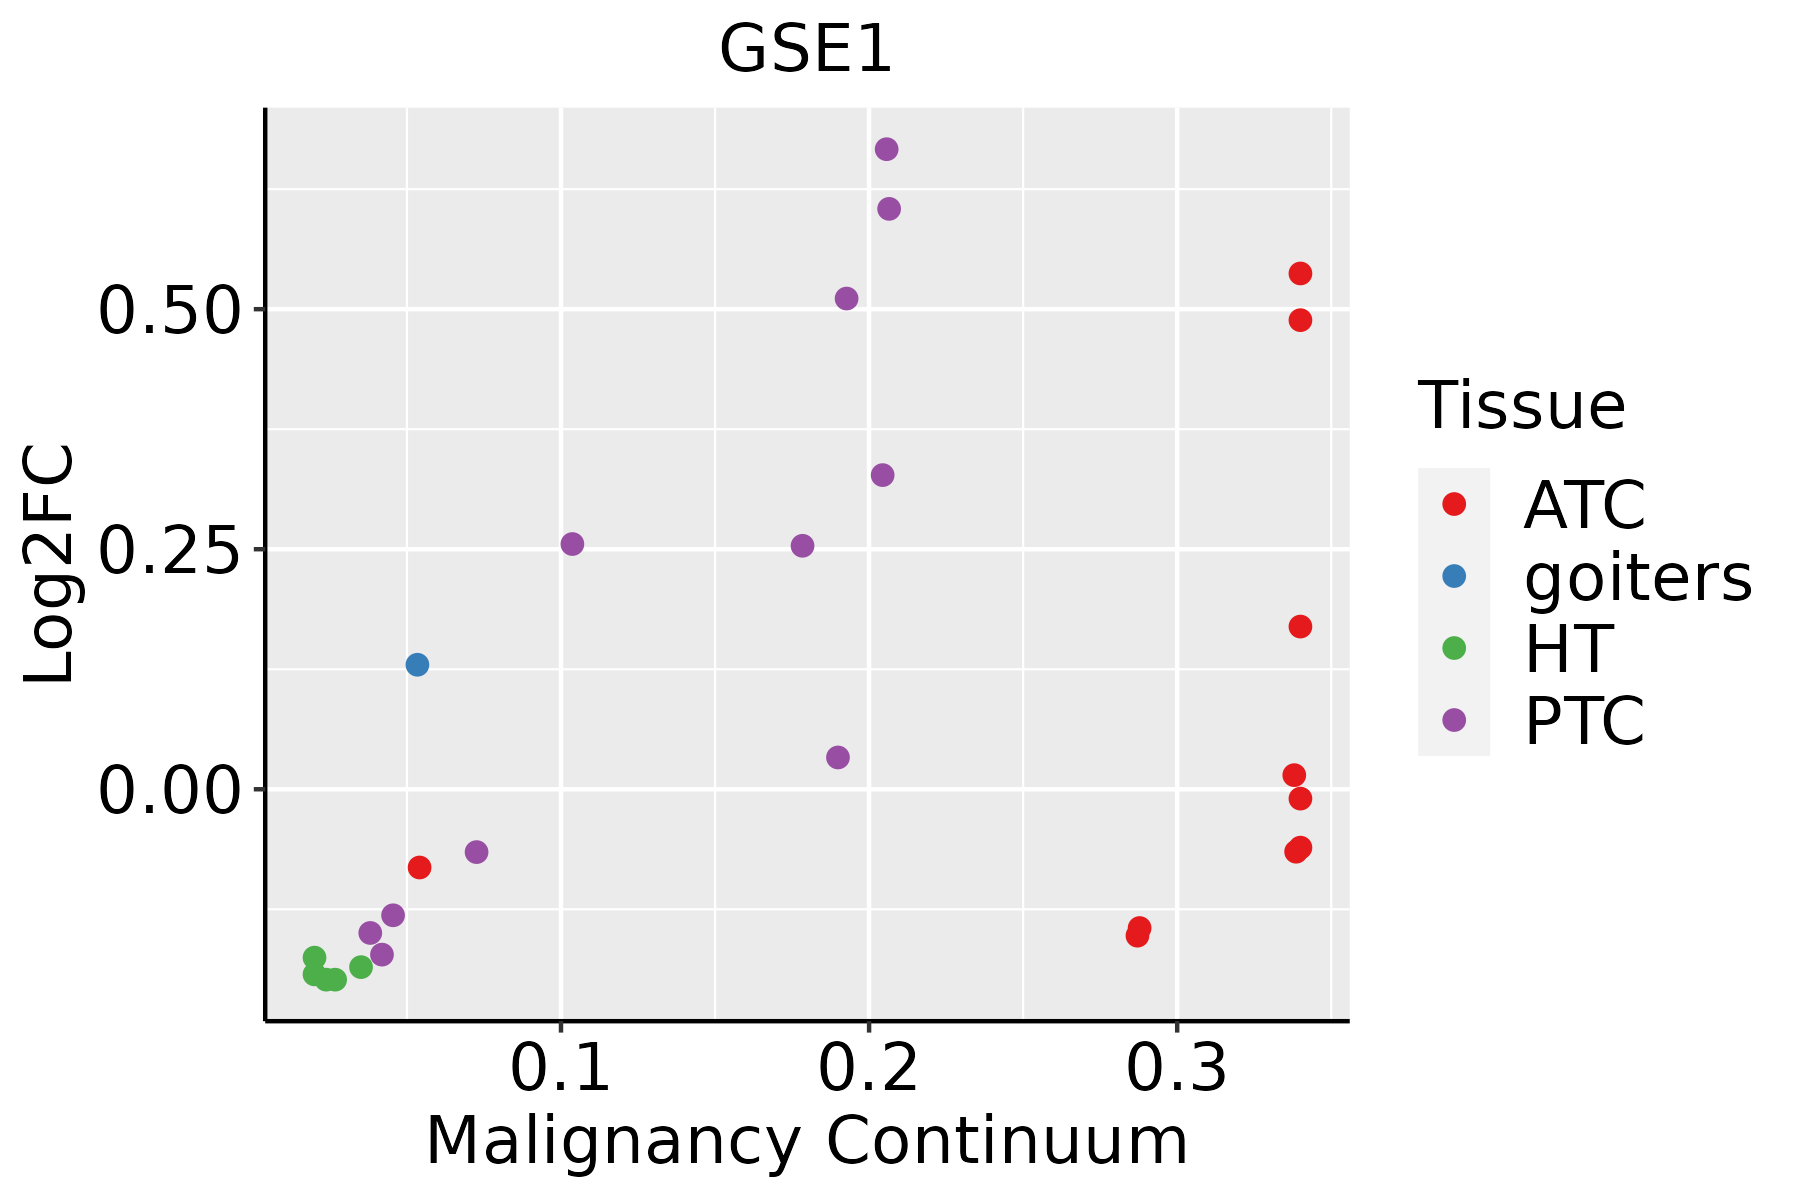 | ATC: Anaplastic thyroid cancer |
| HT: Hashimoto's thyroiditis | ||
| PTC: Papillary thyroid cancer |
| ∗log2FC in expression of this searched gene in stem-like cells from each diseased tissue sample relative to stem-like cells in normal samples in each tissue plotted against the malignancy continuum. Samples are colored based on if they are from different disease stage. |
Top |
Malignant transformation related pathway analysis |
| Find out the enriched GO biological processes and KEGG pathways involved in transition from healthy to precancer to cancer |
| Tissue | Disease Stage | Enriched GO biological Processes |
| Colorectum | AD |  |
| Colorectum | SER |  |
| Colorectum | MSS |  |
| Colorectum | MSI-H |  |
| Colorectum | FAP |  |
| ∗Top 15 enriched GO BP terms are showed in the bar plot of each disease state in each tissue. Each row represents a significant GO biological process which is colored according to the -log10(p.adjust). |
| Page: 1 2 3 4 5 6 7 8 9 |
| GO ID | Tissue | Disease Stage | Description | Gene Ratio | Bg Ratio | pvalue | p.adjust | Count |
| Page: 1 |
| Pathway ID | Tissue | Disease Stage | Description | Gene Ratio | Bg Ratio | pvalue | p.adjust | qvalue | Count |
| Page: 1 |
Top |
Cell-cell communication analysis |
| Identification of potential cell-cell interactions between two cell types and their ligand-receptor pairs for different disease states |
| Ligand | Receptor | LRpair | Pathway | Tissue | Disease Stage |
| Page: 1 |
Top |
Single-cell gene regulatory network inference analysis |
| Find out the significant the regulons (TFs) and the target genes of each regulon across cell types for different disease states |
| TF | Cell Type | Tissue | Disease Stage | Target Gene | RSS | Regulon Activity |
| ∗The dot plots of a searched regulon are shown for all cell subpopulations in each disease state of each tissue based on the regulon specific score inferred using pySCENIC and by calculating the average expression. |
| Page: 1 |
Top |
Somatic mutation of malignant transformation related genes |
| Annotation of somatic variants for genes involved in malignant transformation |
| Hugo Symbol | Variant Class | Variant Classification | dbSNP RS | HGVSc | HGVSp | HGVSp Short | SWISSPROT | BIOTYPE | SIFT | PolyPhen | Tumor Sample Barcode | Tissue | Histology | Sex | Age | Stage | Therapy Types | Drugs | Outcome |
| GSE1 | SNV | Missense_Mutation | rs368638789 | c.1496C>G | p.Ala499Gly | p.A499G | Q14687 | protein_coding | deleterious(0.04) | probably_damaging(0.929) | TCGA-A2-A0CS-01 | Breast | breast invasive carcinoma | Female | >=65 | III/IV | Hormone Therapy | anastrozole | SD |
| GSE1 | SNV | Missense_Mutation | c.2942G>A | p.Gly981Glu | p.G981E | Q14687 | protein_coding | tolerated(0.95) | possibly_damaging(0.468) | TCGA-A8-A06Q-01 | Breast | breast invasive carcinoma | Female | <65 | III/IV | Unknown | Unknown | SD | |
| GSE1 | SNV | Missense_Mutation | novel | c.299C>T | p.Pro100Leu | p.P100L | Q14687 | protein_coding | deleterious(0) | probably_damaging(0.999) | TCGA-AC-A2FG-01 | Breast | breast invasive carcinoma | Female | >=65 | I/II | Hormone Therapy | arimidex | CR |
| GSE1 | SNV | Missense_Mutation | novel | c.3220N>A | p.Ala1074Thr | p.A1074T | Q14687 | protein_coding | tolerated(0.58) | benign(0.236) | TCGA-AC-A8OP-01 | Breast | breast invasive carcinoma | Female | >=65 | I/II | Unknown | Unknown | SD |
| GSE1 | SNV | Missense_Mutation | novel | c.298C>A | p.Pro100Thr | p.P100T | Q14687 | protein_coding | deleterious(0) | probably_damaging(0.999) | TCGA-B6-A0IJ-01 | Breast | breast invasive carcinoma | Female | <65 | I/II | Unknown | Unknown | SD |
| GSE1 | SNV | Missense_Mutation | rs142161580 | c.713N>T | p.Pro238Leu | p.P238L | Q14687 | protein_coding | deleterious(0.04) | possibly_damaging(0.725) | TCGA-C8-A12X-01 | Breast | breast invasive carcinoma | Female | <65 | I/II | Unknown | Unknown | SD |
| GSE1 | SNV | Missense_Mutation | c.3239N>G | p.Asn1080Ser | p.N1080S | Q14687 | protein_coding | deleterious(0.04) | benign(0.178) | TCGA-E9-A1NG-01 | Breast | breast invasive carcinoma | Female | <65 | I/II | Hormone Therapy | letrozole | SD | |
| GSE1 | SNV | Missense_Mutation | c.907N>A | p.Gly303Arg | p.G303R | Q14687 | protein_coding | deleterious(0) | probably_damaging(0.999) | TCGA-GM-A2DB-01 | Breast | breast invasive carcinoma | Female | <65 | I/II | Chemotherapy | taxol | CR | |
| GSE1 | SNV | Missense_Mutation | novel | c.3506C>T | p.Ser1169Phe | p.S1169F | Q14687 | protein_coding | deleterious(0) | probably_damaging(0.999) | TCGA-LD-A74U-01 | Breast | breast invasive carcinoma | Female | >=65 | III/IV | Chemotherapy | taxotere | SD |
| GSE1 | deletion | Frame_Shift_Del | c.148_155delNNNNNNNN | p.Leu50ProfsTer87 | p.L50Pfs*87 | Q14687 | protein_coding | TCGA-AR-A1AH-01 | Breast | breast invasive carcinoma | Female | <65 | I/II | Unspecific | PD |
| Page: 1 2 3 4 5 6 7 8 9 10 11 12 13 14 |
Top |
Related drugs of malignant transformation related genes |
| Identification of chemicals and drugs interact with genes involved in malignant transfromation |
| (DGIdb 4.0) |
| Entrez ID | Symbol | Category | Interaction Types | Drug Claim Name | Drug Name | PMIDs |
| Page: 1 |

Copyright 2023-Present -The University of Texas Health Science Center at Houston |