
|
|||||
|
 | |
| |
| |
| |
| |
| |
|
Gene: GRAMD1A |
Gene summary for GRAMD1A |
| Gene information | Species | Human | Gene symbol | GRAMD1A | Gene ID | 57655 |
| Gene name | GRAM domain containing 1A | |
| Gene Alias | KIAA1533 | |
| Cytomap | 19q13.11 | |
| Gene Type | protein-coding | GO ID | GO:0006810 | UniProtAcc | Q96CP6 |
Top |
Malignant transformation analysis |
| Identification of the aberrant gene expression in precancerous and cancerous lesions by comparing the gene expression of stem-like cells in diseased tissues with normal stem cells |
| Entrez ID | Symbol | Replicates | Species | Organ | Tissue | Adj P-value | Log2FC | Malignancy |
| 57655 | GRAMD1A | A002-C-114 | Human | Colorectum | FAP | 9.96e-04 | 1.15e-01 | -0.1561 |
| 57655 | GRAMD1A | A015-C-104 | Human | Colorectum | FAP | 1.82e-04 | 2.26e-01 | -0.1899 |
| 57655 | GRAMD1A | A002-C-116 | Human | Colorectum | FAP | 1.94e-03 | -8.44e-02 | -0.0452 |
| 57655 | GRAMD1A | A018-E-020 | Human | Colorectum | FAP | 1.42e-03 | 3.74e-02 | -0.2034 |
| 57655 | GRAMD1A | LZE4T | Human | Esophagus | ESCC | 5.32e-04 | 1.31e-01 | 0.0811 |
| 57655 | GRAMD1A | LZE5T | Human | Esophagus | ESCC | 2.75e-06 | 3.79e-01 | 0.0514 |
| 57655 | GRAMD1A | LZE7T | Human | Esophagus | ESCC | 6.38e-09 | 3.69e-01 | 0.0667 |
| 57655 | GRAMD1A | LZE24T | Human | Esophagus | ESCC | 5.72e-04 | 1.30e-01 | 0.0596 |
| 57655 | GRAMD1A | P1T-E | Human | Esophagus | ESCC | 1.48e-08 | 5.67e-01 | 0.0875 |
| 57655 | GRAMD1A | P2T-E | Human | Esophagus | ESCC | 1.11e-44 | 6.82e-01 | 0.1177 |
| 57655 | GRAMD1A | P4T-E | Human | Esophagus | ESCC | 1.80e-20 | 5.82e-01 | 0.1323 |
| 57655 | GRAMD1A | P5T-E | Human | Esophagus | ESCC | 2.96e-28 | 5.03e-01 | 0.1327 |
| 57655 | GRAMD1A | P8T-E | Human | Esophagus | ESCC | 6.15e-31 | 5.33e-01 | 0.0889 |
| 57655 | GRAMD1A | P9T-E | Human | Esophagus | ESCC | 1.97e-27 | 7.89e-01 | 0.1131 |
| 57655 | GRAMD1A | P10T-E | Human | Esophagus | ESCC | 5.09e-27 | 4.80e-01 | 0.116 |
| 57655 | GRAMD1A | P11T-E | Human | Esophagus | ESCC | 3.70e-12 | 4.04e-01 | 0.1426 |
| 57655 | GRAMD1A | P12T-E | Human | Esophagus | ESCC | 2.79e-23 | 3.31e-01 | 0.1122 |
| 57655 | GRAMD1A | P15T-E | Human | Esophagus | ESCC | 1.58e-16 | 4.19e-01 | 0.1149 |
| 57655 | GRAMD1A | P16T-E | Human | Esophagus | ESCC | 6.36e-14 | 3.16e-01 | 0.1153 |
| 57655 | GRAMD1A | P17T-E | Human | Esophagus | ESCC | 1.04e-07 | 3.54e-01 | 0.1278 |
| Page: 1 2 3 4 5 6 |
| Tissue | Expression Dynamics | Abbreviation |
| Colorectum (GSE201348) |  | FAP: Familial adenomatous polyposis |
| CRC: Colorectal cancer | ||
| Colorectum (HTA11) |  | AD: Adenomas |
| SER: Sessile serrated lesions | ||
| MSI-H: Microsatellite-high colorectal cancer | ||
| MSS: Microsatellite stable colorectal cancer | ||
| Esophagus | 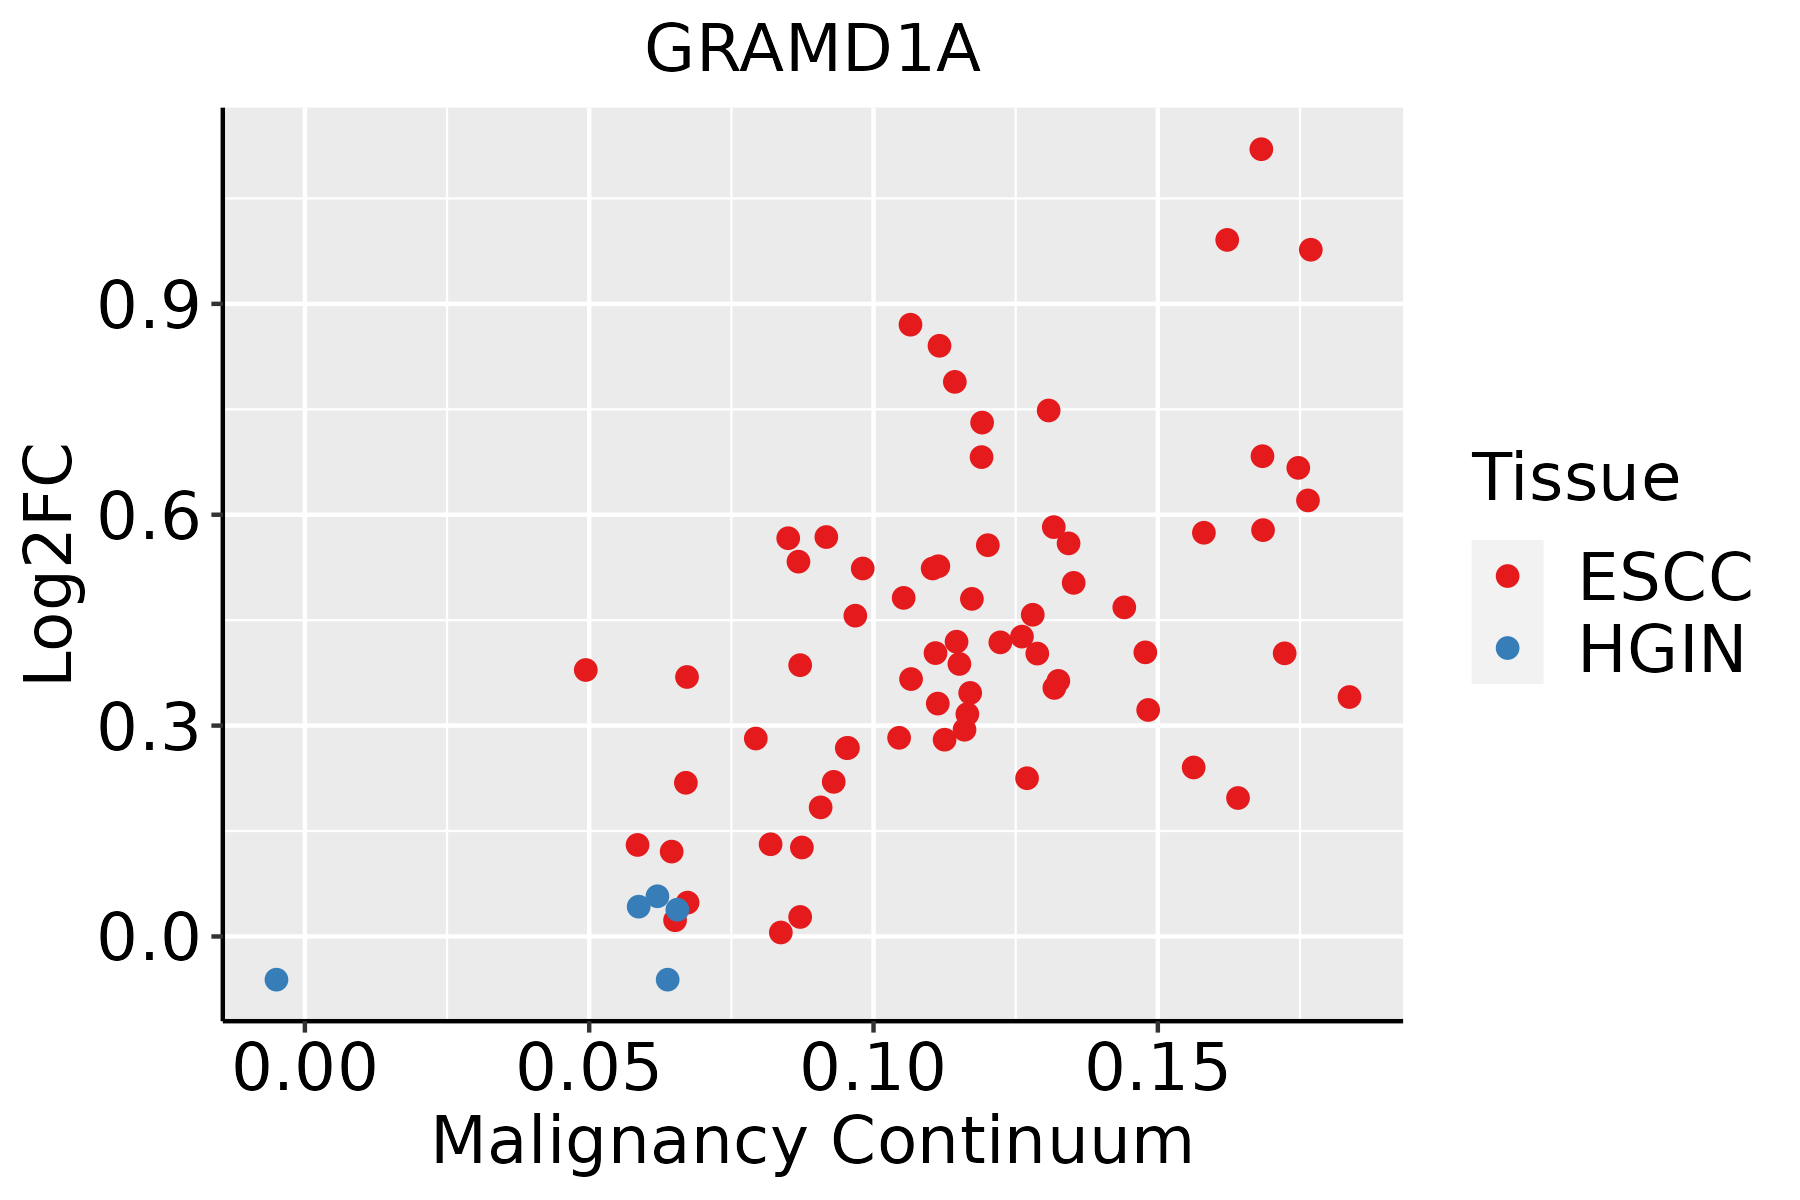 | ESCC: Esophageal squamous cell carcinoma |
| HGIN: High-grade intraepithelial neoplasias | ||
| LGIN: Low-grade intraepithelial neoplasias | ||
| Liver | 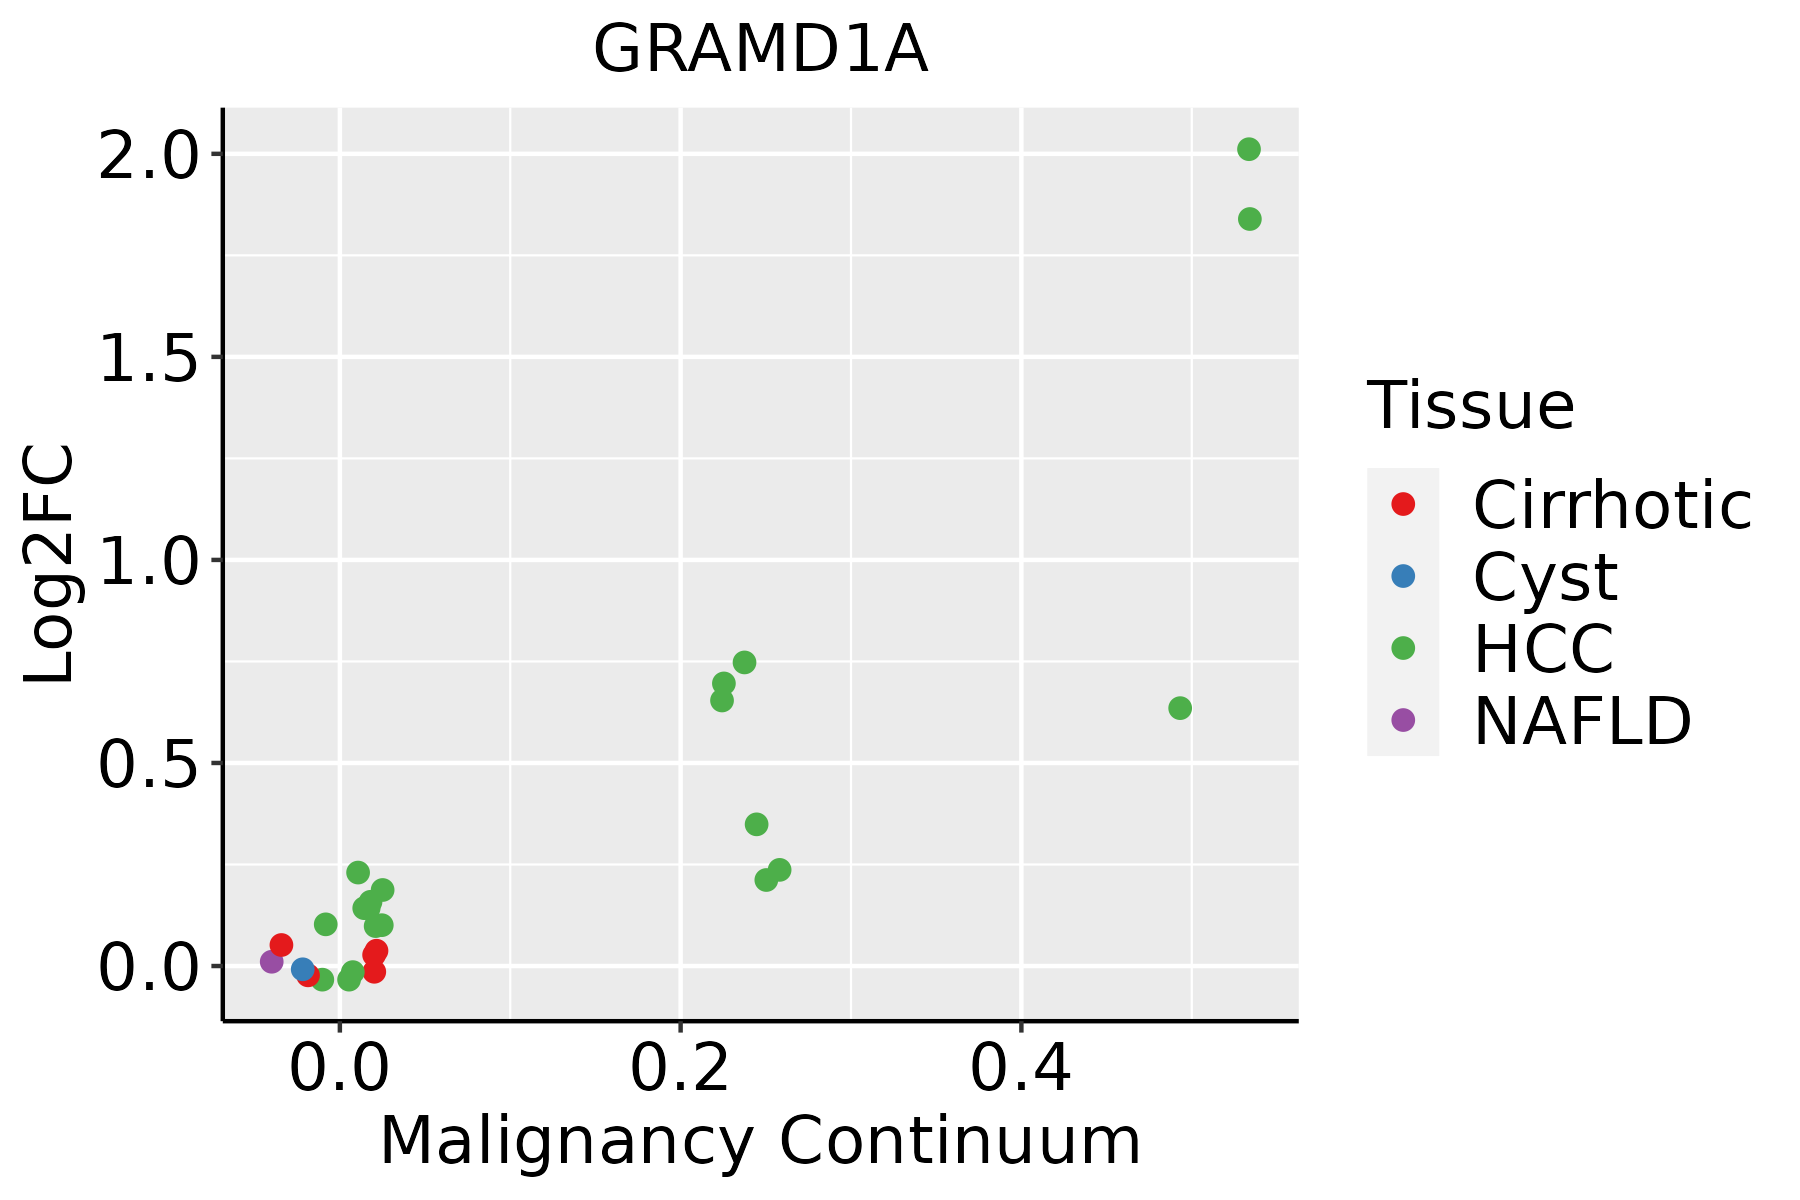 | HCC: Hepatocellular carcinoma |
| NAFLD: Non-alcoholic fatty liver disease | ||
| Oral Cavity | 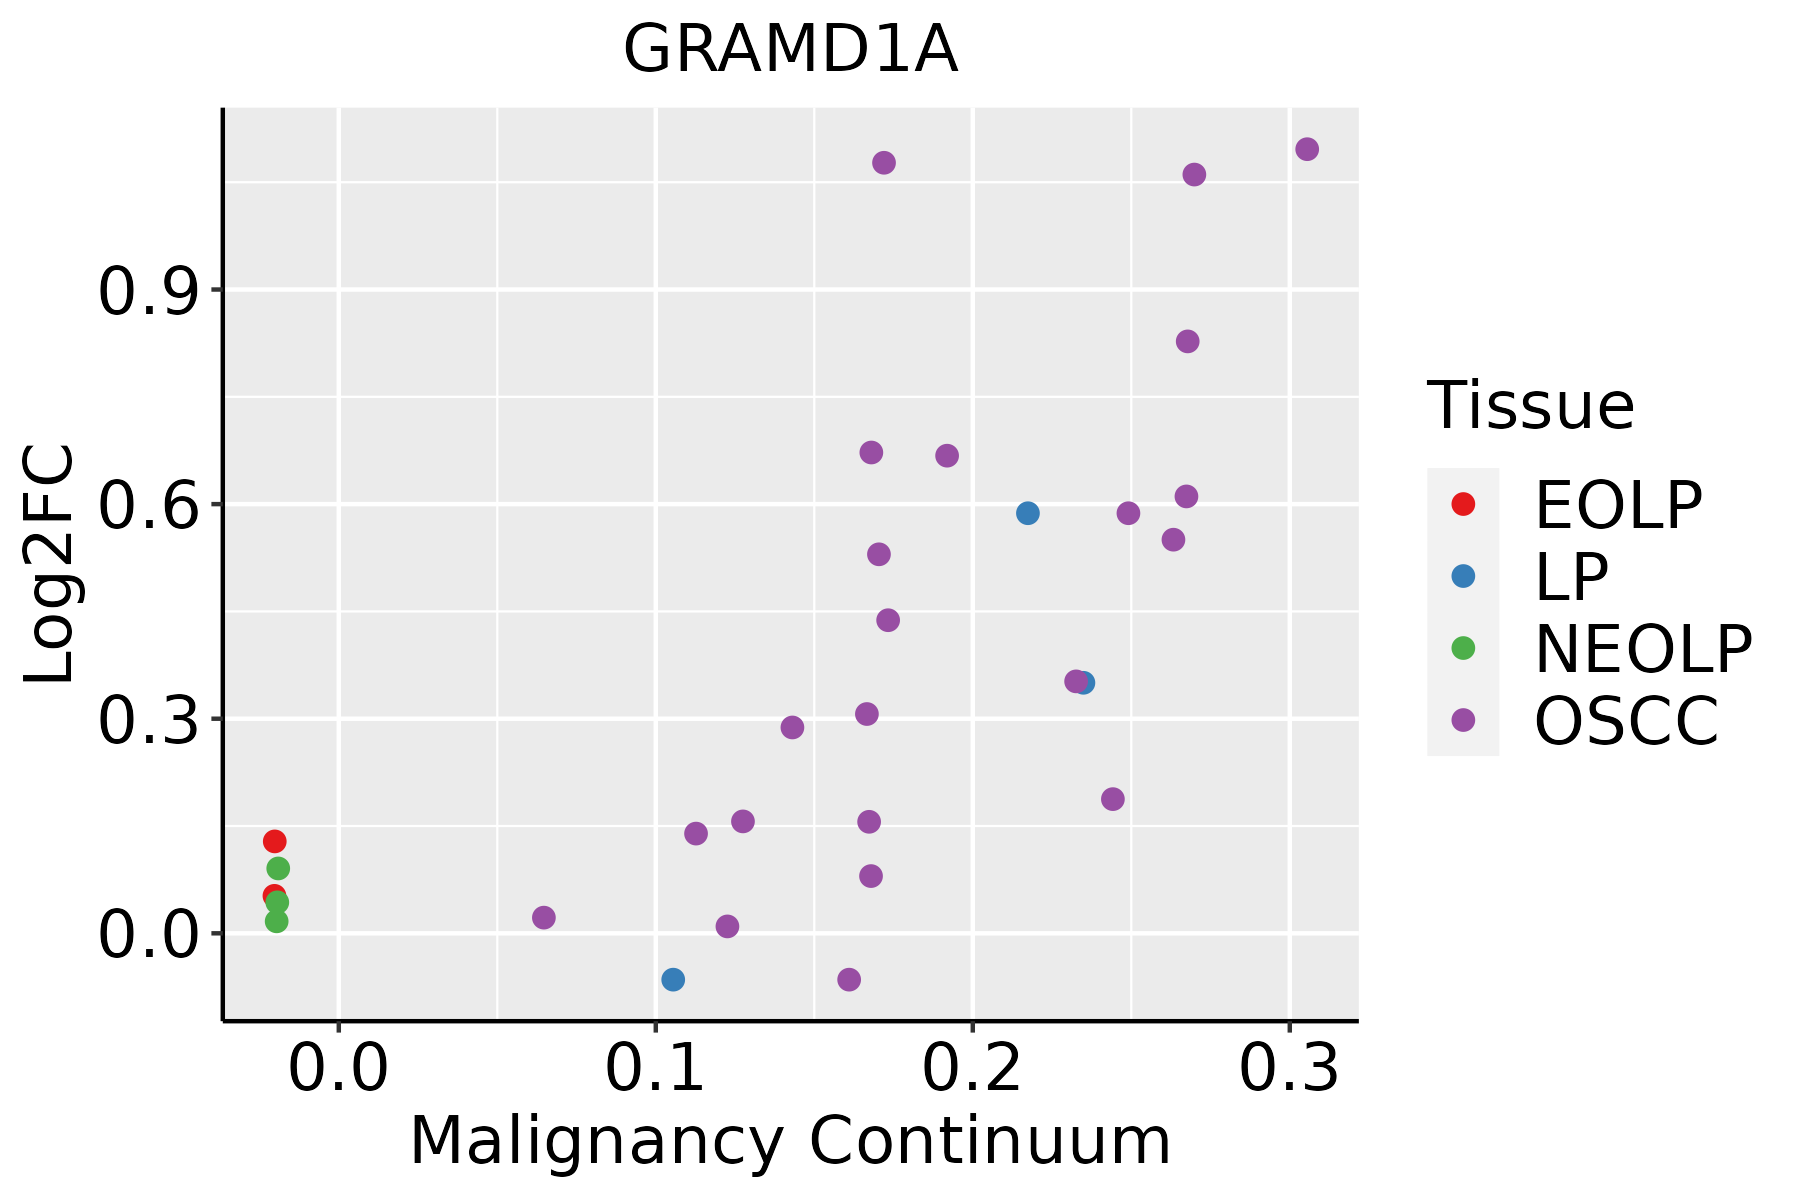 | EOLP: Erosive Oral lichen planus |
| LP: leukoplakia | ||
| NEOLP: Non-erosive oral lichen planus | ||
| OSCC: Oral squamous cell carcinoma | ||
| Thyroid | 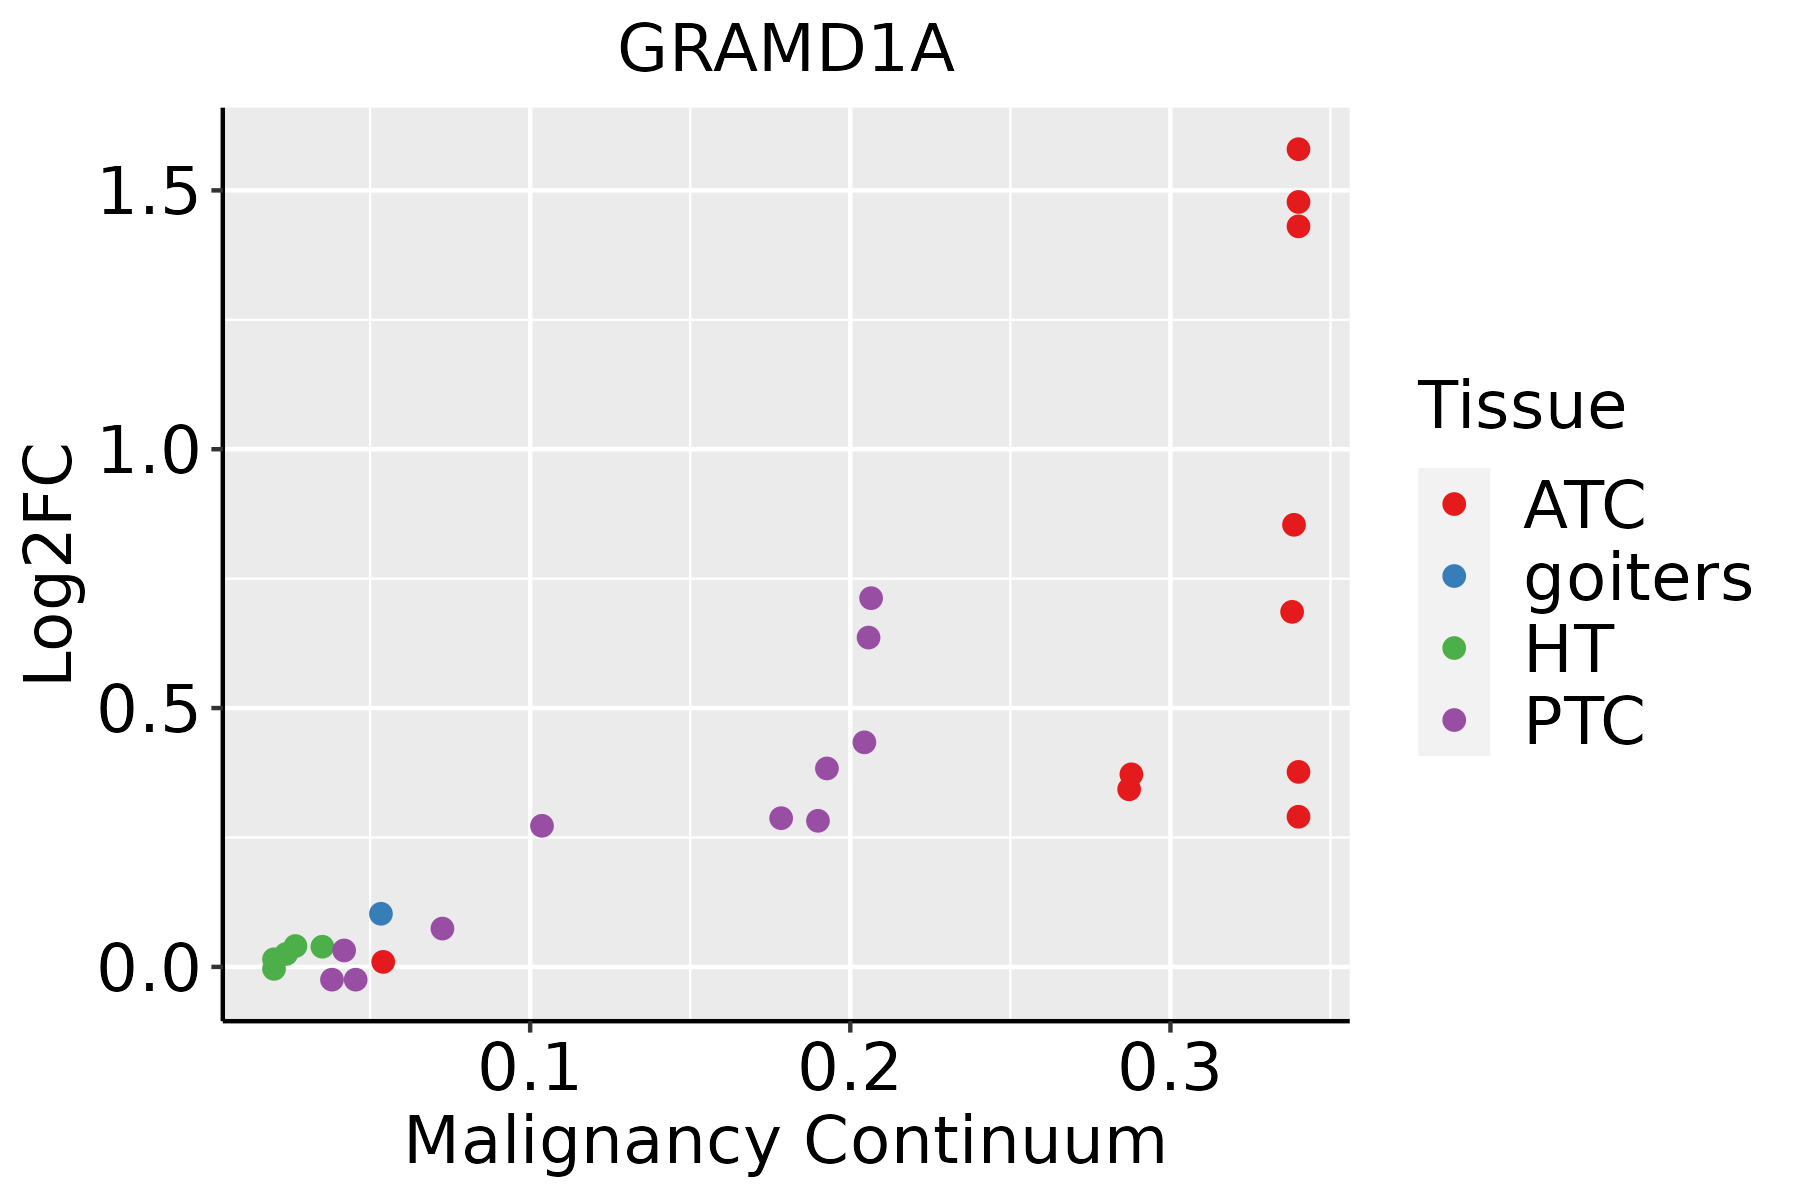 | ATC: Anaplastic thyroid cancer |
| HT: Hashimoto's thyroiditis | ||
| PTC: Papillary thyroid cancer |
| ∗log2FC in expression of this searched gene in stem-like cells from each diseased tissue sample relative to stem-like cells in normal samples in each tissue plotted against the malignancy continuum. Samples are colored based on if they are from different disease stage. |
Top |
Malignant transformation related pathway analysis |
| Find out the enriched GO biological processes and KEGG pathways involved in transition from healthy to precancer to cancer |
| Tissue | Disease Stage | Enriched GO biological Processes |
| Colorectum | AD |  |
| Colorectum | SER |  |
| Colorectum | MSS |  |
| Colorectum | MSI-H |  |
| Colorectum | FAP |  |
| ∗Top 15 enriched GO BP terms are showed in the bar plot of each disease state in each tissue. Each row represents a significant GO biological process which is colored according to the -log10(p.adjust). |
| Page: 1 2 3 4 5 6 7 8 9 |
| GO ID | Tissue | Disease Stage | Description | Gene Ratio | Bg Ratio | pvalue | p.adjust | Count |
| GO:0010876 | Colorectum | AD | lipid localization | 120/3918 | 448/18723 | 1.59e-03 | 1.33e-02 | 120 |
| GO:0006869 | Colorectum | AD | lipid transport | 108/3918 | 398/18723 | 1.67e-03 | 1.39e-02 | 108 |
| GO:0097305 | Colorectum | AD | response to alcohol | 71/3918 | 253/18723 | 4.01e-03 | 2.80e-02 | 71 |
| GO:00973051 | Colorectum | MSS | response to alcohol | 66/3467 | 253/18723 | 1.73e-03 | 1.54e-02 | 66 |
| GO:00108761 | Colorectum | MSS | lipid localization | 104/3467 | 448/18723 | 6.76e-03 | 4.38e-02 | 104 |
| GO:00068691 | Colorectum | FAP | lipid transport | 81/2622 | 398/18723 | 2.84e-04 | 3.76e-03 | 81 |
| GO:00973053 | Colorectum | FAP | response to alcohol | 55/2622 | 253/18723 | 5.05e-04 | 5.78e-03 | 55 |
| GO:0097306 | Colorectum | FAP | cellular response to alcohol | 25/2622 | 93/18723 | 7.87e-04 | 8.29e-03 | 25 |
| GO:00108762 | Colorectum | FAP | lipid localization | 85/2622 | 448/18723 | 1.92e-03 | 1.63e-02 | 85 |
| GO:0097305111 | Esophagus | ESCC | response to alcohol | 138/8552 | 253/18723 | 2.70e-03 | 1.14e-02 | 138 |
| GO:009730522 | Liver | HCC | response to alcohol | 138/7958 | 253/18723 | 6.91e-05 | 6.26e-04 | 138 |
| GO:001087621 | Liver | HCC | lipid localization | 228/7958 | 448/18723 | 1.80e-04 | 1.41e-03 | 228 |
| GO:01200092 | Liver | HCC | intermembrane lipid transfer | 33/7958 | 48/18723 | 2.12e-04 | 1.63e-03 | 33 |
| GO:000686921 | Liver | HCC | lipid transport | 198/7958 | 398/18723 | 1.92e-03 | 9.78e-03 | 198 |
| GO:00363141 | Liver | HCC | response to sterol | 24/7958 | 36/18723 | 2.95e-03 | 1.38e-02 | 24 |
| GO:00159182 | Liver | HCC | sterol transport | 71/7958 | 130/18723 | 3.49e-03 | 1.58e-02 | 71 |
| GO:0070723 | Liver | HCC | response to cholesterol | 20/7958 | 31/18723 | 1.11e-02 | 4.09e-02 | 20 |
| GO:009730519 | Oral cavity | OSCC | response to alcohol | 127/7305 | 253/18723 | 1.81e-04 | 1.24e-03 | 127 |
| GO:0097305110 | Oral cavity | LP | response to alcohol | 80/4623 | 253/18723 | 7.24e-03 | 4.05e-02 | 80 |
| GO:0097305113 | Thyroid | PTC | response to alcohol | 107/5968 | 253/18723 | 2.92e-04 | 2.07e-03 | 107 |
| Page: 1 2 |
| Pathway ID | Tissue | Disease Stage | Description | Gene Ratio | Bg Ratio | pvalue | p.adjust | qvalue | Count |
| Page: 1 |
Top |
Cell-cell communication analysis |
| Identification of potential cell-cell interactions between two cell types and their ligand-receptor pairs for different disease states |
| Ligand | Receptor | LRpair | Pathway | Tissue | Disease Stage |
| Page: 1 |
Top |
Single-cell gene regulatory network inference analysis |
| Find out the significant the regulons (TFs) and the target genes of each regulon across cell types for different disease states |
| TF | Cell Type | Tissue | Disease Stage | Target Gene | RSS | Regulon Activity |
| ∗The dot plots of a searched regulon are shown for all cell subpopulations in each disease state of each tissue based on the regulon specific score inferred using pySCENIC and by calculating the average expression. |
| Page: 1 |
Top |
Somatic mutation of malignant transformation related genes |
| Annotation of somatic variants for genes involved in malignant transformation |
| Hugo Symbol | Variant Class | Variant Classification | dbSNP RS | HGVSc | HGVSp | HGVSp Short | SWISSPROT | BIOTYPE | SIFT | PolyPhen | Tumor Sample Barcode | Tissue | Histology | Sex | Age | Stage | Therapy Types | Drugs | Outcome |
| GRAMD1A | SNV | Missense_Mutation | novel | c.1481N>G | p.Ser494Cys | p.S494C | Q96CP6 | protein_coding | deleterious(0) | probably_damaging(0.99) | TCGA-3C-AALI-01 | Breast | breast invasive carcinoma | Female | <65 | I/II | Unspecific | Poly E | Complete Response |
| GRAMD1A | SNV | Missense_Mutation | c.1534N>A | p.Glu512Lys | p.E512K | Q96CP6 | protein_coding | deleterious(0) | probably_damaging(0.968) | TCGA-A8-A09G-01 | Breast | breast invasive carcinoma | Female | >=65 | III/IV | Unknown | Unknown | SD | |
| GRAMD1A | SNV | Missense_Mutation | rs375746328 | c.1976N>T | p.Thr659Met | p.T659M | Q96CP6 | protein_coding | deleterious(0) | possibly_damaging(0.762) | TCGA-AC-A6IW-01 | Breast | breast invasive carcinoma | Female | >=65 | I/II | Unknown | Unknown | SD |
| GRAMD1A | SNV | Missense_Mutation | novel | c.689A>C | p.Tyr230Ser | p.Y230S | Q96CP6 | protein_coding | tolerated(0.07) | probably_damaging(0.994) | TCGA-BH-A203-01 | Breast | breast invasive carcinoma | Female | >=65 | I/II | Unknown | Unknown | PD |
| GRAMD1A | SNV | Missense_Mutation | c.382G>A | p.Glu128Lys | p.E128K | Q96CP6 | protein_coding | deleterious(0) | probably_damaging(0.996) | TCGA-IR-A3LH-01 | Cervix | cervical & endocervical cancer | Female | <65 | I/II | Chemotherapy | cisplatin | CR | |
| GRAMD1A | SNV | Missense_Mutation | novel | c.695N>T | p.Ser232Phe | p.S232F | Q96CP6 | protein_coding | deleterious(0.04) | benign(0.148) | TCGA-ZJ-AAXU-01 | Cervix | cervical & endocervical cancer | Female | <65 | I/II | Unknown | Unknown | SD |
| GRAMD1A | SNV | Missense_Mutation | rs769848875 | c.512N>T | p.Thr171Met | p.T171M | Q96CP6 | protein_coding | deleterious(0) | probably_damaging(0.997) | TCGA-AA-3492-01 | Colorectum | colon adenocarcinoma | Female | >=65 | I/II | Unknown | Unknown | SD |
| GRAMD1A | SNV | Missense_Mutation | novel | c.520N>A | p.Glu174Lys | p.E174K | Q96CP6 | protein_coding | deleterious(0) | possibly_damaging(0.881) | TCGA-AA-3950-01 | Colorectum | colon adenocarcinoma | Female | >=65 | I/II | Unknown | Unknown | SD |
| GRAMD1A | SNV | Missense_Mutation | rs754266755 | c.1526C>T | p.Ser509Leu | p.S509L | Q96CP6 | protein_coding | deleterious(0.02) | benign(0.117) | TCGA-AA-3984-01 | Colorectum | colon adenocarcinoma | Female | <65 | I/II | Unknown | Unknown | SD |
| GRAMD1A | SNV | Missense_Mutation | rs759830313 | c.1360N>A | p.Gly454Ser | p.G454S | Q96CP6 | protein_coding | tolerated(0.11) | benign(0.028) | TCGA-AA-A02R-01 | Colorectum | colon adenocarcinoma | Female | >=65 | I/II | Unknown | Unknown | PD |
| Page: 1 2 3 4 5 6 7 |
Top |
Related drugs of malignant transformation related genes |
| Identification of chemicals and drugs interact with genes involved in malignant transfromation |
| (DGIdb 4.0) |
| Entrez ID | Symbol | Category | Interaction Types | Drug Claim Name | Drug Name | PMIDs |
| Page: 1 |

Copyright 2023-Present -The University of Texas Health Science Center at Houston |