
|
|||||
|
 | |
| |
| |
| |
| |
| |
|
Gene: GPD1L |
Gene summary for GPD1L |
| Gene information | Species | Human | Gene symbol | GPD1L | Gene ID | 23171 |
| Gene name | glycerol-3-phosphate dehydrogenase 1 like | |
| Gene Alias | GPD1-L | |
| Cytomap | 3p22.3 | |
| Gene Type | protein-coding | GO ID | GO:0001508 | UniProtAcc | Q8N335 |
Top |
Malignant transformation analysis |
| Identification of the aberrant gene expression in precancerous and cancerous lesions by comparing the gene expression of stem-like cells in diseased tissues with normal stem cells |
| Entrez ID | Symbol | Replicates | Species | Organ | Tissue | Adj P-value | Log2FC | Malignancy |
| 23171 | GPD1L | A014-C-008 | Human | Colorectum | FAP | 5.18e-06 | -3.49e-01 | -0.191 |
| 23171 | GPD1L | A018-E-020 | Human | Colorectum | FAP | 1.51e-08 | -3.04e-01 | -0.2034 |
| 23171 | GPD1L | F034 | Human | Colorectum | FAP | 2.55e-14 | -2.64e-01 | -0.0665 |
| 23171 | GPD1L | F072B | Human | Colorectum | FAP | 2.35e-07 | -2.70e-01 | 0.257 |
| 23171 | GPD1L | CRC-1-8810 | Human | Colorectum | CRC | 4.40e-15 | -3.35e-01 | 0.6257 |
| 23171 | GPD1L | CRC-3-11773 | Human | Colorectum | CRC | 1.14e-09 | -2.87e-01 | 0.2564 |
| 23171 | GPD1L | HCC1_Meng | Human | Liver | HCC | 2.93e-02 | -8.17e-03 | 0.0246 |
| 23171 | GPD1L | HCC2_Meng | Human | Liver | HCC | 6.25e-03 | 3.81e-02 | 0.0107 |
| 23171 | GPD1L | HCC1 | Human | Liver | HCC | 5.10e-04 | 2.05e+00 | 0.5336 |
| 23171 | GPD1L | HCC2 | Human | Liver | HCC | 1.21e-05 | 1.69e+00 | 0.5341 |
| 23171 | GPD1L | S014 | Human | Liver | HCC | 9.31e-08 | 3.53e-01 | 0.2254 |
| 23171 | GPD1L | S015 | Human | Liver | HCC | 1.98e-08 | 3.38e-01 | 0.2375 |
| 23171 | GPD1L | S016 | Human | Liver | HCC | 7.55e-15 | 3.55e-01 | 0.2243 |
| 23171 | GPD1L | S027 | Human | Liver | HCC | 4.46e-04 | 2.39e-01 | 0.2446 |
| 23171 | GPD1L | S028 | Human | Liver | HCC | 2.27e-11 | 2.81e-01 | 0.2503 |
| 23171 | GPD1L | S029 | Human | Liver | HCC | 1.35e-11 | 3.30e-01 | 0.2581 |
| Page: 1 2 |
| Tissue | Expression Dynamics | Abbreviation |
| Colorectum (GSE201348) |  | FAP: Familial adenomatous polyposis |
| CRC: Colorectal cancer | ||
| Colorectum (HTA11) |  | AD: Adenomas |
| SER: Sessile serrated lesions | ||
| MSI-H: Microsatellite-high colorectal cancer | ||
| MSS: Microsatellite stable colorectal cancer | ||
| Liver | 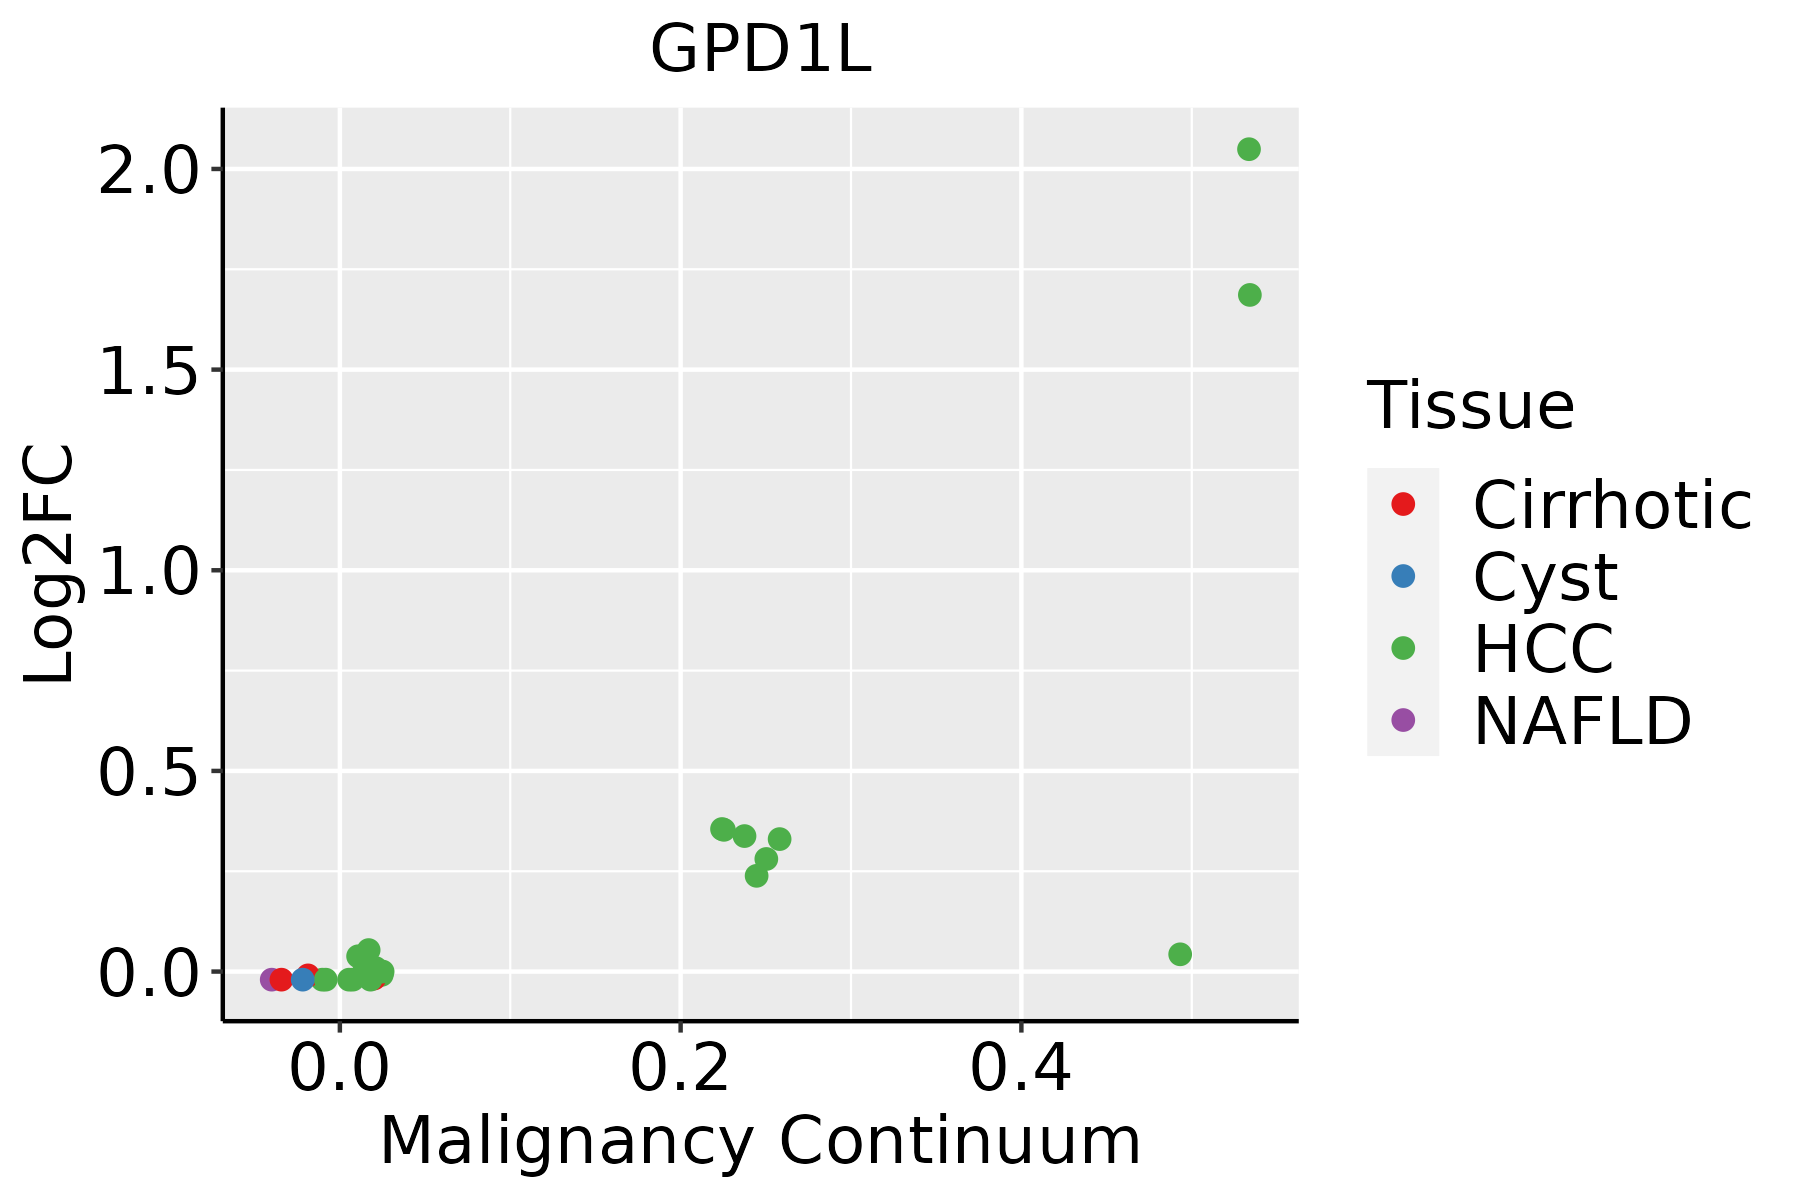 | HCC: Hepatocellular carcinoma |
| NAFLD: Non-alcoholic fatty liver disease |
| ∗log2FC in expression of this searched gene in stem-like cells from each diseased tissue sample relative to stem-like cells in normal samples in each tissue plotted against the malignancy continuum. Samples are colored based on if they are from different disease stage. |
Top |
Malignant transformation related pathway analysis |
| Find out the enriched GO biological processes and KEGG pathways involved in transition from healthy to precancer to cancer |
| Tissue | Disease Stage | Enriched GO biological Processes |
| Colorectum | AD |  |
| Colorectum | SER |  |
| Colorectum | MSS |  |
| Colorectum | MSI-H |  |
| Colorectum | FAP |  |
| ∗Top 15 enriched GO BP terms are showed in the bar plot of each disease state in each tissue. Each row represents a significant GO biological process which is colored according to the -log10(p.adjust). |
| Page: 1 2 3 4 5 6 7 8 9 |
| GO ID | Tissue | Disease Stage | Description | Gene Ratio | Bg Ratio | pvalue | p.adjust | Count |
| GO:1903829 | Colorectum | AD | positive regulation of cellular protein localization | 110/3918 | 276/18723 | 4.58e-13 | 8.44e-11 | 110 |
| GO:0010563 | Colorectum | AD | negative regulation of phosphorus metabolic process | 130/3918 | 442/18723 | 1.26e-05 | 2.76e-04 | 130 |
| GO:0045936 | Colorectum | AD | negative regulation of phosphate metabolic process | 129/3918 | 441/18723 | 1.81e-05 | 3.76e-04 | 129 |
| GO:0002028 | Colorectum | AD | regulation of sodium ion transport | 36/3918 | 90/18723 | 2.89e-05 | 5.37e-04 | 36 |
| GO:0042326 | Colorectum | AD | negative regulation of phosphorylation | 112/3918 | 385/18723 | 8.02e-05 | 1.27e-03 | 112 |
| GO:0001933 | Colorectum | AD | negative regulation of protein phosphorylation | 101/3918 | 342/18723 | 9.39e-05 | 1.42e-03 | 101 |
| GO:0030048 | Colorectum | AD | actin filament-based movement | 44/3918 | 127/18723 | 2.31e-04 | 2.99e-03 | 44 |
| GO:0010765 | Colorectum | AD | positive regulation of sodium ion transport | 17/3918 | 35/18723 | 2.48e-04 | 3.13e-03 | 17 |
| GO:1902305 | Colorectum | AD | regulation of sodium ion transmembrane transport | 27/3918 | 68/18723 | 3.19e-04 | 3.80e-03 | 27 |
| GO:0019674 | Colorectum | AD | NAD metabolic process | 15/3918 | 30/18723 | 3.85e-04 | 4.39e-03 | 15 |
| GO:2000649 | Colorectum | AD | regulation of sodium ion transmembrane transporter activity | 23/3918 | 58/18723 | 8.82e-04 | 8.53e-03 | 23 |
| GO:0018105 | Colorectum | AD | peptidyl-serine phosphorylation | 88/3918 | 315/18723 | 1.73e-03 | 1.43e-02 | 88 |
| GO:0018209 | Colorectum | AD | peptidyl-serine modification | 92/3918 | 338/18723 | 3.19e-03 | 2.36e-02 | 92 |
| GO:0034394 | Colorectum | AD | protein localization to cell surface | 24/3918 | 68/18723 | 4.33e-03 | 2.97e-02 | 24 |
| GO:19038292 | Colorectum | MSS | positive regulation of cellular protein localization | 103/3467 | 276/18723 | 1.12e-13 | 2.67e-11 | 103 |
| GO:00300482 | Colorectum | MSS | actin filament-based movement | 44/3467 | 127/18723 | 1.11e-05 | 2.64e-04 | 44 |
| GO:00105632 | Colorectum | MSS | negative regulation of phosphorus metabolic process | 118/3467 | 442/18723 | 1.18e-05 | 2.77e-04 | 118 |
| GO:00459362 | Colorectum | MSS | negative regulation of phosphate metabolic process | 117/3467 | 441/18723 | 1.74e-05 | 3.84e-04 | 117 |
| GO:00423262 | Colorectum | MSS | negative regulation of phosphorylation | 103/3467 | 385/18723 | 3.76e-05 | 7.17e-04 | 103 |
| GO:00019332 | Colorectum | MSS | negative regulation of protein phosphorylation | 93/3467 | 342/18723 | 4.54e-05 | 8.35e-04 | 93 |
| Page: 1 2 3 4 5 6 |
| Pathway ID | Tissue | Disease Stage | Description | Gene Ratio | Bg Ratio | pvalue | p.adjust | qvalue | Count |
| Page: 1 |
Top |
Cell-cell communication analysis |
| Identification of potential cell-cell interactions between two cell types and their ligand-receptor pairs for different disease states |
| Ligand | Receptor | LRpair | Pathway | Tissue | Disease Stage |
| Page: 1 |
Top |
Single-cell gene regulatory network inference analysis |
| Find out the significant the regulons (TFs) and the target genes of each regulon across cell types for different disease states |
| TF | Cell Type | Tissue | Disease Stage | Target Gene | RSS | Regulon Activity |
| ∗The dot plots of a searched regulon are shown for all cell subpopulations in each disease state of each tissue based on the regulon specific score inferred using pySCENIC and by calculating the average expression. |
| Page: 1 |
Top |
Somatic mutation of malignant transformation related genes |
| Annotation of somatic variants for genes involved in malignant transformation |
| Hugo Symbol | Variant Class | Variant Classification | dbSNP RS | HGVSc | HGVSp | HGVSp Short | SWISSPROT | BIOTYPE | SIFT | PolyPhen | Tumor Sample Barcode | Tissue | Histology | Sex | Age | Stage | Therapy Types | Drugs | Outcome |
| GPD1L | SNV | Missense_Mutation | novel | c.322N>G | p.Thr108Ala | p.T108A | Q8N335 | protein_coding | tolerated(0.25) | benign(0) | TCGA-A8-A0AB-01 | Breast | breast invasive carcinoma | Female | <65 | I/II | Chemotherapy | 5-fluorouracil | CR |
| GPD1L | insertion | Frame_Shift_Ins | novel | c.331_332insAGGGGGC | p.Val111GlufsTer28 | p.V111Efs*28 | Q8N335 | protein_coding | TCGA-A8-A094-01 | Breast | breast invasive carcinoma | Female | >=65 | I/II | Unknown | Unknown | SD | ||
| GPD1L | insertion | In_Frame_Ins | novel | c.333_334insGTGAGGTGGGAGAGCAACAGAGAGCAA | p.Val111_Pro112insValArgTrpGluSerAsnArgGluGln | p.V111_P112insVRWESNREQ | Q8N335 | protein_coding | TCGA-A8-A094-01 | Breast | breast invasive carcinoma | Female | >=65 | I/II | Unknown | Unknown | SD | ||
| GPD1L | insertion | Nonsense_Mutation | novel | c.323_324insCTTTTGCAGATAAGGCAGT | p.Gly109PhefsTer4 | p.G109Ffs*4 | Q8N335 | protein_coding | TCGA-A8-A0AB-01 | Breast | breast invasive carcinoma | Female | <65 | I/II | Chemotherapy | 5-fluorouracil | CR | ||
| GPD1L | insertion | Frame_Shift_Ins | novel | c.920_921insTGGAAATGATTGCTTTTGCC | p.Glu307AspfsTer100 | p.E307Dfs*100 | Q8N335 | protein_coding | TCGA-AN-A0FW-01 | Breast | breast invasive carcinoma | Female | >=65 | III/IV | Unknown | Unknown | SD | ||
| GPD1L | insertion | Frame_Shift_Ins | novel | c.922_923insGATC | p.Val308GlyfsTer48 | p.V308Gfs*48 | Q8N335 | protein_coding | TCGA-AN-A0FW-01 | Breast | breast invasive carcinoma | Female | >=65 | III/IV | Unknown | Unknown | SD | ||
| GPD1L | insertion | Frame_Shift_Ins | novel | c.268_269insA | p.Leu90HisfsTer16 | p.L90Hfs*16 | Q8N335 | protein_coding | TCGA-BH-A0B4-01 | Breast | breast invasive carcinoma | Male | >=65 | III/IV | Hormone Therapy | tamoxiphen | SD | ||
| GPD1L | insertion | Frame_Shift_Ins | novel | c.269_270insGGCCTTAGAAAGGGGCTGCCTGGCAGCAGGGACA | p.Leu91AlafsTer26 | p.L91Afs*26 | Q8N335 | protein_coding | TCGA-BH-A0B4-01 | Breast | breast invasive carcinoma | Male | >=65 | III/IV | Hormone Therapy | tamoxiphen | SD | ||
| GPD1L | insertion | In_Frame_Ins | novel | c.915_916insTCAATTTTGCCATCCACTCCCCTGGCCTGG | p.Ser305_Ala306insSerIleLeuProSerThrProLeuAlaTrp | p.S305_A306insSILPSTPLAW | Q8N335 | protein_coding | TCGA-E9-A1R2-01 | Breast | breast invasive carcinoma | Female | <65 | III/IV | Chemotherapy | taxotere | CR | ||
| GPD1L | SNV | Missense_Mutation | novel | c.96G>T | p.Gln32His | p.Q32H | Q8N335 | protein_coding | tolerated(0.24) | benign(0.157) | TCGA-EK-A2RL-01 | Cervix | cervical & endocervical cancer | Female | <65 | I/II | Chemotherapy | taxol | PD |
| Page: 1 2 3 4 5 |
Top |
Related drugs of malignant transformation related genes |
| Identification of chemicals and drugs interact with genes involved in malignant transfromation |
| (DGIdb 4.0) |
| Entrez ID | Symbol | Category | Interaction Types | Drug Claim Name | Drug Name | PMIDs |
| Page: 1 |

Copyright 2023-Present -The University of Texas Health Science Center at Houston |