
|
|||||
|
 | |
| |
| |
| |
| |
| |
|
Gene: GMFB |
Gene summary for GMFB |
| Gene information | Species | Human | Gene symbol | GMFB | Gene ID | 2764 |
| Gene name | glia maturation factor beta | |
| Gene Alias | GMF | |
| Cytomap | 14q22.2 | |
| Gene Type | protein-coding | GO ID | GO:0006464 | UniProtAcc | P60983 |
Top |
Malignant transformation analysis |
| Identification of the aberrant gene expression in precancerous and cancerous lesions by comparing the gene expression of stem-like cells in diseased tissues with normal stem cells |
| Entrez ID | Symbol | Replicates | Species | Organ | Tissue | Adj P-value | Log2FC | Malignancy |
| 2764 | GMFB | P24T-E | Human | Esophagus | ESCC | 1.88e-15 | 3.99e-01 | 0.1287 |
| 2764 | GMFB | P26T-E | Human | Esophagus | ESCC | 5.53e-49 | 9.73e-01 | 0.1276 |
| 2764 | GMFB | P27T-E | Human | Esophagus | ESCC | 1.44e-28 | 6.89e-01 | 0.1055 |
| 2764 | GMFB | P28T-E | Human | Esophagus | ESCC | 2.42e-15 | 2.67e-01 | 0.1149 |
| 2764 | GMFB | P30T-E | Human | Esophagus | ESCC | 7.48e-30 | 9.62e-01 | 0.137 |
| 2764 | GMFB | P31T-E | Human | Esophagus | ESCC | 1.27e-28 | 5.08e-01 | 0.1251 |
| 2764 | GMFB | P32T-E | Human | Esophagus | ESCC | 4.74e-22 | 4.38e-01 | 0.1666 |
| 2764 | GMFB | P36T-E | Human | Esophagus | ESCC | 1.90e-10 | 3.56e-01 | 0.1187 |
| 2764 | GMFB | P37T-E | Human | Esophagus | ESCC | 1.33e-18 | 5.99e-01 | 0.1371 |
| 2764 | GMFB | P38T-E | Human | Esophagus | ESCC | 8.96e-08 | 5.84e-01 | 0.127 |
| 2764 | GMFB | P39T-E | Human | Esophagus | ESCC | 1.58e-07 | 3.50e-02 | 0.0894 |
| 2764 | GMFB | P40T-E | Human | Esophagus | ESCC | 1.95e-07 | 2.50e-01 | 0.109 |
| 2764 | GMFB | P42T-E | Human | Esophagus | ESCC | 4.00e-15 | 2.93e-01 | 0.1175 |
| 2764 | GMFB | P44T-E | Human | Esophagus | ESCC | 3.34e-09 | 2.54e-01 | 0.1096 |
| 2764 | GMFB | P47T-E | Human | Esophagus | ESCC | 6.97e-13 | 3.06e-01 | 0.1067 |
| 2764 | GMFB | P48T-E | Human | Esophagus | ESCC | 9.23e-06 | 1.12e-01 | 0.0959 |
| 2764 | GMFB | P49T-E | Human | Esophagus | ESCC | 6.53e-16 | 1.74e+00 | 0.1768 |
| 2764 | GMFB | P52T-E | Human | Esophagus | ESCC | 3.00e-26 | 8.10e-01 | 0.1555 |
| 2764 | GMFB | P54T-E | Human | Esophagus | ESCC | 9.50e-08 | 3.16e-01 | 0.0975 |
| 2764 | GMFB | P57T-E | Human | Esophagus | ESCC | 3.16e-06 | 3.18e-01 | 0.0926 |
| Page: 1 2 3 4 5 |
| Tissue | Expression Dynamics | Abbreviation |
| Esophagus | 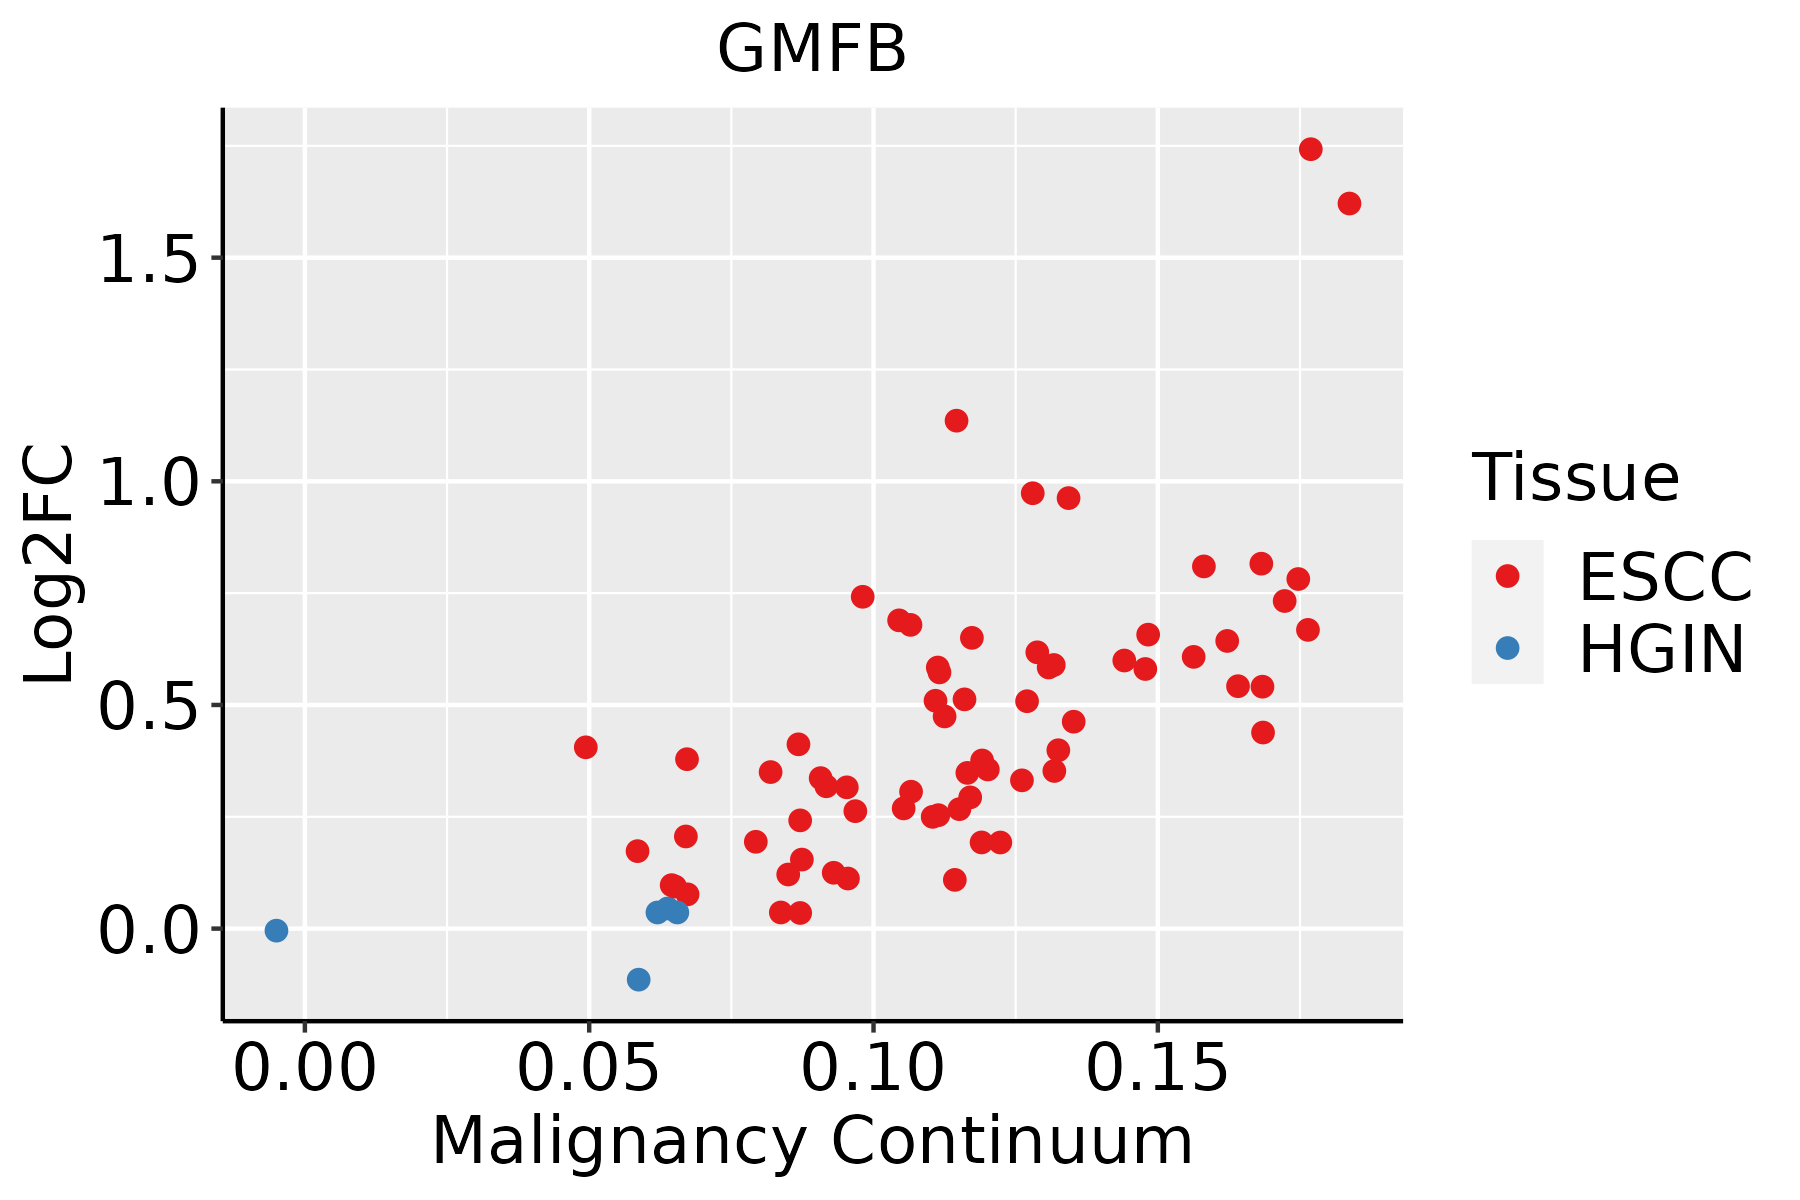 | ESCC: Esophageal squamous cell carcinoma |
| HGIN: High-grade intraepithelial neoplasias | ||
| LGIN: Low-grade intraepithelial neoplasias | ||
| Liver |  | HCC: Hepatocellular carcinoma |
| NAFLD: Non-alcoholic fatty liver disease | ||
| Oral Cavity | 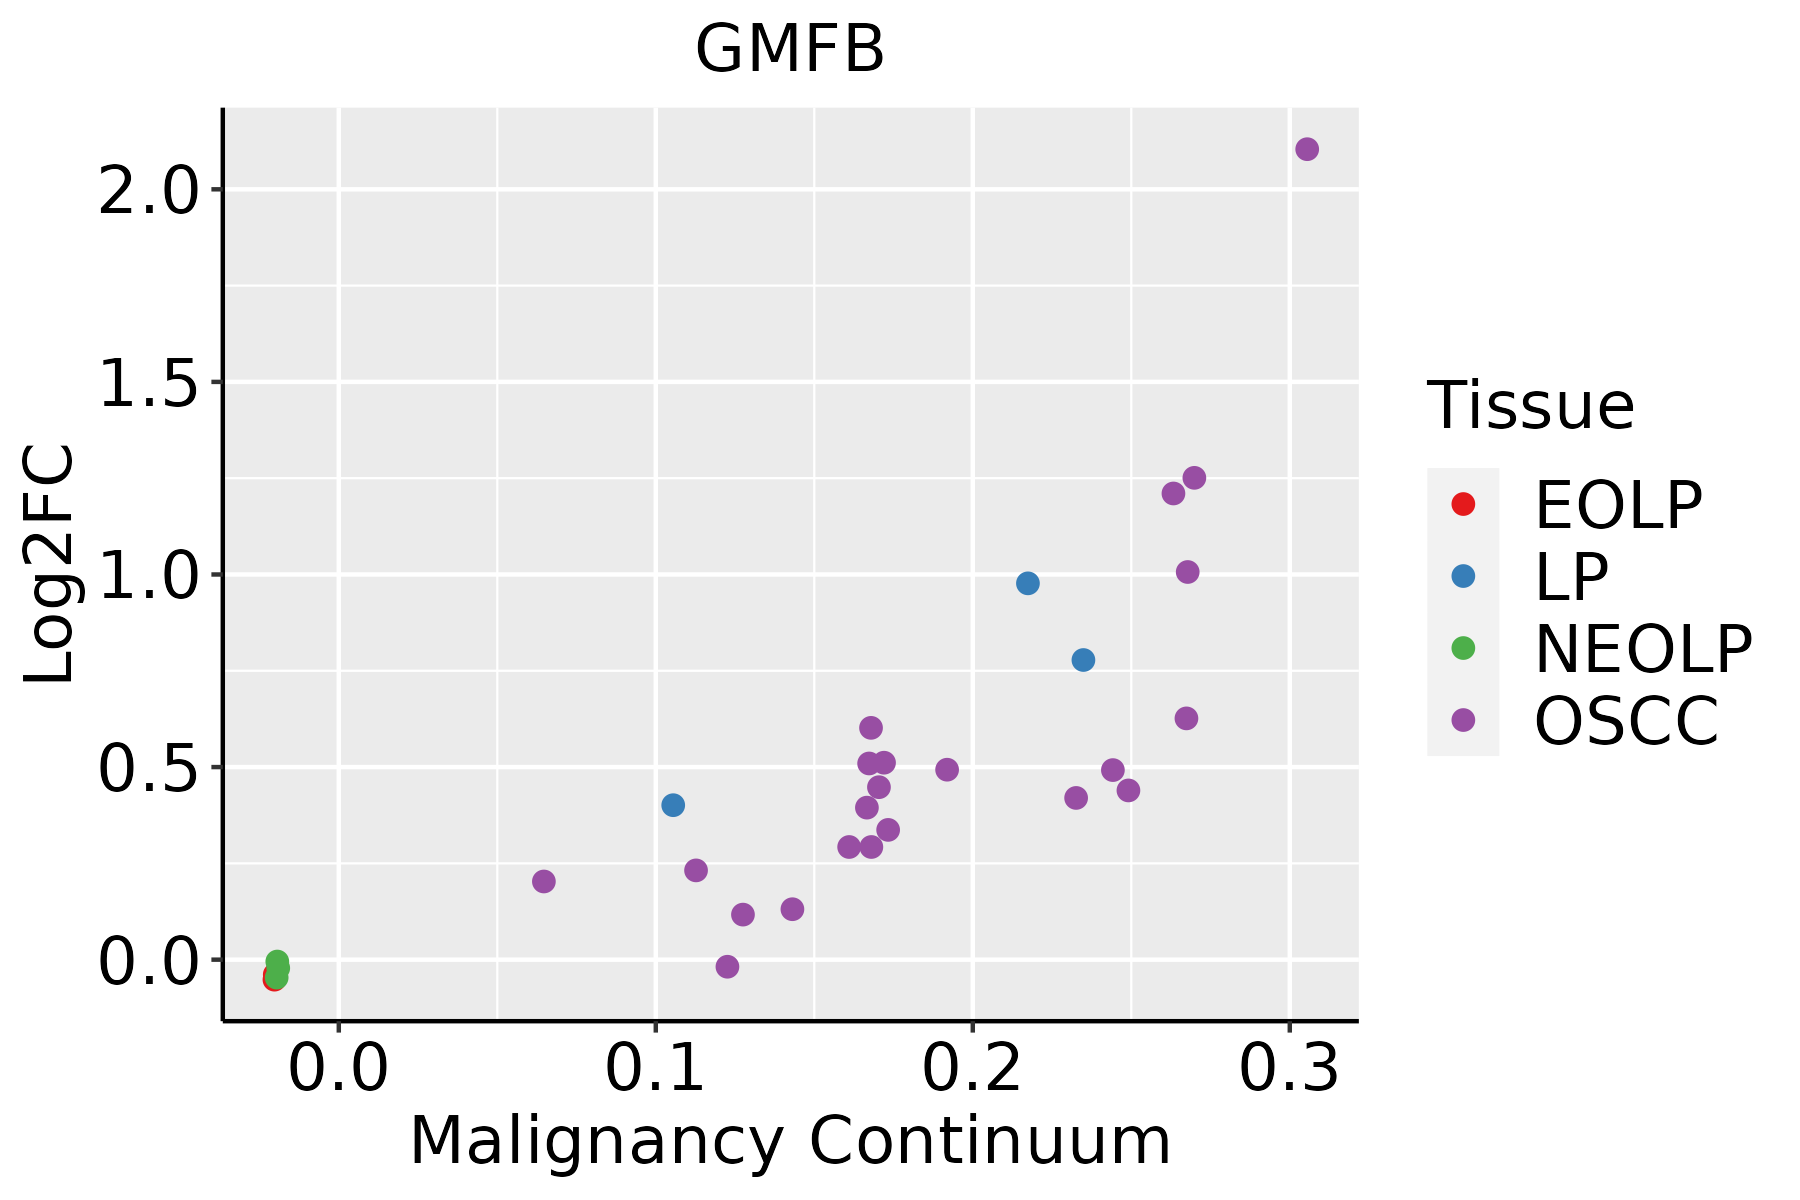 | EOLP: Erosive Oral lichen planus |
| LP: leukoplakia | ||
| NEOLP: Non-erosive oral lichen planus | ||
| OSCC: Oral squamous cell carcinoma | ||
| Skin |  | AK: Actinic keratosis |
| cSCC: Cutaneous squamous cell carcinoma | ||
| SCCIS:squamous cell carcinoma in situ |
| ∗log2FC in expression of this searched gene in stem-like cells from each diseased tissue sample relative to stem-like cells in normal samples in each tissue plotted against the malignancy continuum. Samples are colored based on if they are from different disease stage. |
Top |
Malignant transformation related pathway analysis |
| Find out the enriched GO biological processes and KEGG pathways involved in transition from healthy to precancer to cancer |
| Tissue | Disease Stage | Enriched GO biological Processes |
| Colorectum | AD |  |
| Colorectum | SER |  |
| Colorectum | MSS |  |
| Colorectum | MSI-H |  |
| Colorectum | FAP |  |
| ∗Top 15 enriched GO BP terms are showed in the bar plot of each disease state in each tissue. Each row represents a significant GO biological process which is colored according to the -log10(p.adjust). |
| Page: 1 2 3 4 5 6 7 8 9 |
| GO ID | Tissue | Disease Stage | Description | Gene Ratio | Bg Ratio | pvalue | p.adjust | Count |
| GO:0043254111 | Esophagus | ESCC | regulation of protein-containing complex assembly | 278/8552 | 428/18723 | 3.81e-16 | 2.77e-14 | 278 |
| GO:0031334111 | Esophagus | ESCC | positive regulation of protein-containing complex assembly | 166/8552 | 237/18723 | 2.06e-14 | 1.07e-12 | 166 |
| GO:1902905111 | Esophagus | ESCC | positive regulation of supramolecular fiber organization | 142/8552 | 209/18723 | 5.51e-11 | 1.76e-09 | 142 |
| GO:1902903111 | Esophagus | ESCC | regulation of supramolecular fiber organization | 237/8552 | 383/18723 | 9.06e-11 | 2.75e-09 | 237 |
| GO:0010639110 | Esophagus | ESCC | negative regulation of organelle organization | 215/8552 | 348/18723 | 8.20e-10 | 2.01e-08 | 215 |
| GO:005149520 | Esophagus | ESCC | positive regulation of cytoskeleton organization | 147/8552 | 226/18723 | 2.93e-09 | 6.38e-08 | 147 |
| GO:0051258111 | Esophagus | ESCC | protein polymerization | 183/8552 | 297/18723 | 1.94e-08 | 3.75e-07 | 183 |
| GO:000701527 | Esophagus | ESCC | actin filament organization | 259/8552 | 442/18723 | 2.37e-08 | 4.50e-07 | 259 |
| GO:0032273111 | Esophagus | ESCC | positive regulation of protein polymerization | 95/8552 | 138/18723 | 2.97e-08 | 5.57e-07 | 95 |
| GO:003253520 | Esophagus | ESCC | regulation of cellular component size | 227/8552 | 383/18723 | 4.77e-08 | 8.60e-07 | 227 |
| GO:0032970111 | Esophagus | ESCC | regulation of actin filament-based process | 231/8552 | 397/18723 | 2.91e-07 | 4.20e-06 | 231 |
| GO:0032956111 | Esophagus | ESCC | regulation of actin cytoskeleton organization | 210/8552 | 358/18723 | 4.40e-07 | 6.00e-06 | 210 |
| GO:0032271111 | Esophagus | ESCC | regulation of protein polymerization | 143/8552 | 233/18723 | 9.21e-07 | 1.17e-05 | 143 |
| GO:011005327 | Esophagus | ESCC | regulation of actin filament organization | 166/8552 | 278/18723 | 1.54e-06 | 1.85e-05 | 166 |
| GO:003083819 | Esophagus | ESCC | positive regulation of actin filament polymerization | 66/8552 | 99/18723 | 1.96e-05 | 1.72e-04 | 66 |
| GO:000815420 | Esophagus | ESCC | actin polymerization or depolymerization | 130/8552 | 218/18723 | 2.19e-05 | 1.88e-04 | 130 |
| GO:0030041110 | Esophagus | ESCC | actin filament polymerization | 114/8552 | 191/18723 | 6.46e-05 | 4.92e-04 | 114 |
| GO:000806419 | Esophagus | ESCC | regulation of actin polymerization or depolymerization | 112/8552 | 188/18723 | 8.31e-05 | 6.06e-04 | 112 |
| GO:003083218 | Esophagus | ESCC | regulation of actin filament length | 112/8552 | 189/18723 | 1.13e-04 | 7.85e-04 | 112 |
| GO:003083320 | Esophagus | ESCC | regulation of actin filament polymerization | 103/8552 | 172/18723 | 1.19e-04 | 8.15e-04 | 103 |
| Page: 1 2 3 4 5 6 7 8 |
| Pathway ID | Tissue | Disease Stage | Description | Gene Ratio | Bg Ratio | pvalue | p.adjust | qvalue | Count |
| Page: 1 |
Top |
Cell-cell communication analysis |
| Identification of potential cell-cell interactions between two cell types and their ligand-receptor pairs for different disease states |
| Ligand | Receptor | LRpair | Pathway | Tissue | Disease Stage |
| Page: 1 |
Top |
Single-cell gene regulatory network inference analysis |
| Find out the significant the regulons (TFs) and the target genes of each regulon across cell types for different disease states |
| TF | Cell Type | Tissue | Disease Stage | Target Gene | RSS | Regulon Activity |
| ∗The dot plots of a searched regulon are shown for all cell subpopulations in each disease state of each tissue based on the regulon specific score inferred using pySCENIC and by calculating the average expression. |
| Page: 1 |
Top |
Somatic mutation of malignant transformation related genes |
| Annotation of somatic variants for genes involved in malignant transformation |
| Hugo Symbol | Variant Class | Variant Classification | dbSNP RS | HGVSc | HGVSp | HGVSp Short | SWISSPROT | BIOTYPE | SIFT | PolyPhen | Tumor Sample Barcode | Tissue | Histology | Sex | Age | Stage | Therapy Types | Drugs | Outcome |
| GMFB | SNV | Missense_Mutation | novel | c.191N>A | p.Arg64Gln | p.R64Q | P60983 | protein_coding | tolerated(0.37) | benign(0.012) | TCGA-2W-A8YY-01 | Cervix | cervical & endocervical cancer | Female | <65 | I/II | Chemotherapy | cisplatin | CR |
| GMFB | SNV | Missense_Mutation | c.11N>A | p.Ser4Tyr | p.S4Y | P60983 | protein_coding | deleterious(0) | possibly_damaging(0.847) | TCGA-AA-A010-01 | Colorectum | colon adenocarcinoma | Female | <65 | I/II | Chemotherapy | folinic | CR | |
| GMFB | SNV | Missense_Mutation | novel | c.239G>T | p.Gly80Val | p.G80V | P60983 | protein_coding | deleterious(0) | probably_damaging(0.999) | TCGA-AG-A002-01 | Colorectum | rectum adenocarcinoma | Male | <65 | I/II | Unknown | Unknown | SD |
| GMFB | SNV | Missense_Mutation | c.199N>T | p.Arg67Cys | p.R67C | P60983 | protein_coding | deleterious(0) | probably_damaging(0.994) | TCGA-F5-6814-01 | Colorectum | rectum adenocarcinoma | Male | <65 | I/II | Unknown | Unknown | SD | |
| GMFB | SNV | Missense_Mutation | novel | c.359T>C | p.Val120Ala | p.V120A | P60983 | protein_coding | tolerated(0.06) | possibly_damaging(0.587) | TCGA-A5-A0G2-01 | Endometrium | uterine corpus endometrioid carcinoma | Female | <65 | III/IV | Unknown | Unknown | SD |
| GMFB | SNV | Missense_Mutation | novel | c.166G>A | p.Glu56Lys | p.E56K | P60983 | protein_coding | deleterious(0.03) | benign(0.06) | TCGA-A5-A0G2-01 | Endometrium | uterine corpus endometrioid carcinoma | Female | <65 | III/IV | Unknown | Unknown | SD |
| GMFB | SNV | Missense_Mutation | rs752098440 | c.121C>T | p.Arg41Cys | p.R41C | P60983 | protein_coding | deleterious(0) | possibly_damaging(0.695) | TCGA-A5-A0G2-01 | Endometrium | uterine corpus endometrioid carcinoma | Female | <65 | III/IV | Unknown | Unknown | SD |
| GMFB | SNV | Missense_Mutation | novel | c.35N>G | p.Glu12Gly | p.E12G | P60983 | protein_coding | tolerated(0.09) | benign(0) | TCGA-AJ-A3EL-01 | Endometrium | uterine corpus endometrioid carcinoma | Female | <65 | I/II | Unknown | Unknown | SD |
| GMFB | SNV | Missense_Mutation | rs752098440 | c.121N>T | p.Arg41Cys | p.R41C | P60983 | protein_coding | deleterious(0) | possibly_damaging(0.695) | TCGA-AJ-A8CT-01 | Endometrium | uterine corpus endometrioid carcinoma | Female | <65 | I/II | Unknown | Unknown | SD |
| GMFB | SNV | Missense_Mutation | rs771198764 | c.65N>A | p.Arg22His | p.R22H | P60983 | protein_coding | deleterious(0) | probably_damaging(0.997) | TCGA-AP-A0LT-01 | Endometrium | uterine corpus endometrioid carcinoma | Female | <65 | I/II | Unknown | Unknown | SD |
| Page: 1 2 3 |
Top |
Related drugs of malignant transformation related genes |
| Identification of chemicals and drugs interact with genes involved in malignant transfromation |
| (DGIdb 4.0) |
| Entrez ID | Symbol | Category | Interaction Types | Drug Claim Name | Drug Name | PMIDs |
| Page: 1 |

Copyright 2023-Present -The University of Texas Health Science Center at Houston |