
|
|||||
|
 | |
| |
| |
| |
| |
| |
|
Gene: GCSH |
Gene summary for GCSH |
| Gene information | Species | Human | Gene symbol | GCSH | Gene ID | 2653 |
| Gene name | glycine cleavage system protein H | |
| Gene Alias | GCE | |
| Cytomap | 16q23.2 | |
| Gene Type | protein-coding | GO ID | GO:0006082 | UniProtAcc | P23434 |
Top |
Malignant transformation analysis |
| Identification of the aberrant gene expression in precancerous and cancerous lesions by comparing the gene expression of stem-like cells in diseased tissues with normal stem cells |
| Entrez ID | Symbol | Replicates | Species | Organ | Tissue | Adj P-value | Log2FC | Malignancy |
| 2653 | GCSH | LZE2T | Human | Esophagus | ESCC | 2.10e-09 | 1.38e+00 | 0.082 |
| 2653 | GCSH | LZE3D | Human | Esophagus | HGIN | 3.04e-03 | 1.03e+00 | 0.0668 |
| 2653 | GCSH | LZE4T | Human | Esophagus | ESCC | 3.57e-25 | 9.40e-01 | 0.0811 |
| 2653 | GCSH | LZE5T | Human | Esophagus | ESCC | 2.27e-09 | 6.79e-01 | 0.0514 |
| 2653 | GCSH | LZE7T | Human | Esophagus | ESCC | 5.62e-11 | 6.22e-01 | 0.0667 |
| 2653 | GCSH | LZE20T | Human | Esophagus | ESCC | 3.66e-07 | 4.80e-01 | 0.0662 |
| 2653 | GCSH | LZE22D1 | Human | Esophagus | HGIN | 2.51e-02 | 4.36e-01 | 0.0595 |
| 2653 | GCSH | LZE22T | Human | Esophagus | ESCC | 1.67e-09 | 9.63e-01 | 0.068 |
| 2653 | GCSH | LZE24T | Human | Esophagus | ESCC | 2.67e-33 | 8.65e-01 | 0.0596 |
| 2653 | GCSH | LZE21T | Human | Esophagus | ESCC | 7.51e-11 | 6.55e-01 | 0.0655 |
| 2653 | GCSH | P1T-E | Human | Esophagus | ESCC | 9.78e-16 | 9.95e-01 | 0.0875 |
| 2653 | GCSH | P2T-E | Human | Esophagus | ESCC | 4.73e-44 | 8.27e-01 | 0.1177 |
| 2653 | GCSH | P4T-E | Human | Esophagus | ESCC | 4.83e-68 | 1.96e+00 | 0.1323 |
| 2653 | GCSH | P5T-E | Human | Esophagus | ESCC | 6.41e-72 | 1.40e+00 | 0.1327 |
| 2653 | GCSH | P8T-E | Human | Esophagus | ESCC | 3.08e-38 | 8.09e-01 | 0.0889 |
| 2653 | GCSH | P9T-E | Human | Esophagus | ESCC | 4.00e-27 | 7.45e-01 | 0.1131 |
| 2653 | GCSH | P10T-E | Human | Esophagus | ESCC | 1.16e-73 | 1.22e+00 | 0.116 |
| 2653 | GCSH | P11T-E | Human | Esophagus | ESCC | 1.83e-26 | 1.14e+00 | 0.1426 |
| 2653 | GCSH | P12T-E | Human | Esophagus | ESCC | 1.52e-65 | 1.18e+00 | 0.1122 |
| 2653 | GCSH | P15T-E | Human | Esophagus | ESCC | 5.68e-65 | 1.51e+00 | 0.1149 |
| Page: 1 2 3 4 5 6 7 8 |
| Tissue | Expression Dynamics | Abbreviation |
| Endometrium | 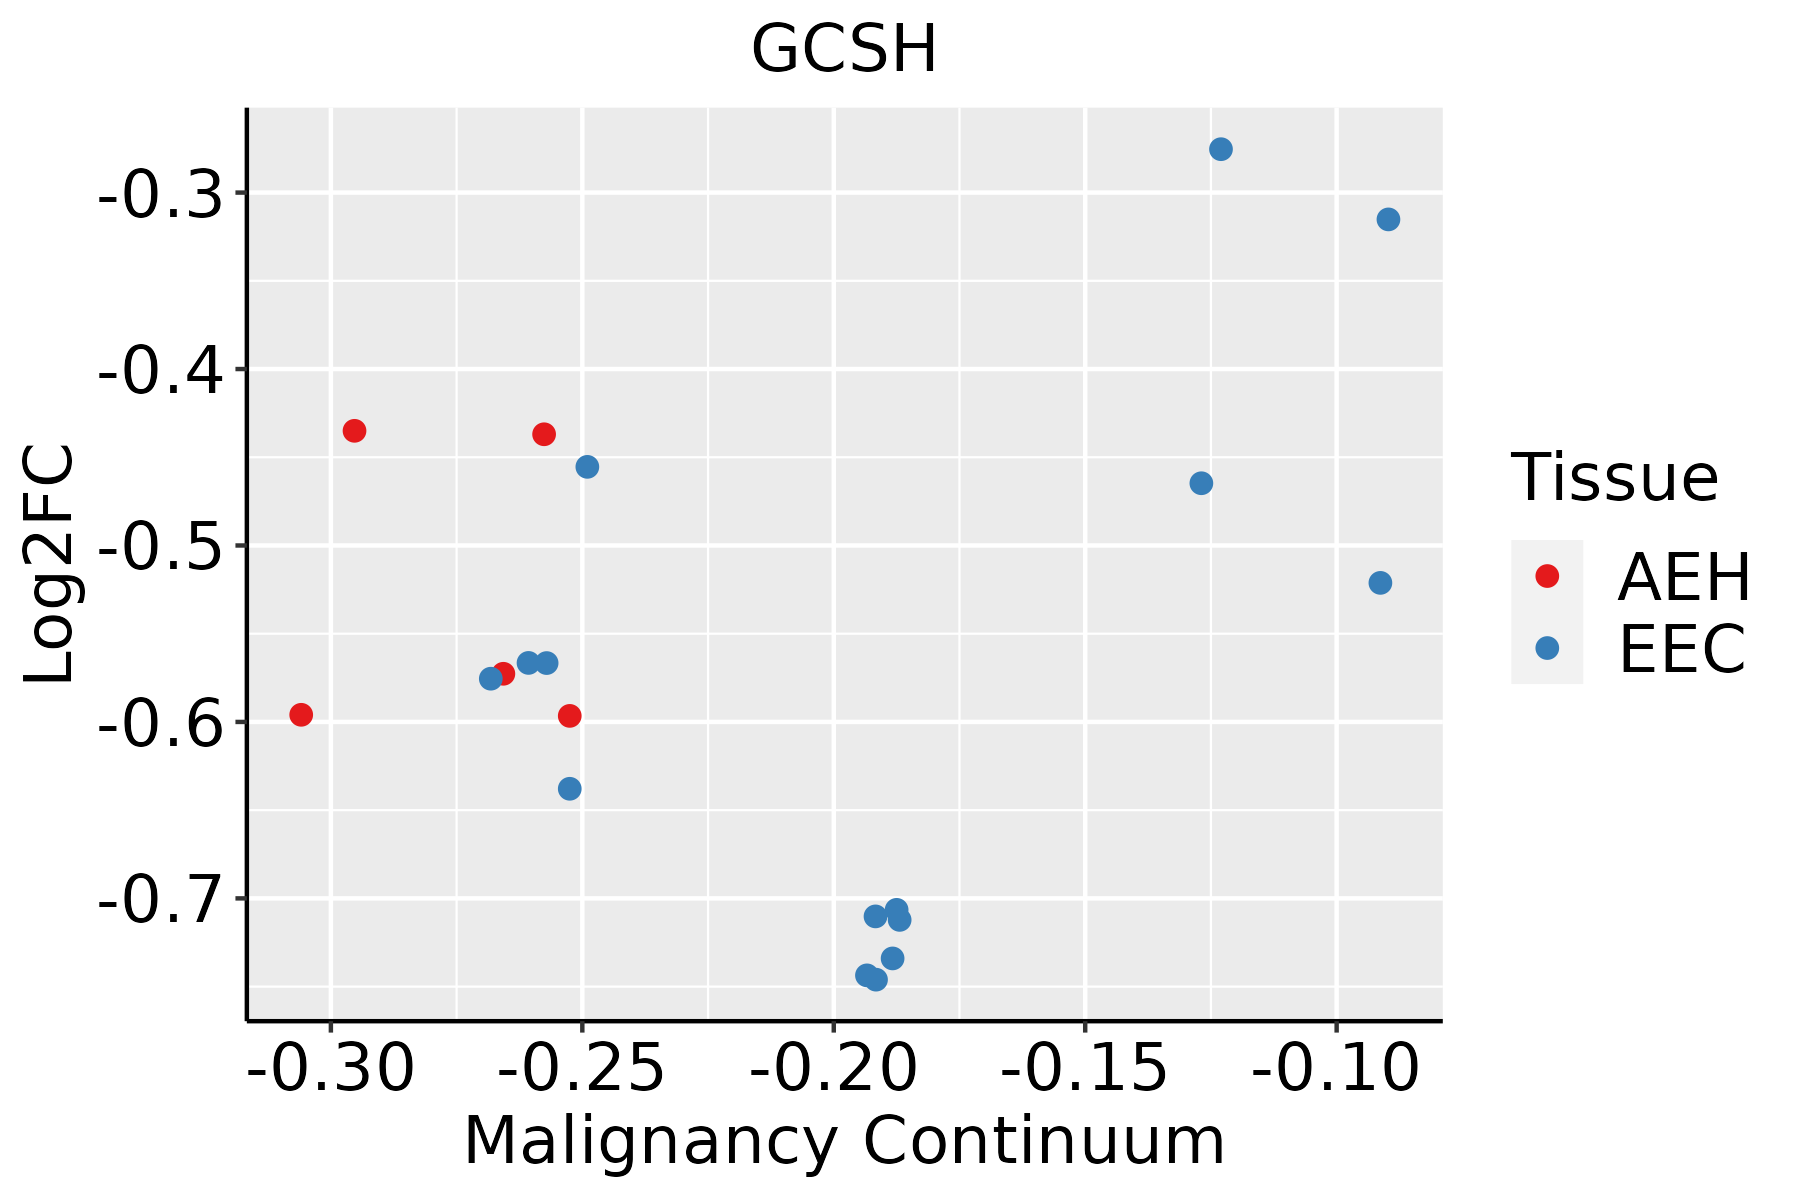 | AEH: Atypical endometrial hyperplasia |
| EEC: Endometrioid Cancer | ||
| Esophagus | 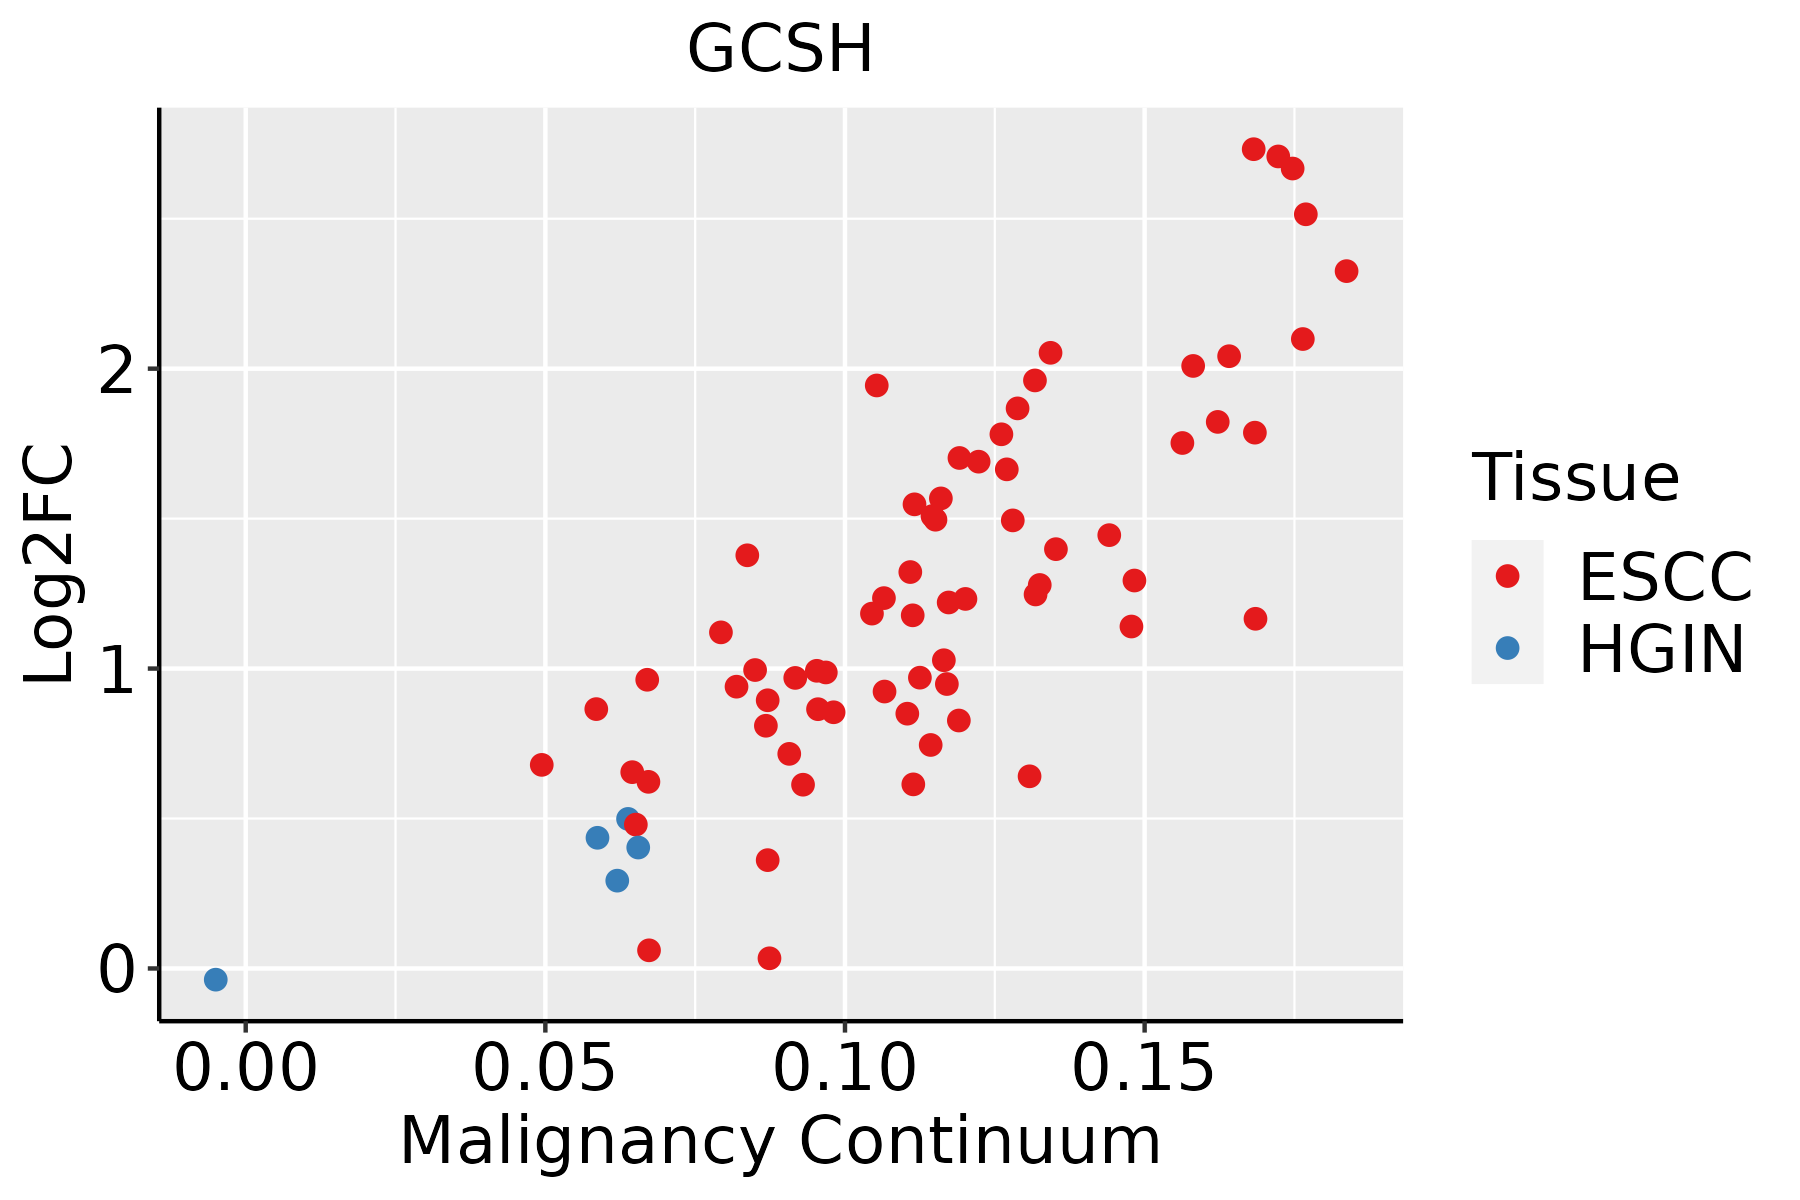 | ESCC: Esophageal squamous cell carcinoma |
| HGIN: High-grade intraepithelial neoplasias | ||
| LGIN: Low-grade intraepithelial neoplasias | ||
| Liver |  | HCC: Hepatocellular carcinoma |
| NAFLD: Non-alcoholic fatty liver disease | ||
| Oral Cavity | 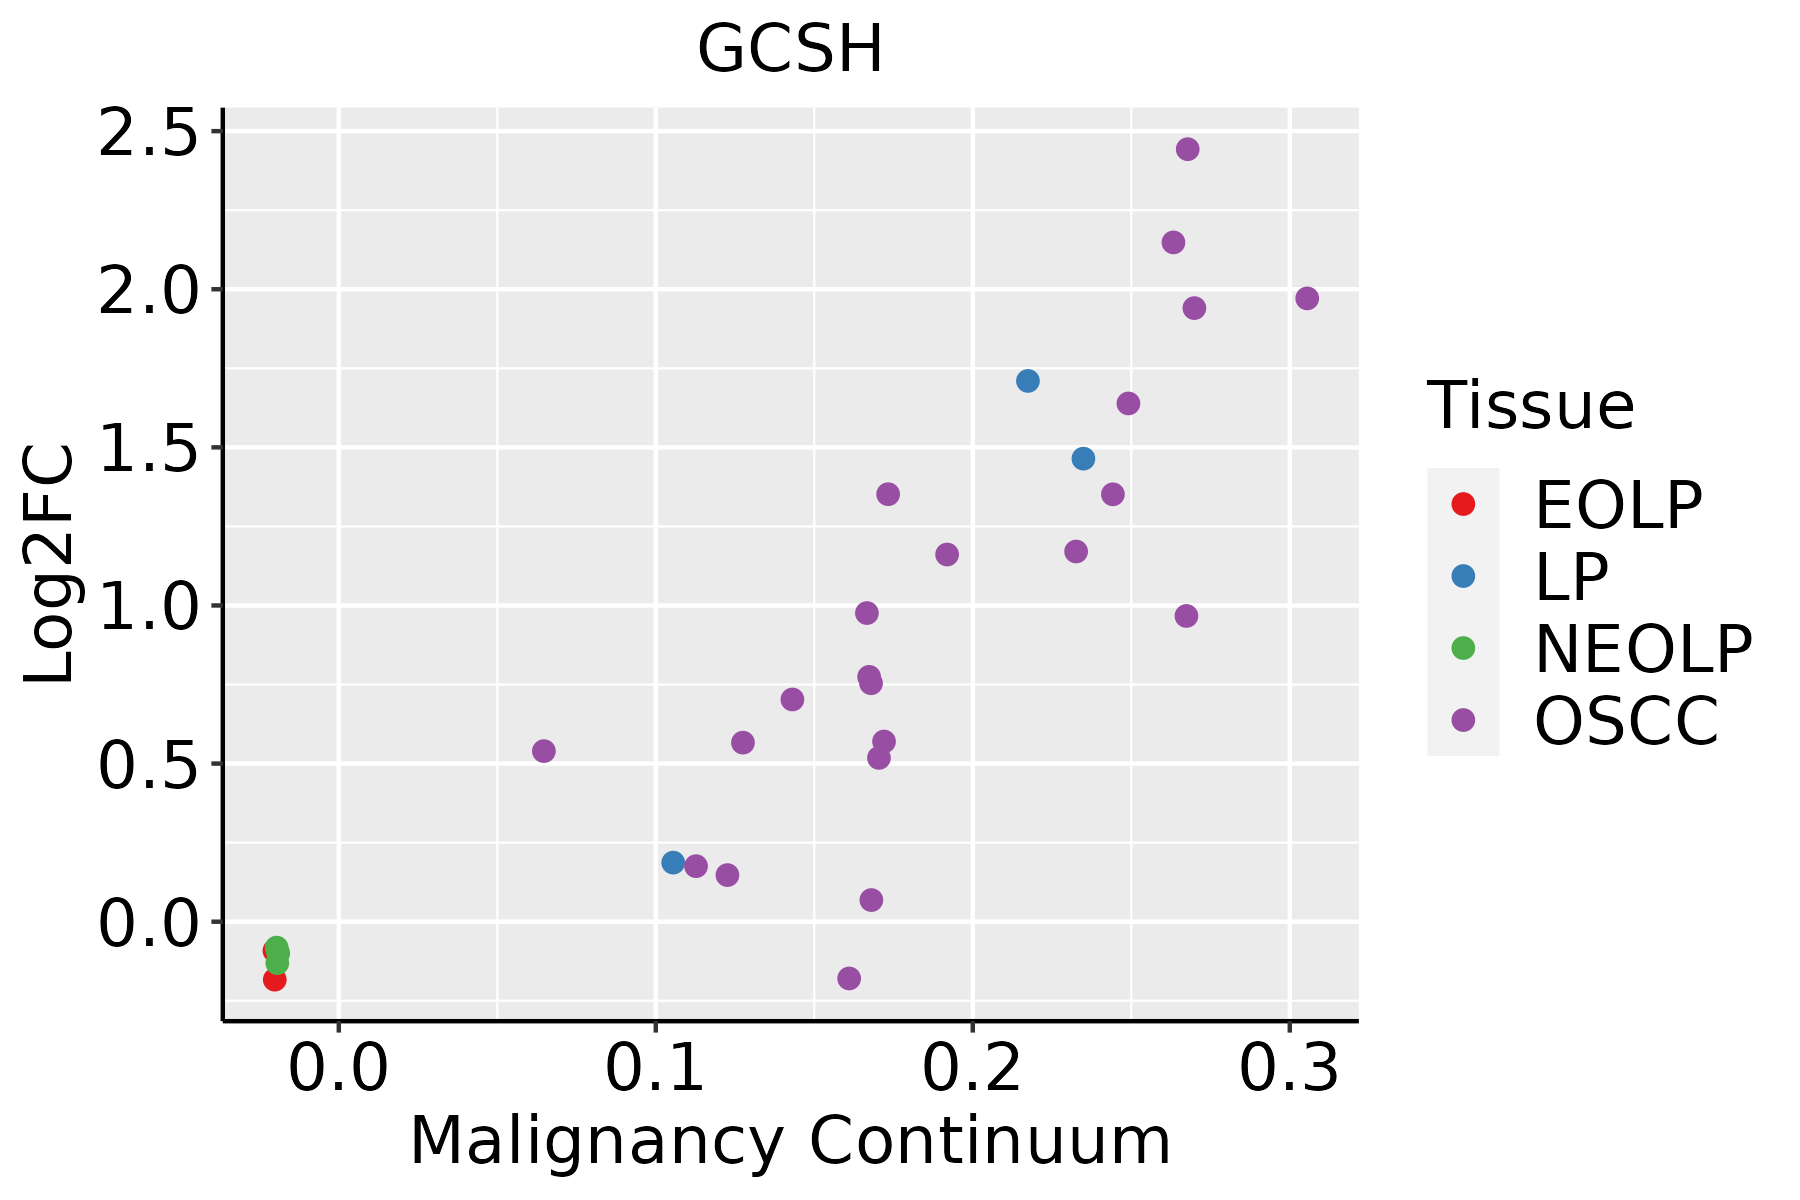 | EOLP: Erosive Oral lichen planus |
| LP: leukoplakia | ||
| NEOLP: Non-erosive oral lichen planus | ||
| OSCC: Oral squamous cell carcinoma | ||
| Prostate |  | BPH: Benign Prostatic Hyperplasia |
| Skin | 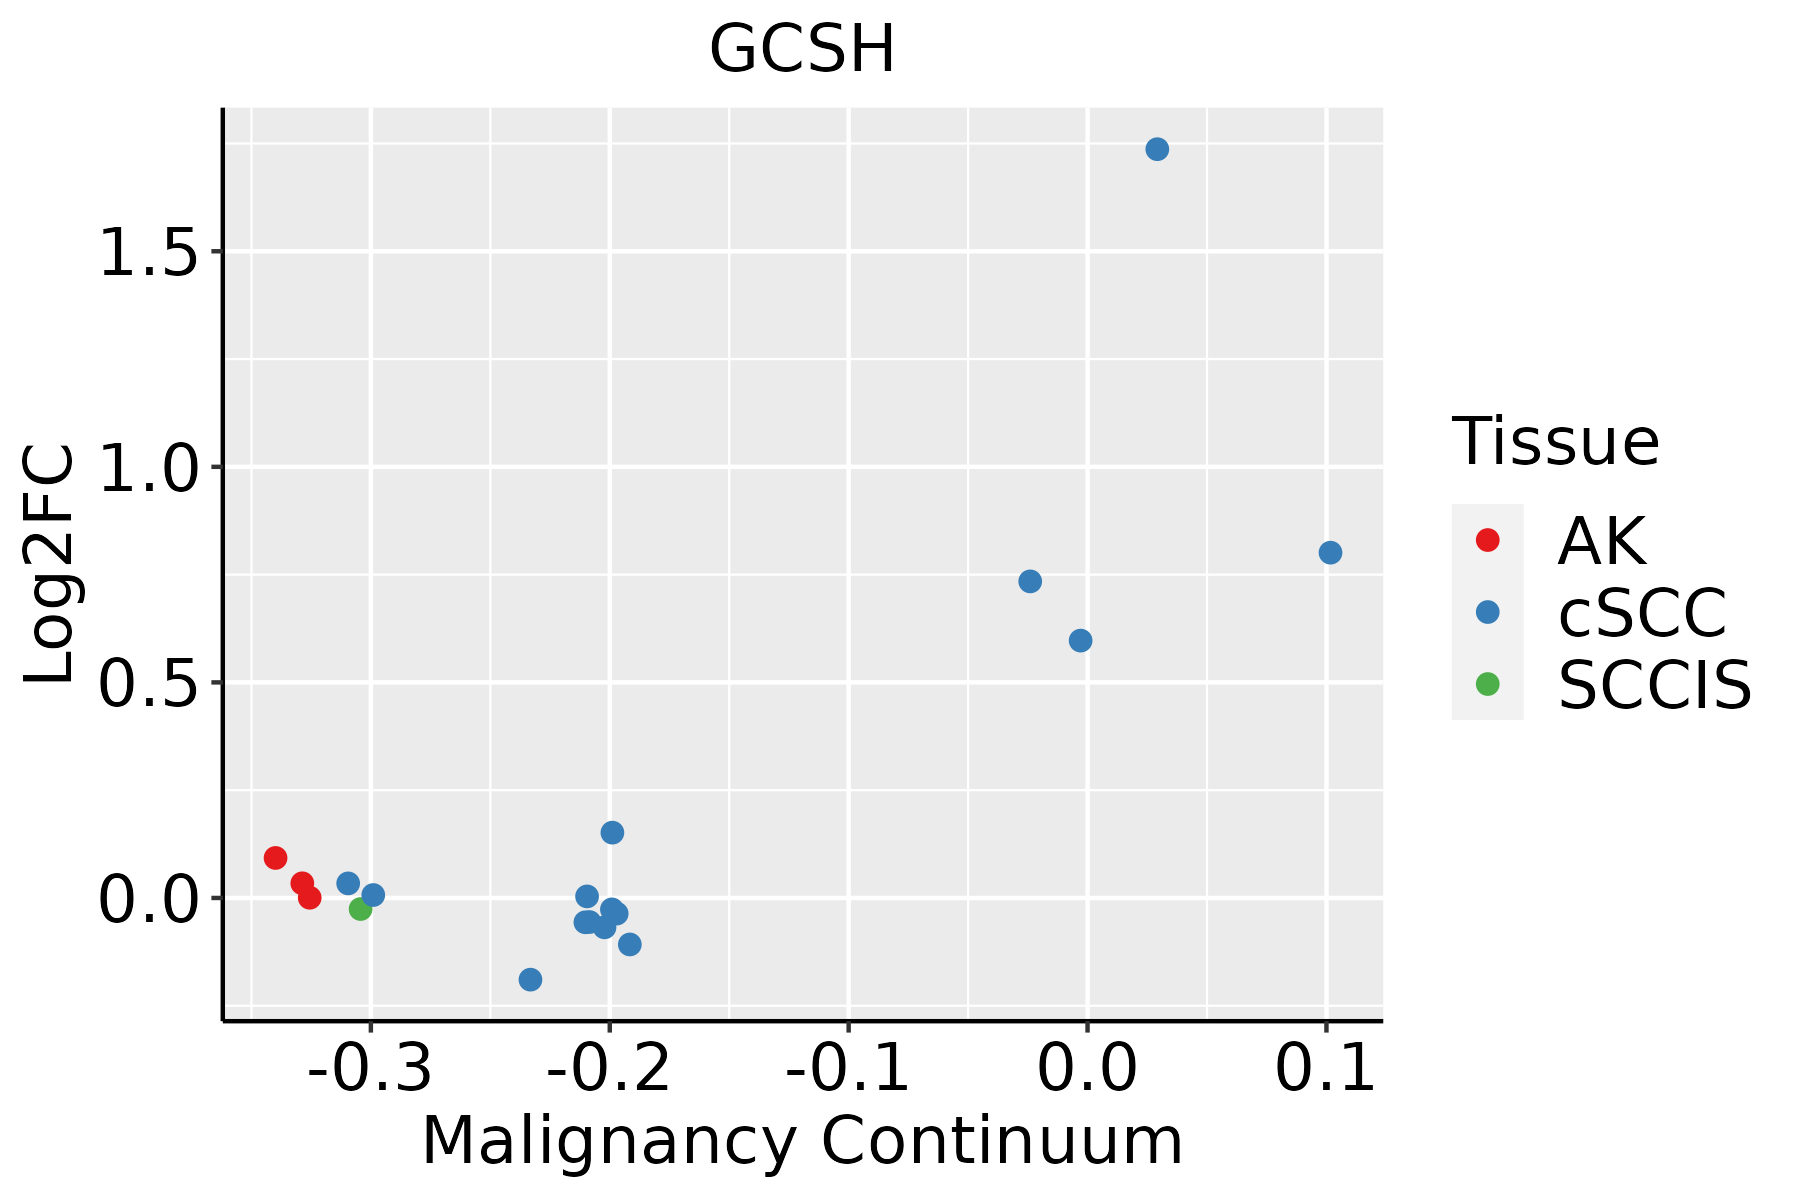 | AK: Actinic keratosis |
| cSCC: Cutaneous squamous cell carcinoma | ||
| SCCIS:squamous cell carcinoma in situ | ||
| Thyroid |  | ATC: Anaplastic thyroid cancer |
| HT: Hashimoto's thyroiditis | ||
| PTC: Papillary thyroid cancer |
| ∗log2FC in expression of this searched gene in stem-like cells from each diseased tissue sample relative to stem-like cells in normal samples in each tissue plotted against the malignancy continuum. Samples are colored based on if they are from different disease stage. |
Top |
Malignant transformation related pathway analysis |
| Find out the enriched GO biological processes and KEGG pathways involved in transition from healthy to precancer to cancer |
| Tissue | Disease Stage | Enriched GO biological Processes |
| Colorectum | AD |  |
| Colorectum | SER |  |
| Colorectum | MSS |  |
| Colorectum | MSI-H |  |
| Colorectum | FAP |  |
| ∗Top 15 enriched GO BP terms are showed in the bar plot of each disease state in each tissue. Each row represents a significant GO biological process which is colored according to the -log10(p.adjust). |
| Page: 1 2 3 4 5 6 7 8 9 |
| GO ID | Tissue | Disease Stage | Description | Gene Ratio | Bg Ratio | pvalue | p.adjust | Count |
| GO:00182057 | Esophagus | HGIN | peptidyl-lysine modification | 88/2587 | 376/18723 | 2.99e-07 | 1.39e-05 | 88 |
| GO:005160417 | Esophagus | HGIN | protein maturation | 68/2587 | 294/18723 | 9.77e-06 | 2.86e-04 | 68 |
| GO:001820514 | Esophagus | ESCC | peptidyl-lysine modification | 259/8552 | 376/18723 | 3.90e-20 | 5.26e-18 | 259 |
| GO:005160418 | Esophagus | ESCC | protein maturation | 189/8552 | 294/18723 | 7.64e-11 | 2.39e-09 | 189 |
| GO:00442827 | Esophagus | ESCC | small molecule catabolic process | 201/8552 | 376/18723 | 1.35e-03 | 6.41e-03 | 201 |
| GO:004428211 | Liver | Cirrhotic | small molecule catabolic process | 151/4634 | 376/18723 | 2.20e-11 | 1.34e-09 | 151 |
| GO:001605411 | Liver | Cirrhotic | organic acid catabolic process | 104/4634 | 240/18723 | 1.91e-10 | 9.53e-09 | 104 |
| GO:004639511 | Liver | Cirrhotic | carboxylic acid catabolic process | 102/4634 | 236/18723 | 3.41e-10 | 1.63e-08 | 102 |
| GO:00516046 | Liver | Cirrhotic | protein maturation | 121/4634 | 294/18723 | 3.54e-10 | 1.68e-08 | 121 |
| GO:19016051 | Liver | Cirrhotic | alpha-amino acid metabolic process | 82/4634 | 195/18723 | 7.72e-08 | 2.30e-06 | 82 |
| GO:00182051 | Liver | Cirrhotic | peptidyl-lysine modification | 134/4634 | 376/18723 | 1.29e-06 | 2.59e-05 | 134 |
| GO:00090631 | Liver | Cirrhotic | cellular amino acid catabolic process | 49/4634 | 110/18723 | 4.47e-06 | 7.42e-05 | 49 |
| GO:000652011 | Liver | Cirrhotic | cellular amino acid metabolic process | 103/4634 | 284/18723 | 8.88e-06 | 1.30e-04 | 103 |
| GO:00090691 | Liver | Cirrhotic | serine family amino acid metabolic process | 22/4634 | 40/18723 | 4.04e-05 | 4.82e-04 | 22 |
| GO:19016061 | Liver | Cirrhotic | alpha-amino acid catabolic process | 36/4634 | 87/18723 | 4.69e-04 | 3.78e-03 | 36 |
| GO:0006544 | Liver | Cirrhotic | glycine metabolic process | 10/4634 | 16/18723 | 1.51e-03 | 9.91e-03 | 10 |
| GO:0009071 | Liver | Cirrhotic | serine family amino acid catabolic process | 8/4634 | 14/18723 | 9.65e-03 | 4.35e-02 | 8 |
| GO:00182052 | Liver | HCC | peptidyl-lysine modification | 230/7958 | 376/18723 | 1.51e-13 | 8.32e-12 | 230 |
| GO:004428221 | Liver | HCC | small molecule catabolic process | 225/7958 | 376/18723 | 6.50e-12 | 2.80e-10 | 225 |
| GO:001605421 | Liver | HCC | organic acid catabolic process | 152/7958 | 240/18723 | 5.11e-11 | 1.92e-09 | 152 |
| Page: 1 2 3 |
| Pathway ID | Tissue | Disease Stage | Description | Gene Ratio | Bg Ratio | pvalue | p.adjust | qvalue | Count |
| hsa0120016 | Esophagus | HGIN | Carbon metabolism | 31/1383 | 115/8465 | 2.51e-03 | 2.10e-02 | 1.67e-02 | 31 |
| hsa0120017 | Esophagus | HGIN | Carbon metabolism | 31/1383 | 115/8465 | 2.51e-03 | 2.10e-02 | 1.67e-02 | 31 |
| hsa0120023 | Esophagus | ESCC | Carbon metabolism | 79/4205 | 115/8465 | 2.50e-05 | 1.21e-04 | 6.22e-05 | 79 |
| hsa006306 | Esophagus | ESCC | Glyoxylate and dicarboxylate metabolism | 21/4205 | 30/8465 | 1.95e-02 | 4.35e-02 | 2.23e-02 | 21 |
| hsa0120033 | Esophagus | ESCC | Carbon metabolism | 79/4205 | 115/8465 | 2.50e-05 | 1.21e-04 | 6.22e-05 | 79 |
| hsa0063013 | Esophagus | ESCC | Glyoxylate and dicarboxylate metabolism | 21/4205 | 30/8465 | 1.95e-02 | 4.35e-02 | 2.23e-02 | 21 |
| hsa0120021 | Liver | Cirrhotic | Carbon metabolism | 64/2530 | 115/8465 | 6.37e-09 | 1.18e-07 | 7.26e-08 | 64 |
| hsa006304 | Liver | Cirrhotic | Glyoxylate and dicarboxylate metabolism | 20/2530 | 30/8465 | 3.36e-05 | 2.54e-04 | 1.57e-04 | 20 |
| hsa00260 | Liver | Cirrhotic | Glycine, serine and threonine metabolism | 22/2530 | 40/8465 | 7.85e-04 | 4.51e-03 | 2.78e-03 | 22 |
| hsa0120031 | Liver | Cirrhotic | Carbon metabolism | 64/2530 | 115/8465 | 6.37e-09 | 1.18e-07 | 7.26e-08 | 64 |
| hsa0063011 | Liver | Cirrhotic | Glyoxylate and dicarboxylate metabolism | 20/2530 | 30/8465 | 3.36e-05 | 2.54e-04 | 1.57e-04 | 20 |
| hsa002601 | Liver | Cirrhotic | Glycine, serine and threonine metabolism | 22/2530 | 40/8465 | 7.85e-04 | 4.51e-03 | 2.78e-03 | 22 |
| hsa0120041 | Liver | HCC | Carbon metabolism | 89/4020 | 115/8465 | 3.92e-11 | 6.56e-10 | 3.65e-10 | 89 |
| hsa0063021 | Liver | HCC | Glyoxylate and dicarboxylate metabolism | 24/4020 | 30/8465 | 2.66e-04 | 1.24e-03 | 6.88e-04 | 24 |
| hsa002602 | Liver | HCC | Glycine, serine and threonine metabolism | 28/4020 | 40/8465 | 3.28e-03 | 1.07e-02 | 5.93e-03 | 28 |
| hsa00785 | Liver | HCC | Lipoic acid metabolism | 14/4020 | 19/8465 | 1.89e-02 | 4.40e-02 | 2.45e-02 | 14 |
| hsa0120051 | Liver | HCC | Carbon metabolism | 89/4020 | 115/8465 | 3.92e-11 | 6.56e-10 | 3.65e-10 | 89 |
| hsa0063031 | Liver | HCC | Glyoxylate and dicarboxylate metabolism | 24/4020 | 30/8465 | 2.66e-04 | 1.24e-03 | 6.88e-04 | 24 |
| hsa002603 | Liver | HCC | Glycine, serine and threonine metabolism | 28/4020 | 40/8465 | 3.28e-03 | 1.07e-02 | 5.93e-03 | 28 |
| hsa007851 | Liver | HCC | Lipoic acid metabolism | 14/4020 | 19/8465 | 1.89e-02 | 4.40e-02 | 2.45e-02 | 14 |
| Page: 1 2 |
Top |
Cell-cell communication analysis |
| Identification of potential cell-cell interactions between two cell types and their ligand-receptor pairs for different disease states |
| Ligand | Receptor | LRpair | Pathway | Tissue | Disease Stage |
| Page: 1 |
Top |
Single-cell gene regulatory network inference analysis |
| Find out the significant the regulons (TFs) and the target genes of each regulon across cell types for different disease states |
| TF | Cell Type | Tissue | Disease Stage | Target Gene | RSS | Regulon Activity |
| ∗The dot plots of a searched regulon are shown for all cell subpopulations in each disease state of each tissue based on the regulon specific score inferred using pySCENIC and by calculating the average expression. |
| Page: 1 |
Top |
Somatic mutation of malignant transformation related genes |
| Annotation of somatic variants for genes involved in malignant transformation |
| Hugo Symbol | Variant Class | Variant Classification | dbSNP RS | HGVSc | HGVSp | HGVSp Short | SWISSPROT | BIOTYPE | SIFT | PolyPhen | Tumor Sample Barcode | Tissue | Histology | Sex | Age | Stage | Therapy Types | Drugs | Outcome |
| GCSH | insertion | In_Frame_Ins | novel | c.330_331insAGG | p.Ser110_Glu111insArg | p.S110_E111insR | P23434 | protein_coding | TCGA-D5-6538-01 | Colorectum | colon adenocarcinoma | Female | >=65 | III/IV | Chemotherapy | xeloda | SD | ||
| GCSH | insertion | Frame_Shift_Ins | novel | c.329_330insC | p.Glu111Ter | p.E111* | P23434 | protein_coding | TCGA-D5-6538-01 | Colorectum | colon adenocarcinoma | Female | >=65 | III/IV | Chemotherapy | xeloda | SD | ||
| GCSH | SNV | Missense_Mutation | novel | c.505A>C | p.Lys169Gln | p.K169Q | P23434 | protein_coding | deleterious(0.03) | benign(0.079) | TCGA-A5-A2K5-01 | Endometrium | uterine corpus endometrioid carcinoma | Female | >=65 | I/II | Unknown | Unknown | SD |
| GCSH | SNV | Missense_Mutation | novel | c.407A>C | p.Lys136Thr | p.K136T | P23434 | protein_coding | tolerated(0.17) | benign(0.045) | TCGA-A5-A2K5-01 | Endometrium | uterine corpus endometrioid carcinoma | Female | >=65 | I/II | Unknown | Unknown | SD |
| GCSH | SNV | Missense_Mutation | novel | c.505A>C | p.Lys169Gln | p.K169Q | P23434 | protein_coding | deleterious(0.03) | benign(0.079) | TCGA-AJ-A3EL-01 | Endometrium | uterine corpus endometrioid carcinoma | Female | <65 | I/II | Unknown | Unknown | SD |
| GCSH | SNV | Missense_Mutation | c.172N>A | p.Glu58Lys | p.E58K | P23434 | protein_coding | deleterious(0.03) | probably_damaging(1) | TCGA-AP-A056-01 | Endometrium | uterine corpus endometrioid carcinoma | Female | <65 | I/II | Unknown | Unknown | SD | |
| GCSH | SNV | Missense_Mutation | c.228N>T | p.Gln76His | p.Q76H | P23434 | protein_coding | deleterious(0) | probably_damaging(0.968) | TCGA-AP-A059-01 | Endometrium | uterine corpus endometrioid carcinoma | Female | >=65 | I/II | Unknown | Unknown | SD | |
| GCSH | SNV | Missense_Mutation | c.245N>C | p.Val82Ala | p.V82A | P23434 | protein_coding | deleterious(0.01) | probably_damaging(0.955) | TCGA-B5-A11E-01 | Endometrium | uterine corpus endometrioid carcinoma | Female | <65 | I/II | Unknown | Unknown | SD | |
| GCSH | SNV | Missense_Mutation | c.172G>A | p.Glu58Lys | p.E58K | P23434 | protein_coding | deleterious(0.03) | probably_damaging(1) | TCGA-D1-A17Q-01 | Endometrium | uterine corpus endometrioid carcinoma | Female | <65 | I/II | Unknown | Unknown | SD | |
| GCSH | SNV | Missense_Mutation | novel | c.449G>T | p.Ser150Ile | p.S150I | P23434 | protein_coding | deleterious(0.01) | benign(0.414) | TCGA-EY-A215-01 | Endometrium | uterine corpus endometrioid carcinoma | Female | <65 | I/II | Unknown | Unknown | SD |
| Page: 1 2 |
Top |
Related drugs of malignant transformation related genes |
| Identification of chemicals and drugs interact with genes involved in malignant transfromation |
| (DGIdb 4.0) |
| Entrez ID | Symbol | Category | Interaction Types | Drug Claim Name | Drug Name | PMIDs |
| Page: 1 |

Copyright 2023-Present -The University of Texas Health Science Center at Houston |