
|
|||||
|
 | |
| |
| |
| |
| |
| |
|
Gene: GALT |
Gene summary for GALT |
| Gene information | Species | Human | Gene symbol | GALT | Gene ID | 2592 |
| Gene name | galactose-1-phosphate uridylyltransferase | |
| Gene Alias | GALT | |
| Cytomap | 9p13.3 | |
| Gene Type | protein-coding | GO ID | GO:0005975 | UniProtAcc | A0A0S2Z3Y7 |
Top |
Malignant transformation analysis |
| Identification of the aberrant gene expression in precancerous and cancerous lesions by comparing the gene expression of stem-like cells in diseased tissues with normal stem cells |
| Entrez ID | Symbol | Replicates | Species | Organ | Tissue | Adj P-value | Log2FC | Malignancy |
| 2592 | GALT | P27T-E | Human | Esophagus | ESCC | 1.99e-12 | 1.53e-01 | 0.1055 |
| 2592 | GALT | P28T-E | Human | Esophagus | ESCC | 1.24e-21 | 4.20e-01 | 0.1149 |
| 2592 | GALT | P30T-E | Human | Esophagus | ESCC | 3.88e-12 | 5.48e-01 | 0.137 |
| 2592 | GALT | P31T-E | Human | Esophagus | ESCC | 1.69e-07 | 4.92e-02 | 0.1251 |
| 2592 | GALT | P32T-E | Human | Esophagus | ESCC | 5.99e-10 | 8.91e-02 | 0.1666 |
| 2592 | GALT | P36T-E | Human | Esophagus | ESCC | 3.18e-05 | 1.73e-01 | 0.1187 |
| 2592 | GALT | P37T-E | Human | Esophagus | ESCC | 6.80e-10 | 9.16e-02 | 0.1371 |
| 2592 | GALT | P38T-E | Human | Esophagus | ESCC | 2.55e-02 | 8.77e-02 | 0.127 |
| 2592 | GALT | P39T-E | Human | Esophagus | ESCC | 2.13e-07 | 5.27e-03 | 0.0894 |
| 2592 | GALT | P40T-E | Human | Esophagus | ESCC | 5.53e-05 | 8.95e-02 | 0.109 |
| 2592 | GALT | P42T-E | Human | Esophagus | ESCC | 3.68e-02 | 1.70e-01 | 0.1175 |
| 2592 | GALT | P44T-E | Human | Esophagus | ESCC | 3.38e-02 | 3.00e-02 | 0.1096 |
| 2592 | GALT | P47T-E | Human | Esophagus | ESCC | 6.82e-05 | 6.91e-02 | 0.1067 |
| 2592 | GALT | P48T-E | Human | Esophagus | ESCC | 3.79e-07 | 1.00e-01 | 0.0959 |
| 2592 | GALT | P49T-E | Human | Esophagus | ESCC | 1.15e-07 | 7.40e-01 | 0.1768 |
| 2592 | GALT | P52T-E | Human | Esophagus | ESCC | 8.69e-13 | 1.36e-01 | 0.1555 |
| 2592 | GALT | P54T-E | Human | Esophagus | ESCC | 1.54e-06 | 9.13e-02 | 0.0975 |
| 2592 | GALT | P56T-E | Human | Esophagus | ESCC | 1.63e-02 | 4.58e-01 | 0.1613 |
| 2592 | GALT | P57T-E | Human | Esophagus | ESCC | 2.42e-11 | 1.31e-01 | 0.0926 |
| 2592 | GALT | P61T-E | Human | Esophagus | ESCC | 1.52e-06 | 1.92e-01 | 0.099 |
| Page: 1 2 3 4 5 |
| Tissue | Expression Dynamics | Abbreviation |
| Esophagus | 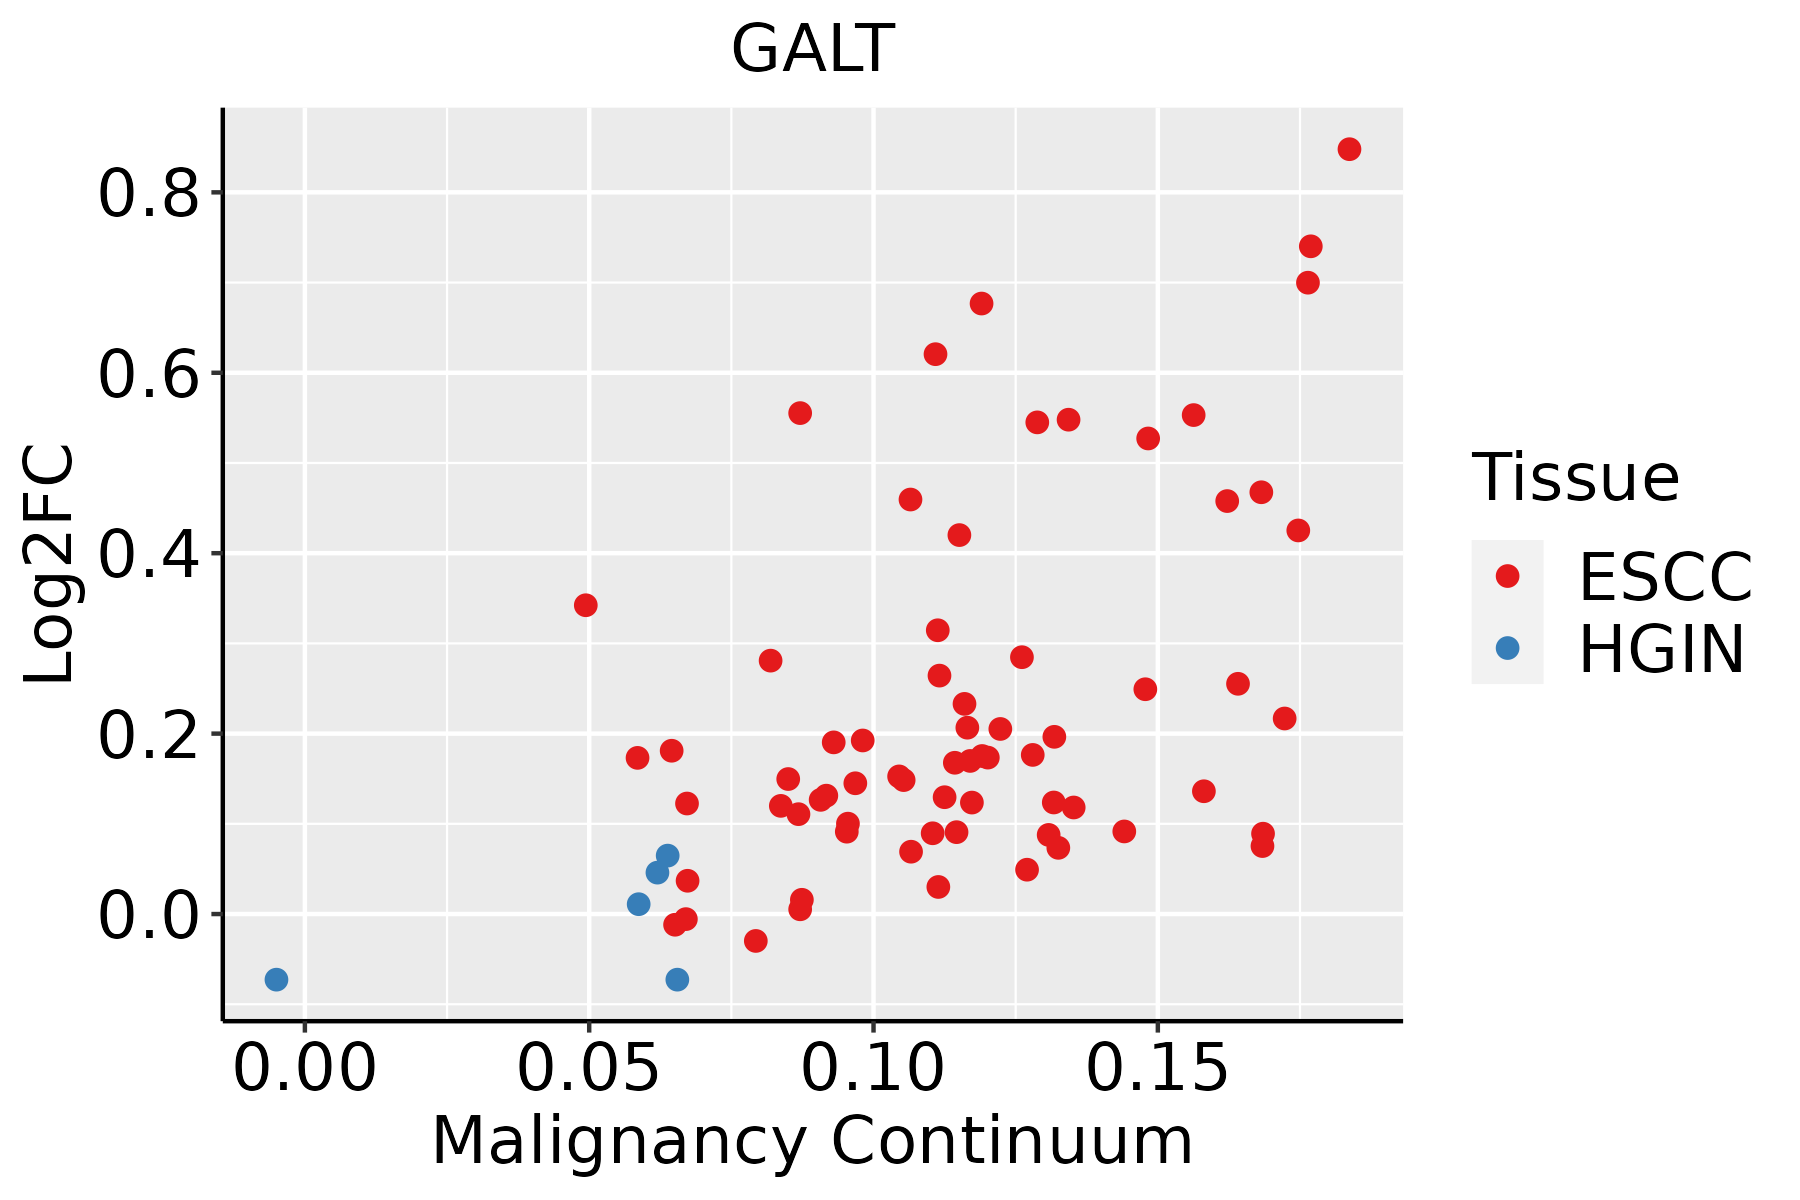 | ESCC: Esophageal squamous cell carcinoma |
| HGIN: High-grade intraepithelial neoplasias | ||
| LGIN: Low-grade intraepithelial neoplasias | ||
| Liver |  | HCC: Hepatocellular carcinoma |
| NAFLD: Non-alcoholic fatty liver disease | ||
| Oral Cavity | 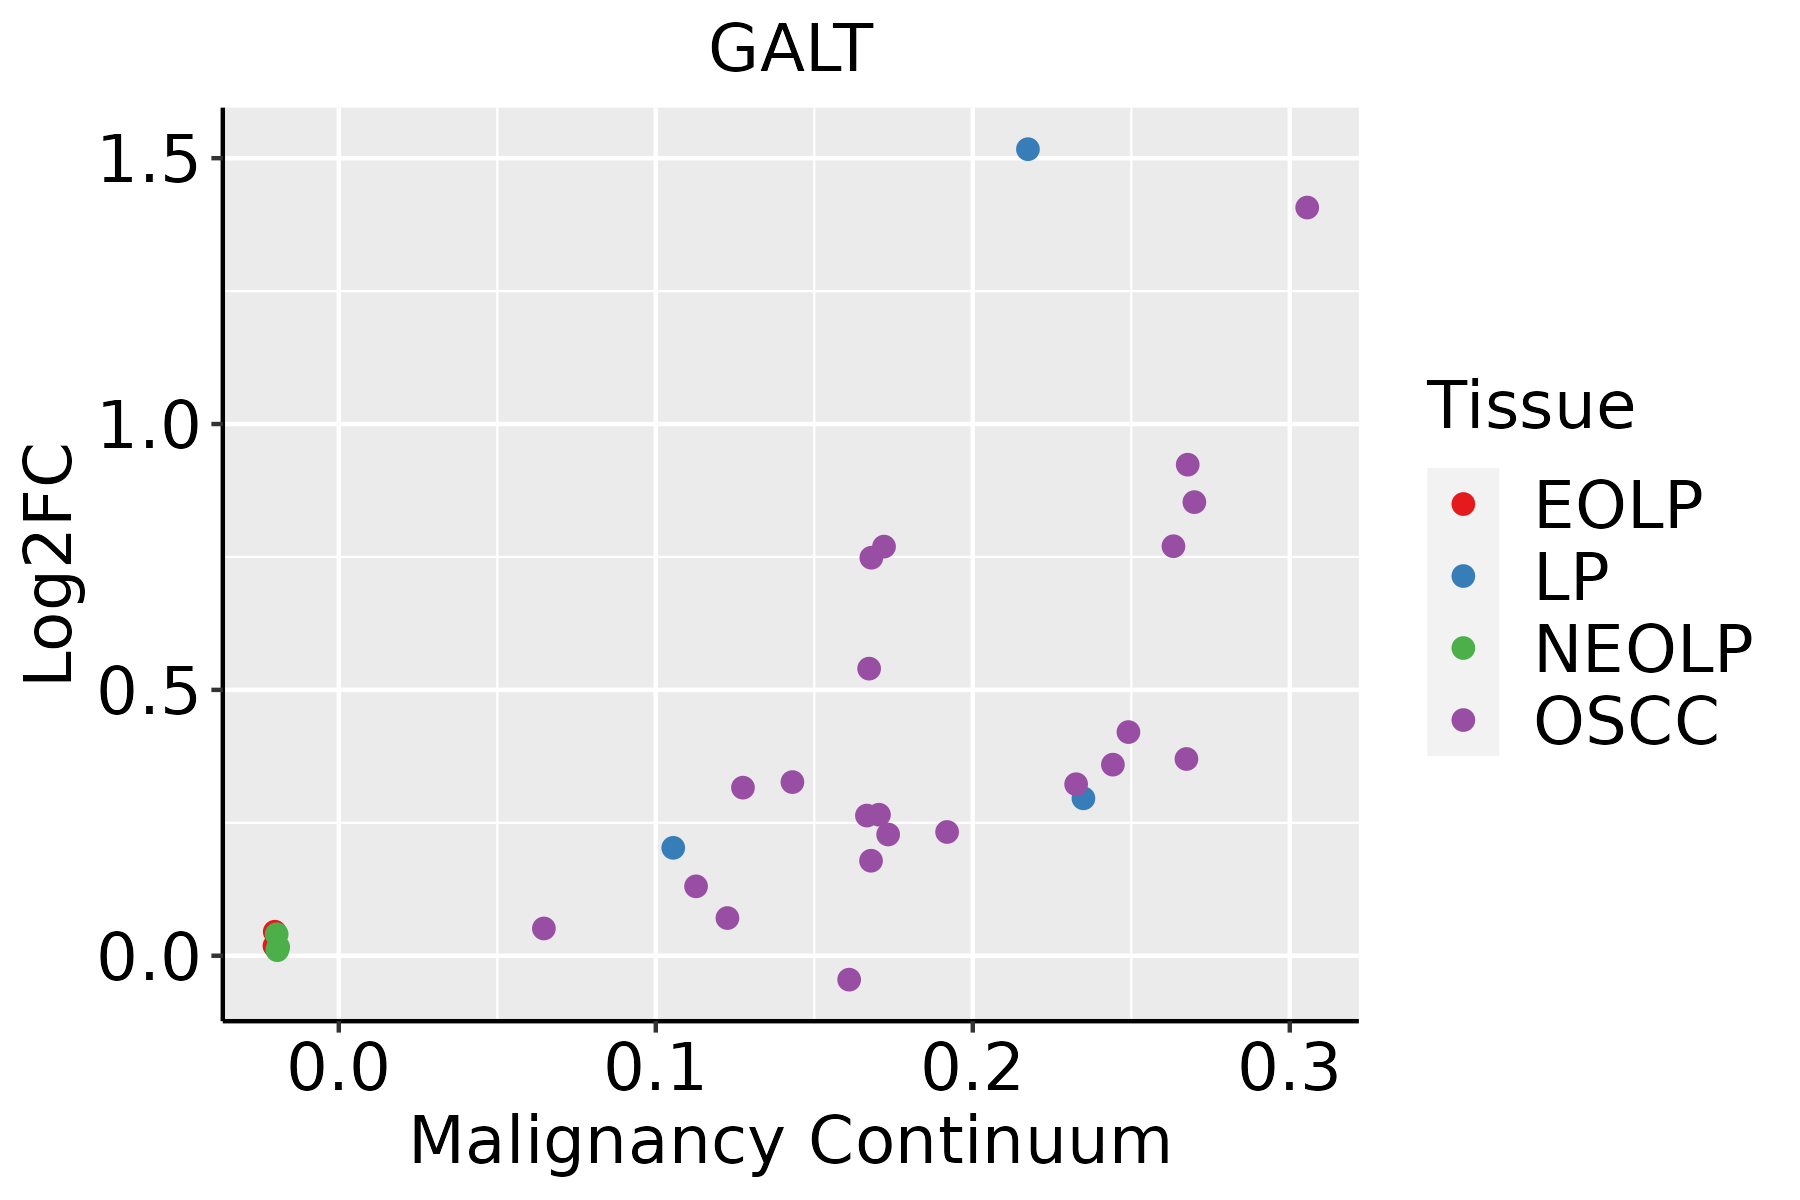 | EOLP: Erosive Oral lichen planus |
| LP: leukoplakia | ||
| NEOLP: Non-erosive oral lichen planus | ||
| OSCC: Oral squamous cell carcinoma | ||
| Skin | 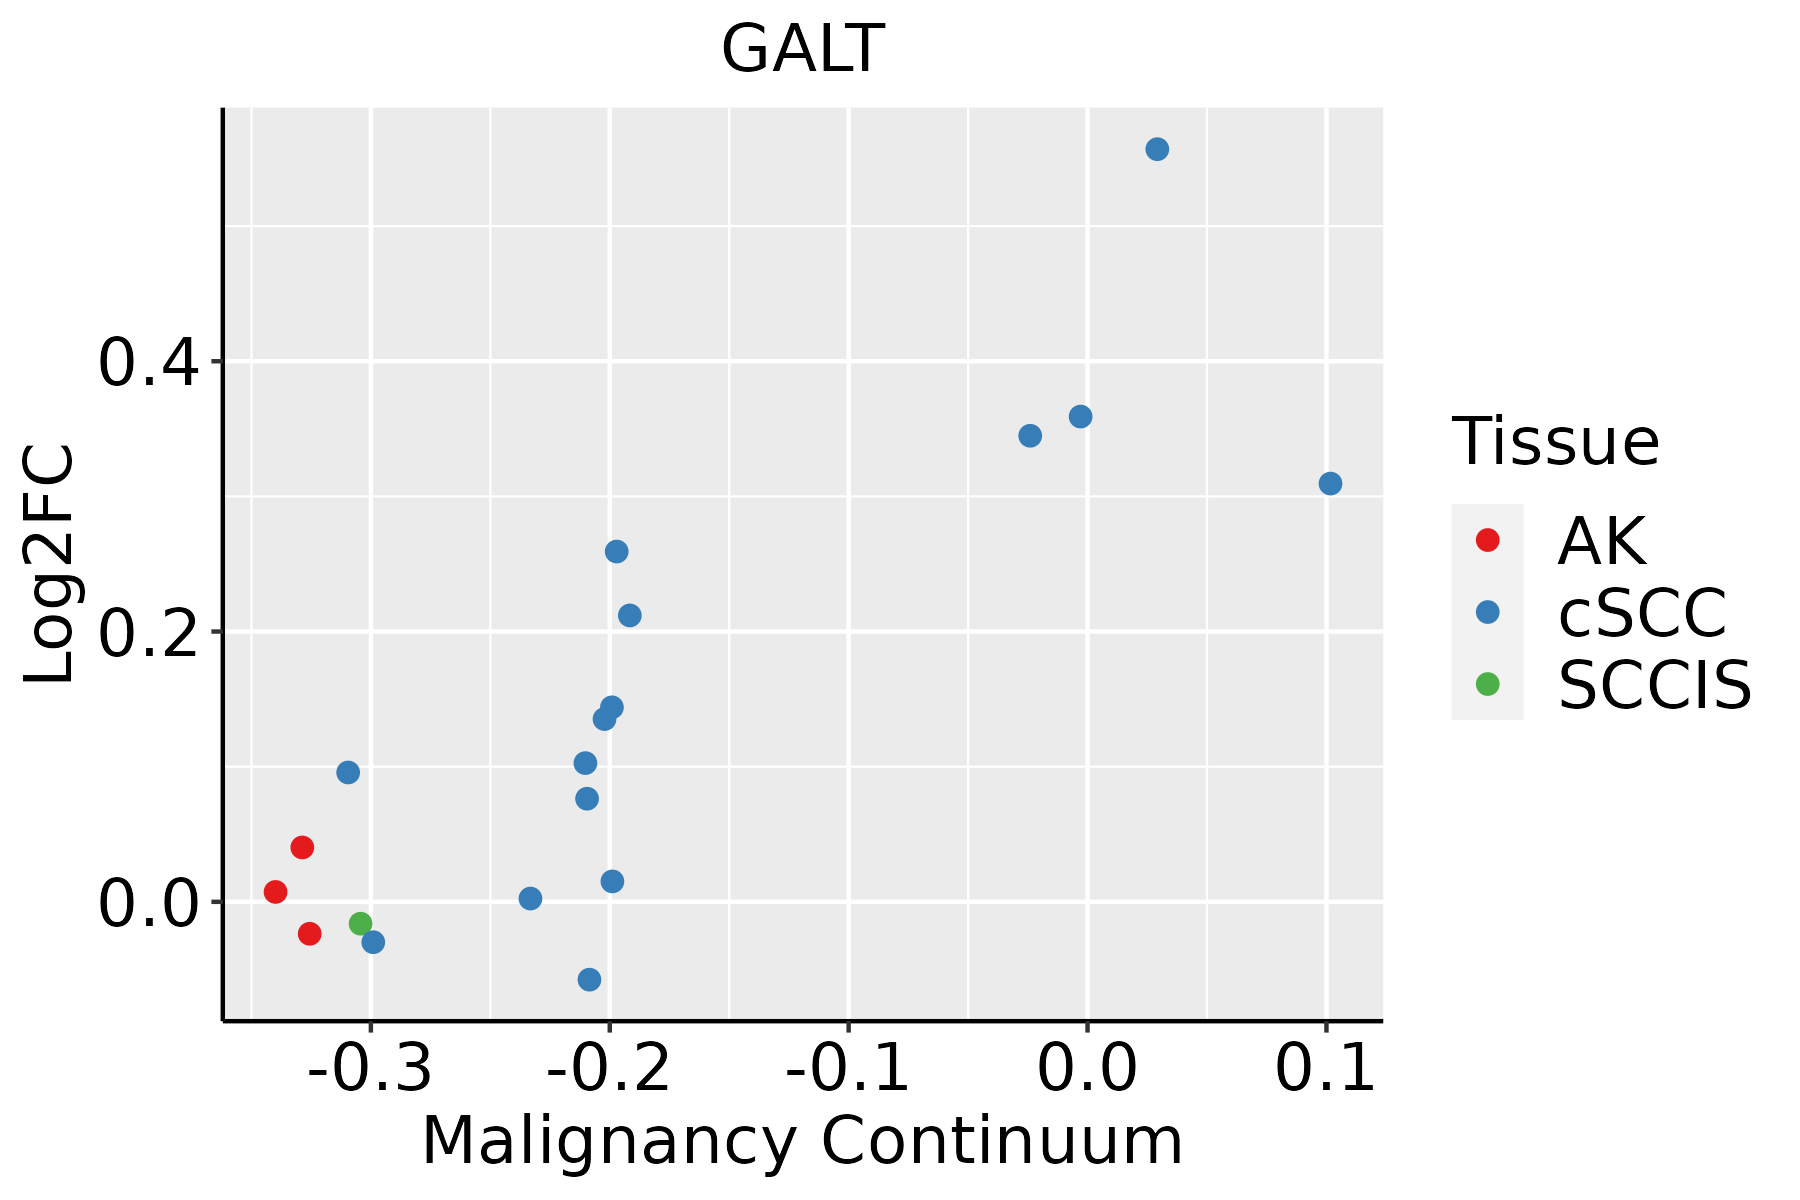 | AK: Actinic keratosis |
| cSCC: Cutaneous squamous cell carcinoma | ||
| SCCIS:squamous cell carcinoma in situ |
| ∗log2FC in expression of this searched gene in stem-like cells from each diseased tissue sample relative to stem-like cells in normal samples in each tissue plotted against the malignancy continuum. Samples are colored based on if they are from different disease stage. |
Top |
Malignant transformation related pathway analysis |
| Find out the enriched GO biological processes and KEGG pathways involved in transition from healthy to precancer to cancer |
| Tissue | Disease Stage | Enriched GO biological Processes |
| Colorectum | AD |  |
| Colorectum | SER |  |
| Colorectum | MSS |  |
| Colorectum | MSI-H |  |
| Colorectum | FAP |  |
| ∗Top 15 enriched GO BP terms are showed in the bar plot of each disease state in each tissue. Each row represents a significant GO biological process which is colored according to the -log10(p.adjust). |
| Page: 1 2 3 4 5 6 7 8 9 |
| GO ID | Tissue | Disease Stage | Description | Gene Ratio | Bg Ratio | pvalue | p.adjust | Count |
| GO:00509006 | Breast | Precancer | leukocyte migration | 47/1080 | 369/18723 | 2.82e-07 | 1.39e-05 | 47 |
| GO:00447063 | Breast | Precancer | multi-multicellular organism process | 31/1080 | 220/18723 | 3.73e-06 | 1.19e-04 | 31 |
| GO:00420609 | Breast | Precancer | wound healing | 48/1080 | 422/18723 | 5.48e-06 | 1.63e-04 | 48 |
| GO:00506736 | Breast | Precancer | epithelial cell proliferation | 46/1080 | 437/18723 | 6.02e-05 | 1.23e-03 | 46 |
| GO:00506786 | Breast | Precancer | regulation of epithelial cell proliferation | 40/1080 | 381/18723 | 1.88e-04 | 3.03e-03 | 40 |
| GO:0035036 | Breast | Precancer | sperm-egg recognition | 10/1080 | 48/18723 | 3.43e-04 | 4.81e-03 | 10 |
| GO:0007339 | Breast | Precancer | binding of sperm to zona pellucida | 9/1080 | 40/18723 | 3.69e-04 | 5.03e-03 | 9 |
| GO:0009988 | Breast | Precancer | cell-cell recognition | 12/1080 | 68/18723 | 4.63e-04 | 6.12e-03 | 12 |
| GO:00025263 | Breast | Precancer | acute inflammatory response | 16/1080 | 112/18723 | 6.87e-04 | 8.36e-03 | 16 |
| GO:00506793 | Breast | Precancer | positive regulation of epithelial cell proliferation | 24/1080 | 207/18723 | 8.88e-04 | 1.02e-02 | 24 |
| GO:00059966 | Breast | Precancer | monosaccharide metabolic process | 27/1080 | 257/18723 | 1.94e-03 | 1.88e-02 | 27 |
| GO:00193186 | Breast | Precancer | hexose metabolic process | 25/1080 | 237/18723 | 2.64e-03 | 2.36e-02 | 25 |
| GO:00020649 | Breast | Precancer | epithelial cell development | 23/1080 | 220/18723 | 4.28e-03 | 3.35e-02 | 23 |
| GO:00447061 | Breast | IDC | multi-multicellular organism process | 41/1434 | 220/18723 | 8.58e-08 | 5.19e-06 | 41 |
| GO:005090011 | Breast | IDC | leukocyte migration | 54/1434 | 369/18723 | 3.10e-06 | 1.15e-04 | 54 |
| GO:005067313 | Breast | IDC | epithelial cell proliferation | 60/1434 | 437/18723 | 7.13e-06 | 2.15e-04 | 60 |
| GO:005067812 | Breast | IDC | regulation of epithelial cell proliferation | 54/1434 | 381/18723 | 8.07e-06 | 2.39e-04 | 54 |
| GO:004206014 | Breast | IDC | wound healing | 55/1434 | 422/18723 | 7.27e-05 | 1.45e-03 | 55 |
| GO:005067911 | Breast | IDC | positive regulation of epithelial cell proliferation | 29/1434 | 207/18723 | 1.14e-03 | 1.24e-02 | 29 |
| GO:00073391 | Breast | IDC | binding of sperm to zona pellucida | 9/1434 | 40/18723 | 2.76e-03 | 2.42e-02 | 9 |
| Page: 1 2 3 4 5 6 7 8 9 10 11 12 13 14 15 16 17 18 19 20 21 22 23 24 25 26 |
| Pathway ID | Tissue | Disease Stage | Description | Gene Ratio | Bg Ratio | pvalue | p.adjust | qvalue | Count |
| hsa012505 | Esophagus | ESCC | Biosynthesis of nucleotide sugars | 28/4205 | 37/8465 | 1.10e-03 | 3.42e-03 | 1.75e-03 | 28 |
| hsa005202 | Esophagus | ESCC | Amino sugar and nucleotide sugar metabolism | 35/4205 | 49/8465 | 1.60e-03 | 4.88e-03 | 2.50e-03 | 35 |
| hsa0125012 | Esophagus | ESCC | Biosynthesis of nucleotide sugars | 28/4205 | 37/8465 | 1.10e-03 | 3.42e-03 | 1.75e-03 | 28 |
| hsa0052011 | Esophagus | ESCC | Amino sugar and nucleotide sugar metabolism | 35/4205 | 49/8465 | 1.60e-03 | 4.88e-03 | 2.50e-03 | 35 |
| hsa04917 | Liver | HCC | Prolactin signaling pathway | 43/4020 | 70/8465 | 1.30e-02 | 3.19e-02 | 1.78e-02 | 43 |
| hsa049171 | Liver | HCC | Prolactin signaling pathway | 43/4020 | 70/8465 | 1.30e-02 | 3.19e-02 | 1.78e-02 | 43 |
| hsa00520 | Oral cavity | OSCC | Amino sugar and nucleotide sugar metabolism | 34/3704 | 49/8465 | 2.48e-04 | 8.08e-04 | 4.11e-04 | 34 |
| hsa012504 | Oral cavity | OSCC | Biosynthesis of nucleotide sugars | 25/3704 | 37/8465 | 2.93e-03 | 7.49e-03 | 3.81e-03 | 25 |
| hsa005201 | Oral cavity | OSCC | Amino sugar and nucleotide sugar metabolism | 34/3704 | 49/8465 | 2.48e-04 | 8.08e-04 | 4.11e-04 | 34 |
| hsa0125011 | Oral cavity | OSCC | Biosynthesis of nucleotide sugars | 25/3704 | 37/8465 | 2.93e-03 | 7.49e-03 | 3.81e-03 | 25 |
| Page: 1 |
Top |
Cell-cell communication analysis |
| Identification of potential cell-cell interactions between two cell types and their ligand-receptor pairs for different disease states |
| Ligand | Receptor | LRpair | Pathway | Tissue | Disease Stage |
| Page: 1 |
Top |
Single-cell gene regulatory network inference analysis |
| Find out the significant the regulons (TFs) and the target genes of each regulon across cell types for different disease states |
| TF | Cell Type | Tissue | Disease Stage | Target Gene | RSS | Regulon Activity |
| ∗The dot plots of a searched regulon are shown for all cell subpopulations in each disease state of each tissue based on the regulon specific score inferred using pySCENIC and by calculating the average expression. |
| Page: 1 |
Top |
Somatic mutation of malignant transformation related genes |
| Annotation of somatic variants for genes involved in malignant transformation |
| Hugo Symbol | Variant Class | Variant Classification | dbSNP RS | HGVSc | HGVSp | HGVSp Short | SWISSPROT | BIOTYPE | SIFT | PolyPhen | Tumor Sample Barcode | Tissue | Histology | Sex | Age | Stage | Therapy Types | Drugs | Outcome |
| GALT | insertion | Frame_Shift_Ins | novel | c.550_551insCTTTTCCAAGCAAAGTCTGCTCGAGGAGTCTGGT | p.His184ProfsTer30 | p.H184Pfs*30 | P07902 | protein_coding | TCGA-A8-A07J-01 | Breast | breast invasive carcinoma | Female | <65 | I/II | Chemotherapy | 5-fluorouracil | CR | ||
| GALT | SNV | Missense_Mutation | novel | c.268N>A | p.Asp90Asn | p.D90N | P07902 | protein_coding | tolerated(0.12) | benign(0.003) | TCGA-2W-A8YY-01 | Cervix | cervical & endocervical cancer | Female | <65 | I/II | Chemotherapy | cisplatin | CR |
| GALT | SNV | Missense_Mutation | novel | c.46G>C | p.Glu16Gln | p.E16Q | P07902 | protein_coding | deleterious_low_confidence(0.04) | possibly_damaging(0.703) | TCGA-JW-A5VL-01 | Cervix | cervical & endocervical cancer | Female | <65 | I/II | Unknown | Unknown | SD |
| GALT | SNV | Missense_Mutation | novel | c.877T>G | p.Ser293Ala | p.S293A | P07902 | protein_coding | deleterious(0.04) | probably_damaging(0.945) | TCGA-VS-A9V4-01 | Cervix | cervical & endocervical cancer | Female | <65 | I/II | Chemotherapy | cisplatin | PD |
| GALT | SNV | Missense_Mutation | c.1078G>A | p.Ala360Thr | p.A360T | P07902 | protein_coding | tolerated(0.43) | benign(0.02) | TCGA-AA-A00N-01 | Colorectum | colon adenocarcinoma | Male | >=65 | I/II | Unknown | Unknown | PD | |
| GALT | SNV | Missense_Mutation | rs553769637 | c.668G>A | p.Arg223His | p.R223H | P07902 | protein_coding | tolerated(0.14) | benign(0.005) | TCGA-CA-6717-01 | Colorectum | colon adenocarcinoma | Male | <65 | I/II | Chemotherapy | oxaliplatin | CR |
| GALT | SNV | Missense_Mutation | c.566N>C | p.Val189Ala | p.V189A | P07902 | protein_coding | deleterious(0) | benign(0.088) | TCGA-CM-6171-01 | Colorectum | colon adenocarcinoma | Female | >=65 | I/II | Unknown | Unknown | SD | |
| GALT | SNV | Missense_Mutation | c.507N>T | p.Gln169His | p.Q169H | P07902 | protein_coding | deleterious(0) | probably_damaging(0.997) | TCGA-G4-6320-01 | Colorectum | colon adenocarcinoma | Male | >=65 | III/IV | Chemotherapy | oxaliplatin | SD | |
| GALT | SNV | Missense_Mutation | rs553769637 | c.668G>A | p.Arg223His | p.R223H | P07902 | protein_coding | tolerated(0.14) | benign(0.005) | TCGA-NH-A5IV-01 | Colorectum | colon adenocarcinoma | Female | >=65 | I/II | Unknown | Unknown | SD |
| GALT | SNV | Missense_Mutation | rs111033686 | c.413N>T | p.Thr138Met | p.T138M | P07902 | protein_coding | deleterious(0) | probably_damaging(0.994) | TCGA-DC-6154-01 | Colorectum | rectum adenocarcinoma | Female | <65 | I/II | Chemotherapy | 5-fluorouracil | SD |
| Page: 1 2 3 4 |
Top |
Related drugs of malignant transformation related genes |
| Identification of chemicals and drugs interact with genes involved in malignant transfromation |
| (DGIdb 4.0) |
| Entrez ID | Symbol | Category | Interaction Types | Drug Claim Name | Drug Name | PMIDs |
| 2592 | GALT | ENZYME | HyperAcute vaccine | |||
| 2592 | GALT | ENZYME | Algenpantucel-L | ALGENPANTUCEL-L | 24343588 |
| Page: 1 |

Copyright 2023-Present -The University of Texas Health Science Center at Houston |