
|
|||||
|
 | |
| |
| |
| |
| |
| |
|
Gene: GABPB1-AS1 |
Gene summary for GABPB1-AS1 |
| Gene information | Species | Human | Gene symbol | GABPB1-AS1 | Gene ID | 100129387 |
| Gene name | GABPB1 antisense RNA 1 | |
| Gene Alias | GABPB1-AS1 | |
| Cytomap | 15q21.2 | |
| Gene Type | ncRNA | GO ID | NA | UniProtAcc | NA |
Top |
Malignant transformation analysis |
| Identification of the aberrant gene expression in precancerous and cancerous lesions by comparing the gene expression of stem-like cells in diseased tissues with normal stem cells |
| Entrez ID | Symbol | Replicates | Species | Organ | Tissue | Adj P-value | Log2FC | Malignancy |
| 100129387 | GABPB1-AS1 | A002-C-201 | Human | Colorectum | FAP | 2.71e-11 | -3.58e-01 | 0.0324 |
| 100129387 | GABPB1-AS1 | A002-C-203 | Human | Colorectum | FAP | 1.54e-04 | -2.81e-01 | 0.2786 |
| 100129387 | GABPB1-AS1 | A001-C-119 | Human | Colorectum | FAP | 1.35e-02 | -1.72e-01 | -0.1557 |
| 100129387 | GABPB1-AS1 | A001-C-108 | Human | Colorectum | FAP | 1.95e-09 | -1.67e-01 | -0.0272 |
| 100129387 | GABPB1-AS1 | A002-C-205 | Human | Colorectum | FAP | 1.52e-18 | -4.48e-01 | -0.1236 |
| 100129387 | GABPB1-AS1 | A015-C-006 | Human | Colorectum | FAP | 1.65e-09 | -4.76e-02 | -0.0994 |
| 100129387 | GABPB1-AS1 | A015-C-106 | Human | Colorectum | FAP | 5.42e-08 | 1.16e-01 | -0.0511 |
| 100129387 | GABPB1-AS1 | A002-C-114 | Human | Colorectum | FAP | 8.52e-16 | -4.47e-01 | -0.1561 |
| 100129387 | GABPB1-AS1 | A015-C-104 | Human | Colorectum | FAP | 1.39e-21 | -1.63e-01 | -0.1899 |
| 100129387 | GABPB1-AS1 | A001-C-014 | Human | Colorectum | FAP | 4.66e-10 | -1.85e-01 | 0.0135 |
| 100129387 | GABPB1-AS1 | A002-C-016 | Human | Colorectum | FAP | 2.30e-20 | -4.55e-01 | 0.0521 |
| 100129387 | GABPB1-AS1 | A015-C-002 | Human | Colorectum | FAP | 8.85e-09 | -4.09e-01 | -0.0763 |
| 100129387 | GABPB1-AS1 | A001-C-203 | Human | Colorectum | FAP | 2.02e-07 | -1.61e-01 | -0.0481 |
| 100129387 | GABPB1-AS1 | A002-C-116 | Human | Colorectum | FAP | 1.87e-27 | -4.93e-01 | -0.0452 |
| 100129387 | GABPB1-AS1 | A014-C-008 | Human | Colorectum | FAP | 7.24e-12 | -4.19e-01 | -0.191 |
| 100129387 | GABPB1-AS1 | A018-E-020 | Human | Colorectum | FAP | 8.83e-14 | -1.90e-01 | -0.2034 |
| 100129387 | GABPB1-AS1 | F034 | Human | Colorectum | FAP | 2.10e-13 | -3.30e-01 | -0.0665 |
| 100129387 | GABPB1-AS1 | F072B | Human | Colorectum | FAP | 3.24e-07 | -1.88e-01 | 0.257 |
| 100129387 | GABPB1-AS1 | CRC-1-8810 | Human | Colorectum | CRC | 2.45e-03 | 1.98e-01 | 0.6257 |
| 100129387 | GABPB1-AS1 | CRC-3-11773 | Human | Colorectum | CRC | 3.16e-16 | -4.87e-01 | 0.2564 |
| Page: 1 2 3 4 5 6 7 8 9 10 |
| Tissue | Expression Dynamics | Abbreviation |
| Cervix | 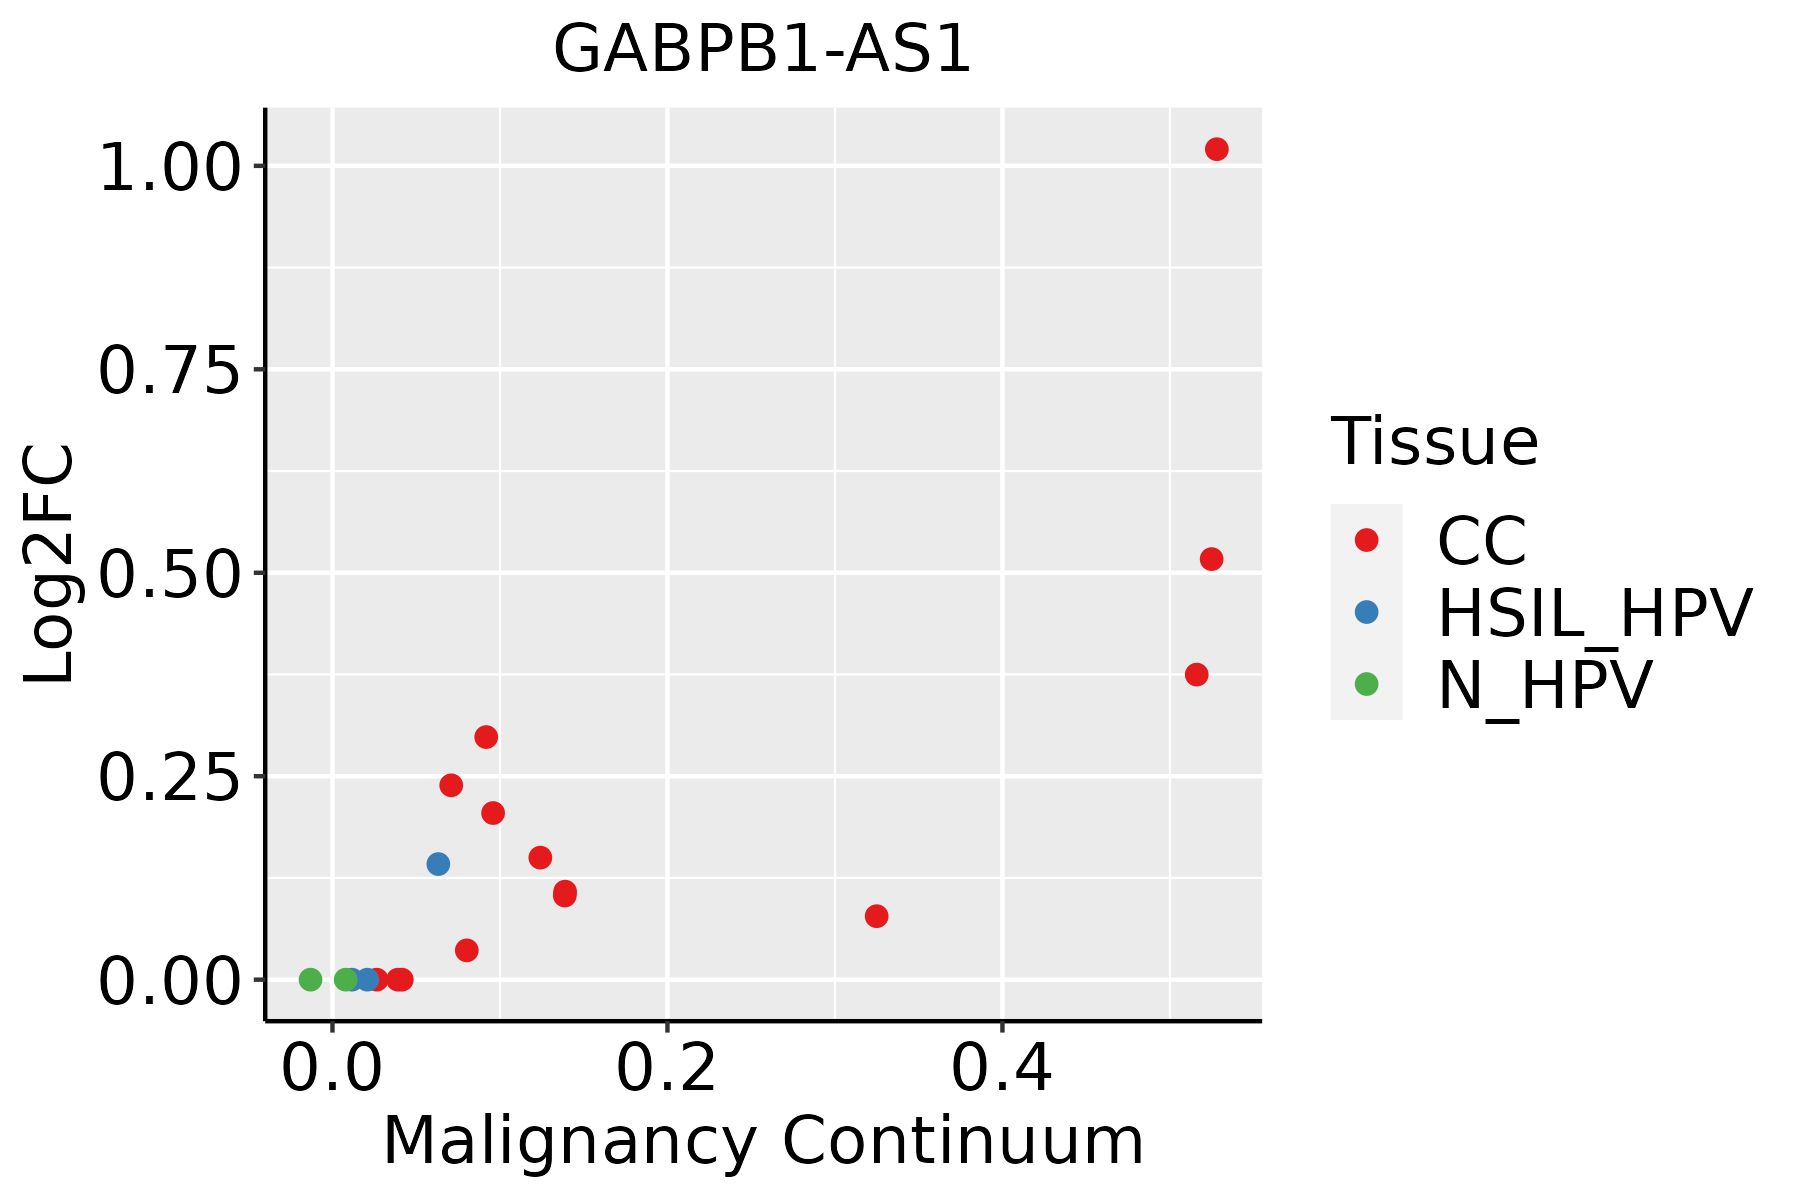 | CC: Cervix cancer |
| HSIL_HPV: HPV-infected high-grade squamous intraepithelial lesions | ||
| N_HPV: HPV-infected normal cervix | ||
| Colorectum (GSE201348) |  | FAP: Familial adenomatous polyposis |
| CRC: Colorectal cancer | ||
| Colorectum (HTA11) |  | AD: Adenomas |
| SER: Sessile serrated lesions | ||
| MSI-H: Microsatellite-high colorectal cancer | ||
| MSS: Microsatellite stable colorectal cancer | ||
| Endometrium | 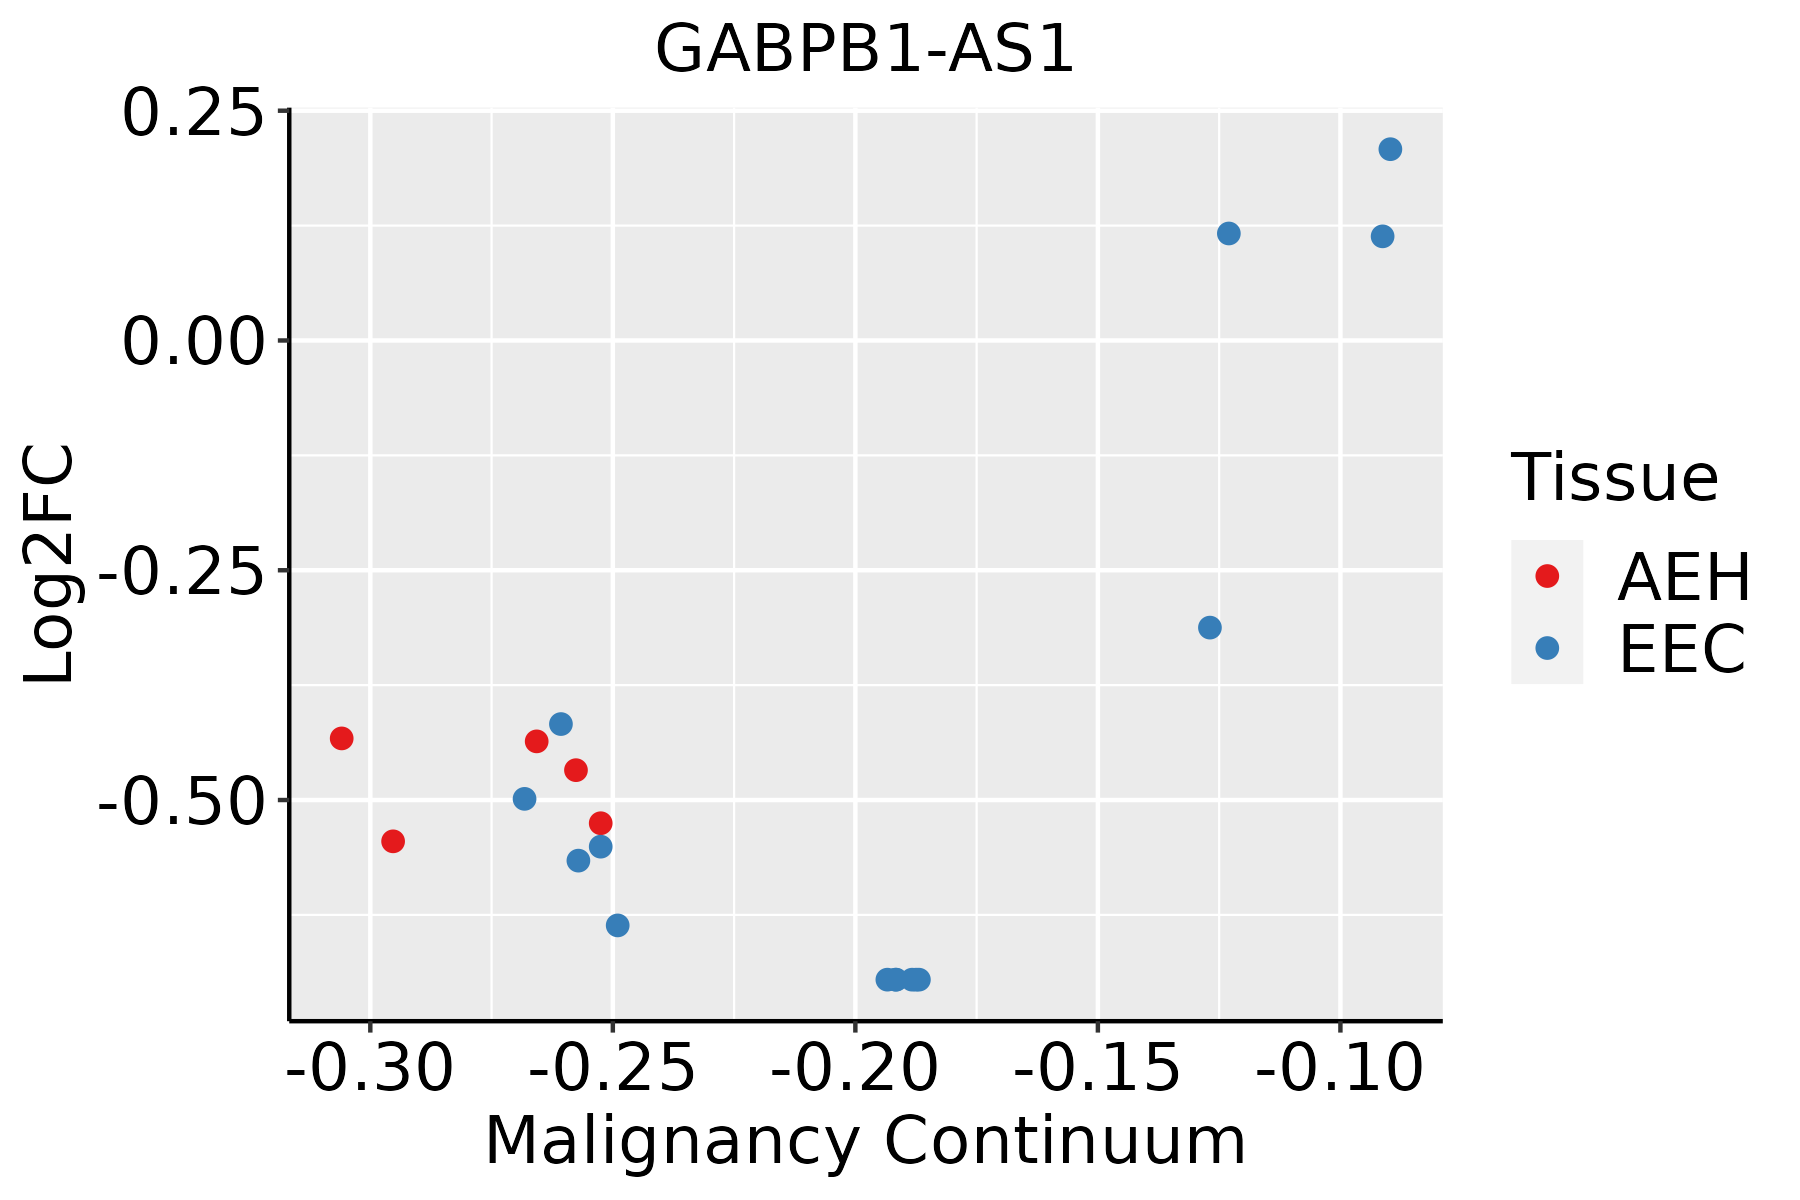 | AEH: Atypical endometrial hyperplasia |
| EEC: Endometrioid Cancer | ||
| Esophagus | 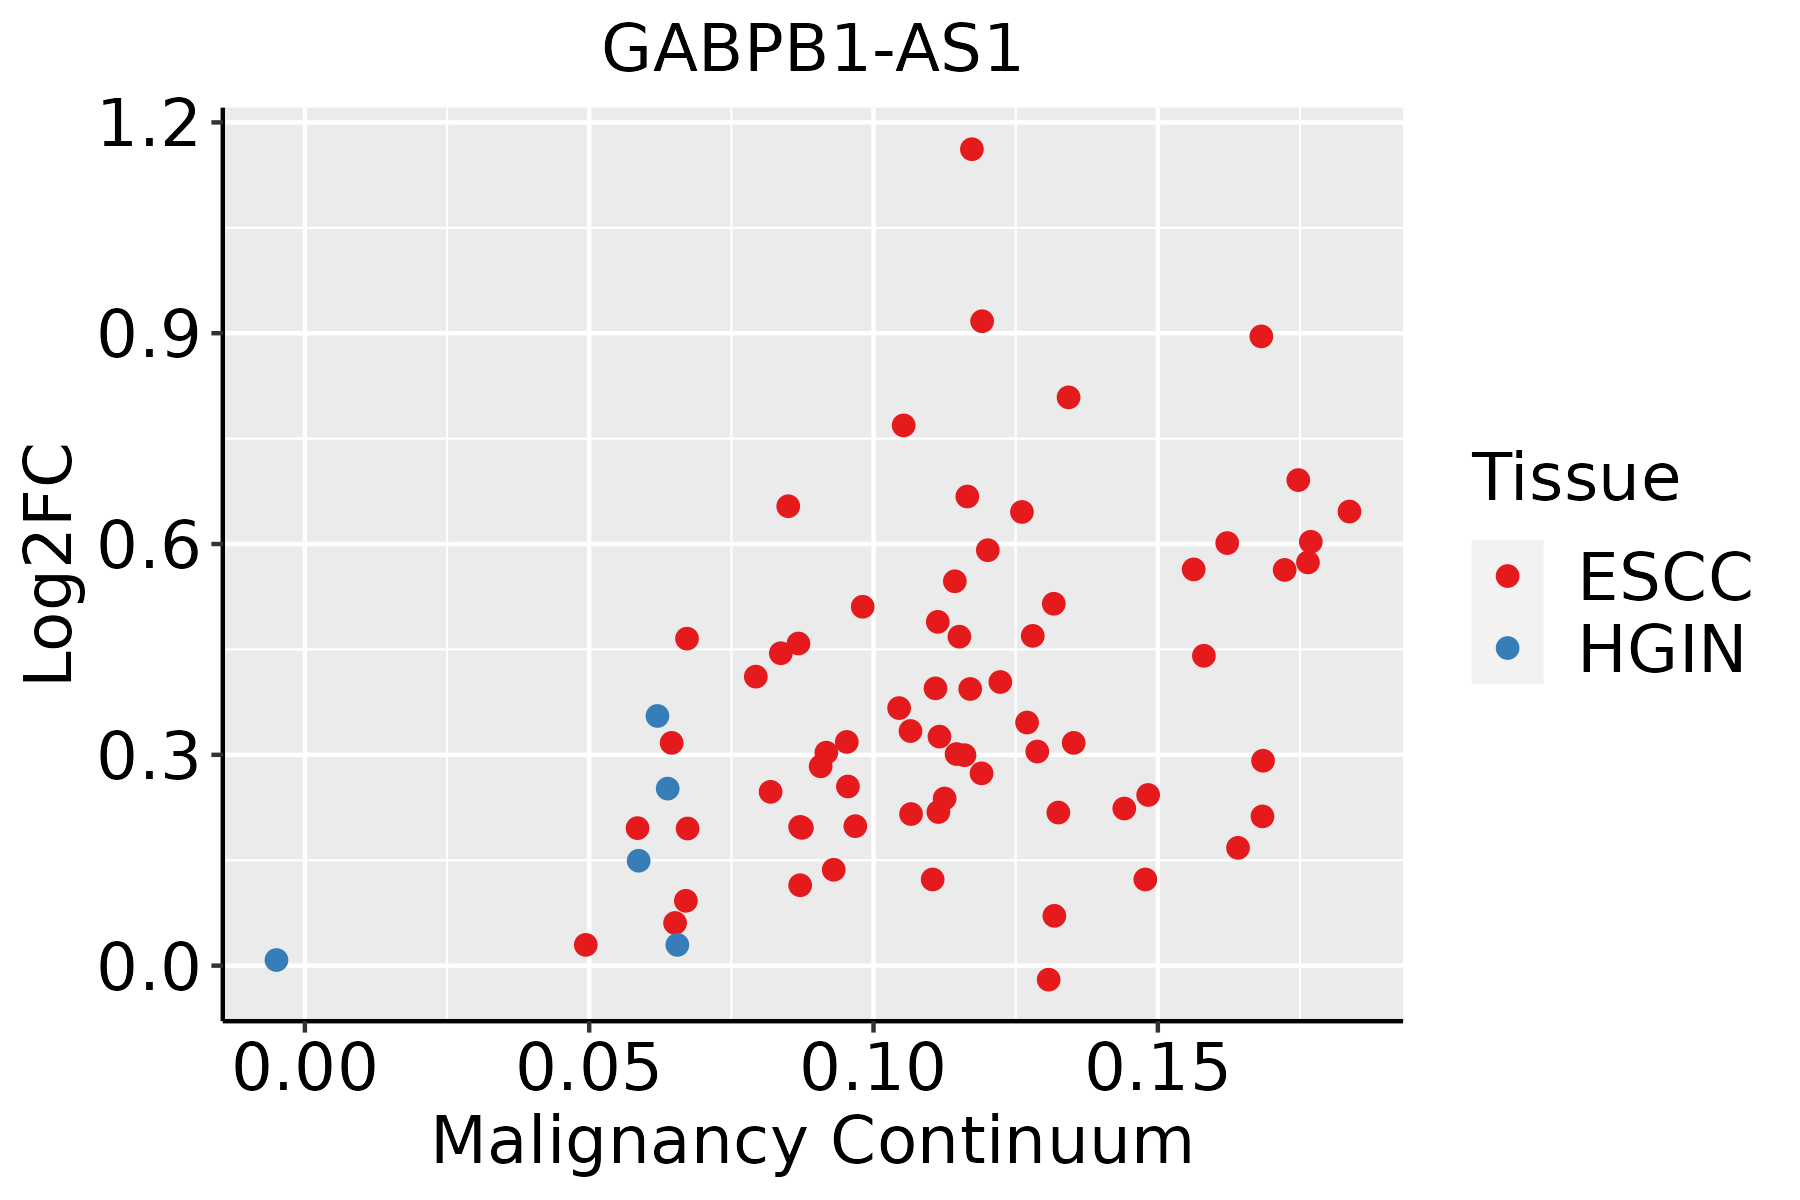 | ESCC: Esophageal squamous cell carcinoma |
| HGIN: High-grade intraepithelial neoplasias | ||
| LGIN: Low-grade intraepithelial neoplasias | ||
| Liver | 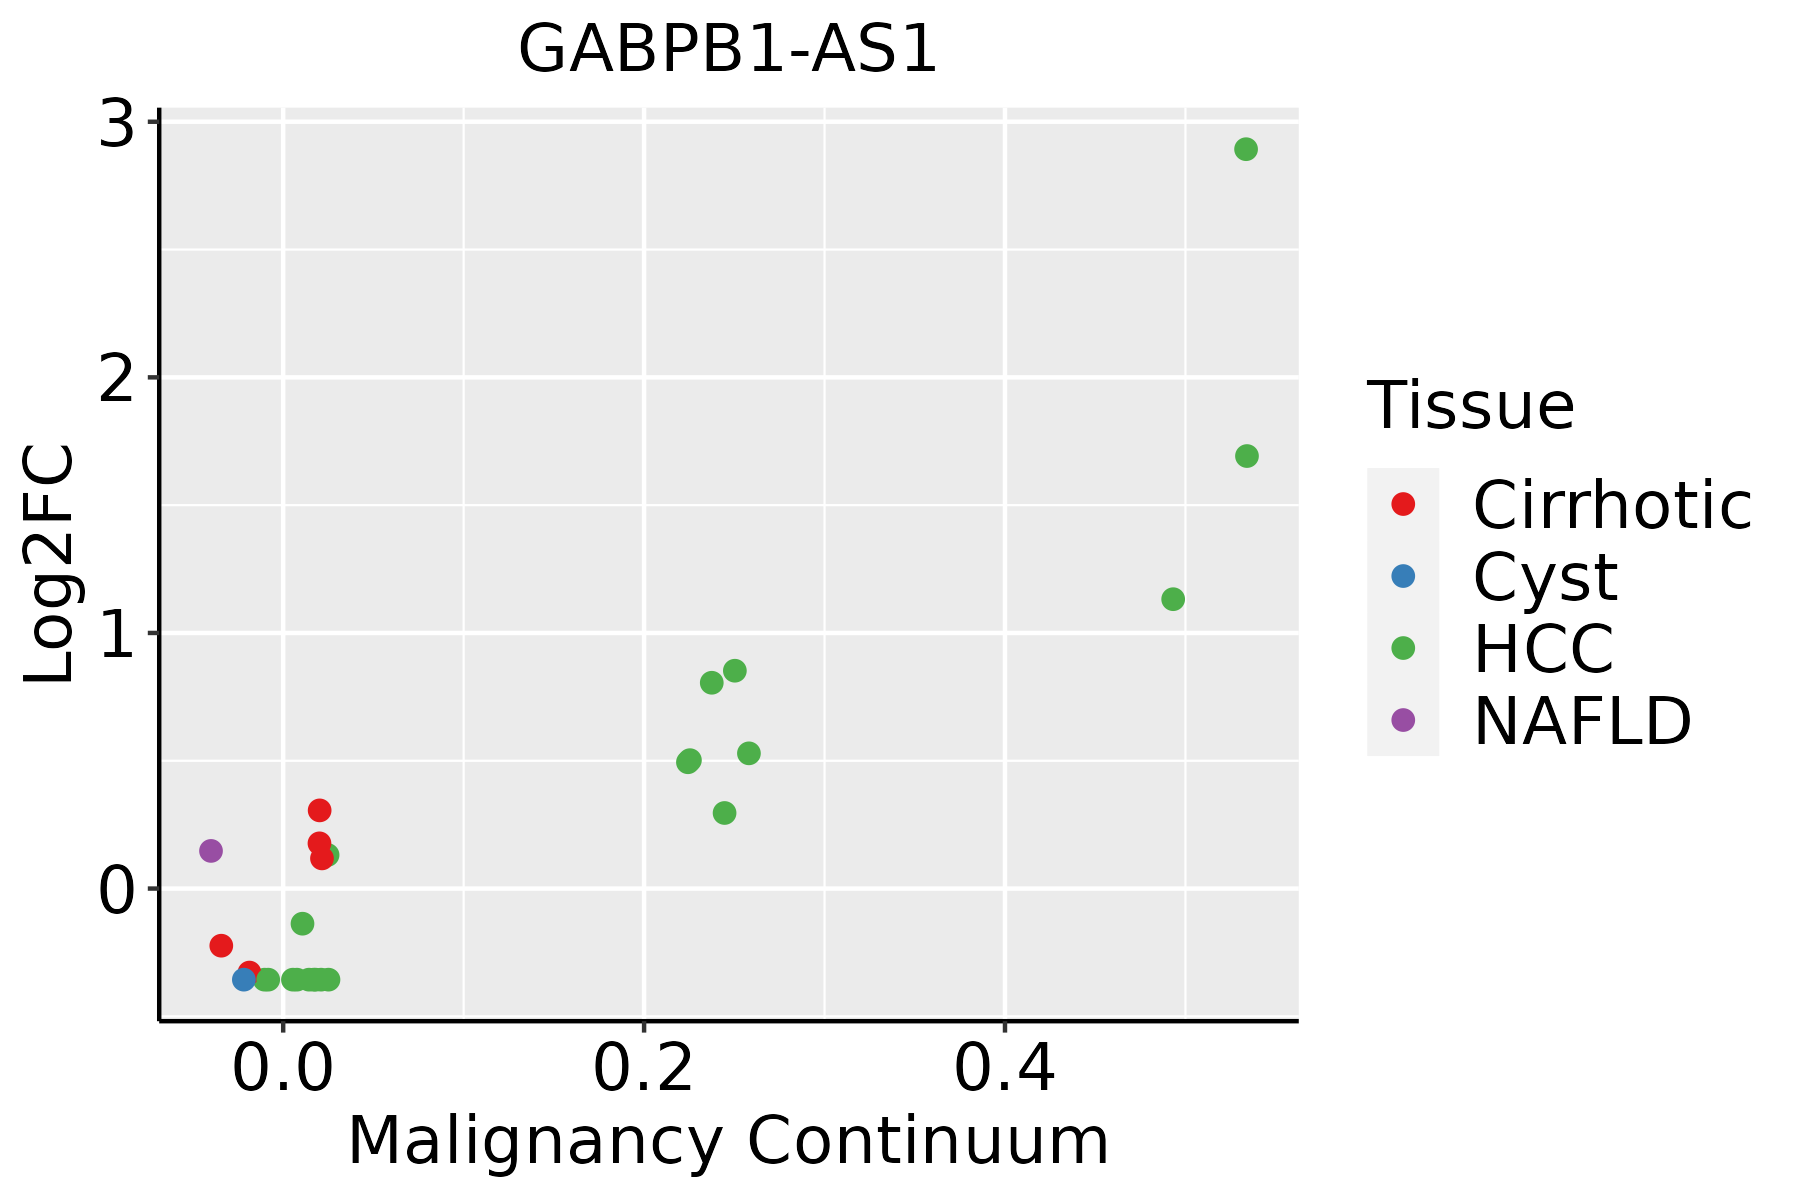 | HCC: Hepatocellular carcinoma |
| NAFLD: Non-alcoholic fatty liver disease | ||
| Oral Cavity |  | EOLP: Erosive Oral lichen planus |
| LP: leukoplakia | ||
| NEOLP: Non-erosive oral lichen planus | ||
| OSCC: Oral squamous cell carcinoma | ||
| Prostate |  | BPH: Benign Prostatic Hyperplasia |
| Thyroid | 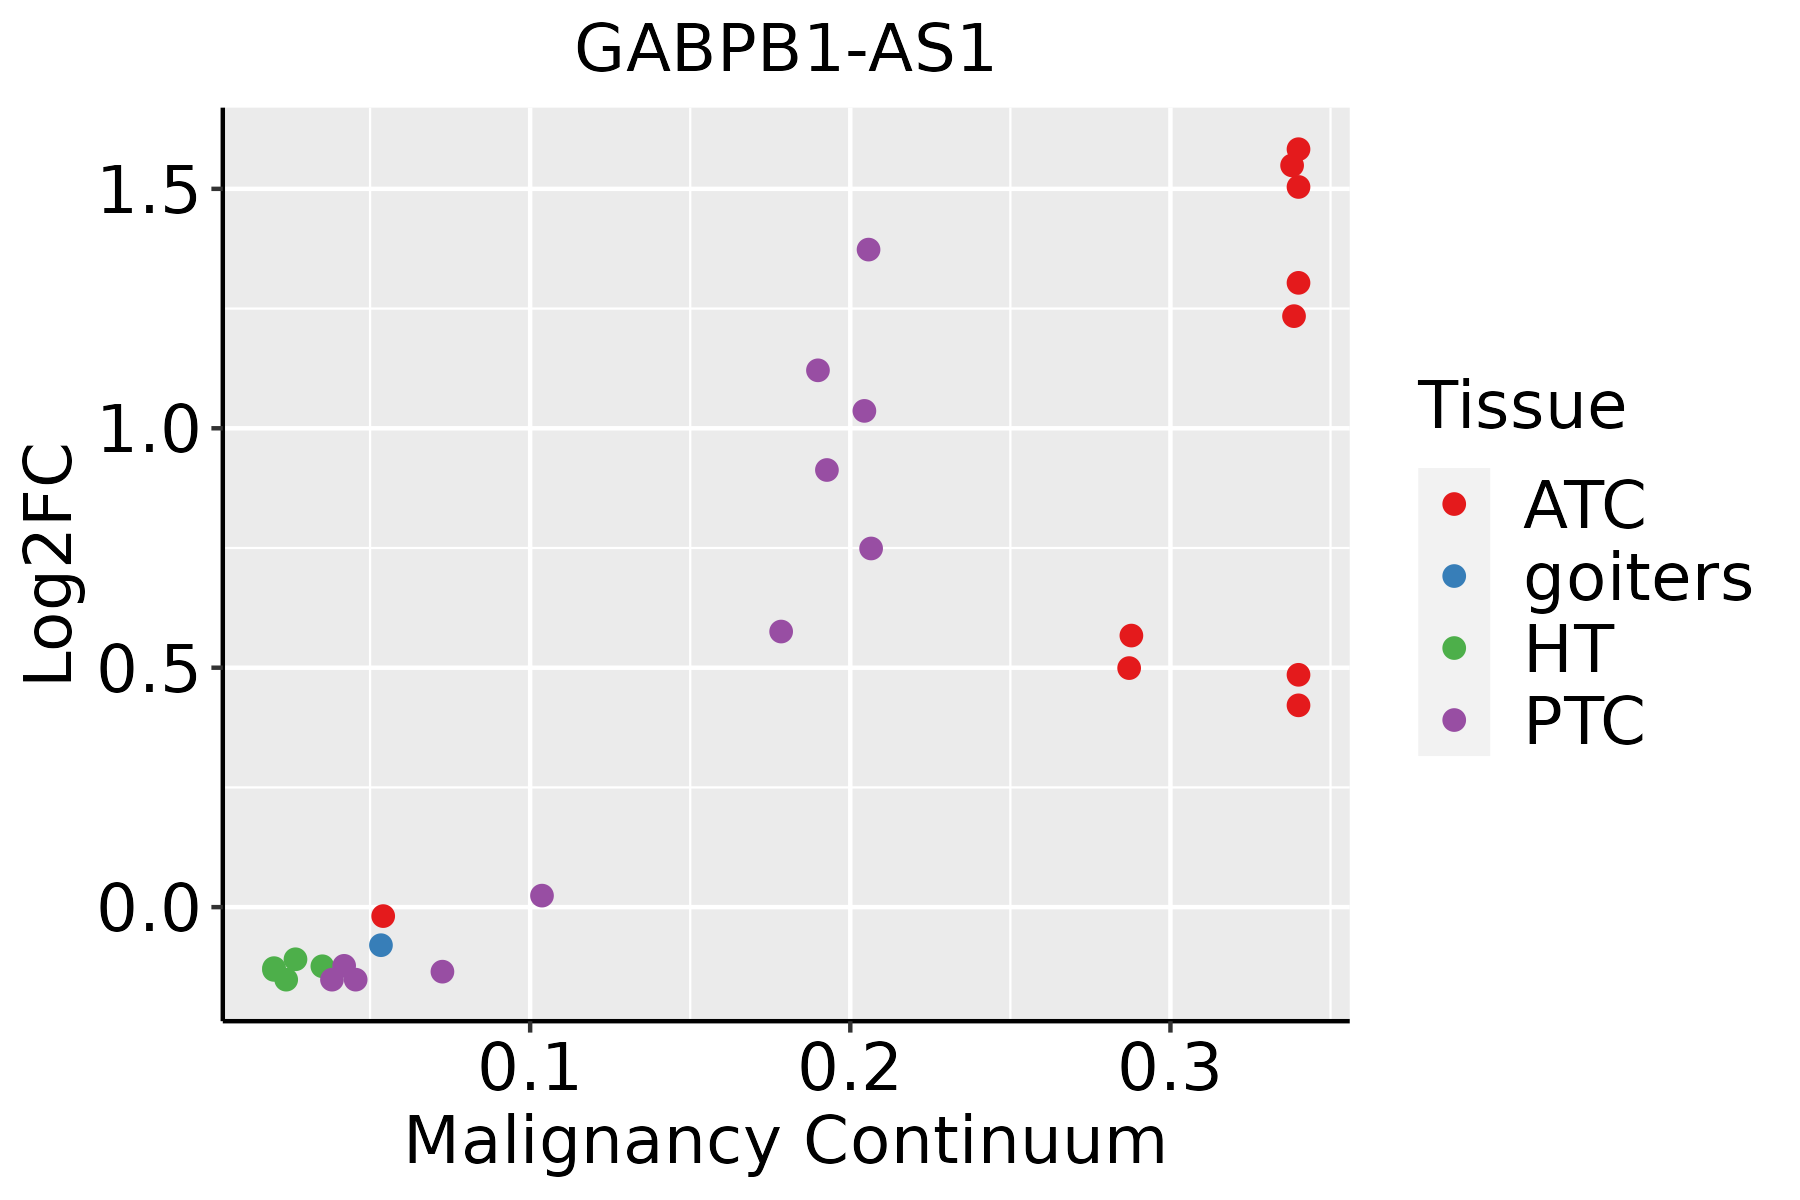 | ATC: Anaplastic thyroid cancer |
| HT: Hashimoto's thyroiditis | ||
| PTC: Papillary thyroid cancer |
| ∗log2FC in expression of this searched gene in stem-like cells from each diseased tissue sample relative to stem-like cells in normal samples in each tissue plotted against the malignancy continuum. Samples are colored based on if they are from different disease stage. |
Top |
Malignant transformation related pathway analysis |
| Find out the enriched GO biological processes and KEGG pathways involved in transition from healthy to precancer to cancer |
| Tissue | Disease Stage | Enriched GO biological Processes |
| Colorectum | AD |  |
| Colorectum | SER |  |
| Colorectum | MSS |  |
| Colorectum | MSI-H |  |
| Colorectum | FAP |  |
| ∗Top 15 enriched GO BP terms are showed in the bar plot of each disease state in each tissue. Each row represents a significant GO biological process which is colored according to the -log10(p.adjust). |
| Page: 1 2 3 4 5 6 7 8 9 |
| GO ID | Tissue | Disease Stage | Description | Gene Ratio | Bg Ratio | pvalue | p.adjust | Count |
| Page: 1 |
| Pathway ID | Tissue | Disease Stage | Description | Gene Ratio | Bg Ratio | pvalue | p.adjust | qvalue | Count |
| Page: 1 |
Top |
Cell-cell communication analysis |
| Identification of potential cell-cell interactions between two cell types and their ligand-receptor pairs for different disease states |
| Ligand | Receptor | LRpair | Pathway | Tissue | Disease Stage |
| Page: 1 |
Top |
Single-cell gene regulatory network inference analysis |
| Find out the significant the regulons (TFs) and the target genes of each regulon across cell types for different disease states |
| TF | Cell Type | Tissue | Disease Stage | Target Gene | RSS | Regulon Activity |
| ∗The dot plots of a searched regulon are shown for all cell subpopulations in each disease state of each tissue based on the regulon specific score inferred using pySCENIC and by calculating the average expression. |
| Page: 1 |
Top |
Somatic mutation of malignant transformation related genes |
| Annotation of somatic variants for genes involved in malignant transformation |
| Hugo Symbol | Variant Class | Variant Classification | dbSNP RS | HGVSc | HGVSp | HGVSp Short | SWISSPROT | BIOTYPE | SIFT | PolyPhen | Tumor Sample Barcode | Tissue | Histology | Sex | Age | Stage | Therapy Types | Drugs | Outcome |
| Page: 1 |
Top |
Related drugs of malignant transformation related genes |
| Identification of chemicals and drugs interact with genes involved in malignant transfromation |
| (DGIdb 4.0) |
| Entrez ID | Symbol | Category | Interaction Types | Drug Claim Name | Drug Name | PMIDs |
| Page: 1 |

Copyright 2023-Present -The University of Texas Health Science Center at Houston |