
|
|||||
|
 | |
| |
| |
| |
| |
| |
|
Gene: FXN |
Gene summary for FXN |
| Gene information | Species | Human | Gene symbol | FXN | Gene ID | 2395 |
| Gene name | frataxin | |
| Gene Alias | CyaY | |
| Cytomap | 9q21.11 | |
| Gene Type | protein-coding | GO ID | GO:0000302 | UniProtAcc | A0A0S2Z3G4 |
Top |
Malignant transformation analysis |
| Identification of the aberrant gene expression in precancerous and cancerous lesions by comparing the gene expression of stem-like cells in diseased tissues with normal stem cells |
| Entrez ID | Symbol | Replicates | Species | Organ | Tissue | Adj P-value | Log2FC | Malignancy |
| 2395 | FXN | HTA11_99999965062_69753 | Human | Colorectum | MSI-H | 1.91e-08 | 8.48e-01 | 0.3487 |
| 2395 | FXN | HTA11_99999965104_69814 | Human | Colorectum | MSS | 8.49e-18 | 4.74e-01 | 0.281 |
| 2395 | FXN | HTA11_99999971662_82457 | Human | Colorectum | MSS | 8.94e-11 | 2.75e-01 | 0.3859 |
| 2395 | FXN | HTA11_99999974143_84620 | Human | Colorectum | MSS | 2.07e-08 | 1.98e-01 | 0.3005 |
| 2395 | FXN | LZE2T | Human | Esophagus | ESCC | 4.73e-03 | 3.88e-01 | 0.082 |
| 2395 | FXN | LZE4T | Human | Esophagus | ESCC | 5.73e-13 | 3.08e-01 | 0.0811 |
| 2395 | FXN | LZE7T | Human | Esophagus | ESCC | 3.98e-06 | 2.74e-01 | 0.0667 |
| 2395 | FXN | LZE24T | Human | Esophagus | ESCC | 4.35e-08 | 1.98e-01 | 0.0596 |
| 2395 | FXN | LZE21T | Human | Esophagus | ESCC | 6.52e-03 | 1.79e-01 | 0.0655 |
| 2395 | FXN | P2T-E | Human | Esophagus | ESCC | 1.82e-40 | 7.45e-01 | 0.1177 |
| 2395 | FXN | P4T-E | Human | Esophagus | ESCC | 7.53e-29 | 5.63e-01 | 0.1323 |
| 2395 | FXN | P5T-E | Human | Esophagus | ESCC | 2.52e-15 | 2.58e-01 | 0.1327 |
| 2395 | FXN | P8T-E | Human | Esophagus | ESCC | 2.10e-07 | 1.50e-01 | 0.0889 |
| 2395 | FXN | P9T-E | Human | Esophagus | ESCC | 1.78e-21 | 3.86e-01 | 0.1131 |
| 2395 | FXN | P10T-E | Human | Esophagus | ESCC | 5.05e-17 | 3.00e-01 | 0.116 |
| 2395 | FXN | P11T-E | Human | Esophagus | ESCC | 2.94e-14 | 3.75e-01 | 0.1426 |
| 2395 | FXN | P12T-E | Human | Esophagus | ESCC | 2.32e-16 | 3.65e-01 | 0.1122 |
| 2395 | FXN | P15T-E | Human | Esophagus | ESCC | 1.83e-09 | 1.98e-01 | 0.1149 |
| 2395 | FXN | P16T-E | Human | Esophagus | ESCC | 2.57e-28 | 4.27e-01 | 0.1153 |
| 2395 | FXN | P17T-E | Human | Esophagus | ESCC | 2.60e-06 | 2.11e-01 | 0.1278 |
| Page: 1 2 3 4 5 6 |
| Tissue | Expression Dynamics | Abbreviation |
| Colorectum (GSE201348) |  | FAP: Familial adenomatous polyposis |
| CRC: Colorectal cancer | ||
| Colorectum (HTA11) |  | AD: Adenomas |
| SER: Sessile serrated lesions | ||
| MSI-H: Microsatellite-high colorectal cancer | ||
| MSS: Microsatellite stable colorectal cancer | ||
| Esophagus | 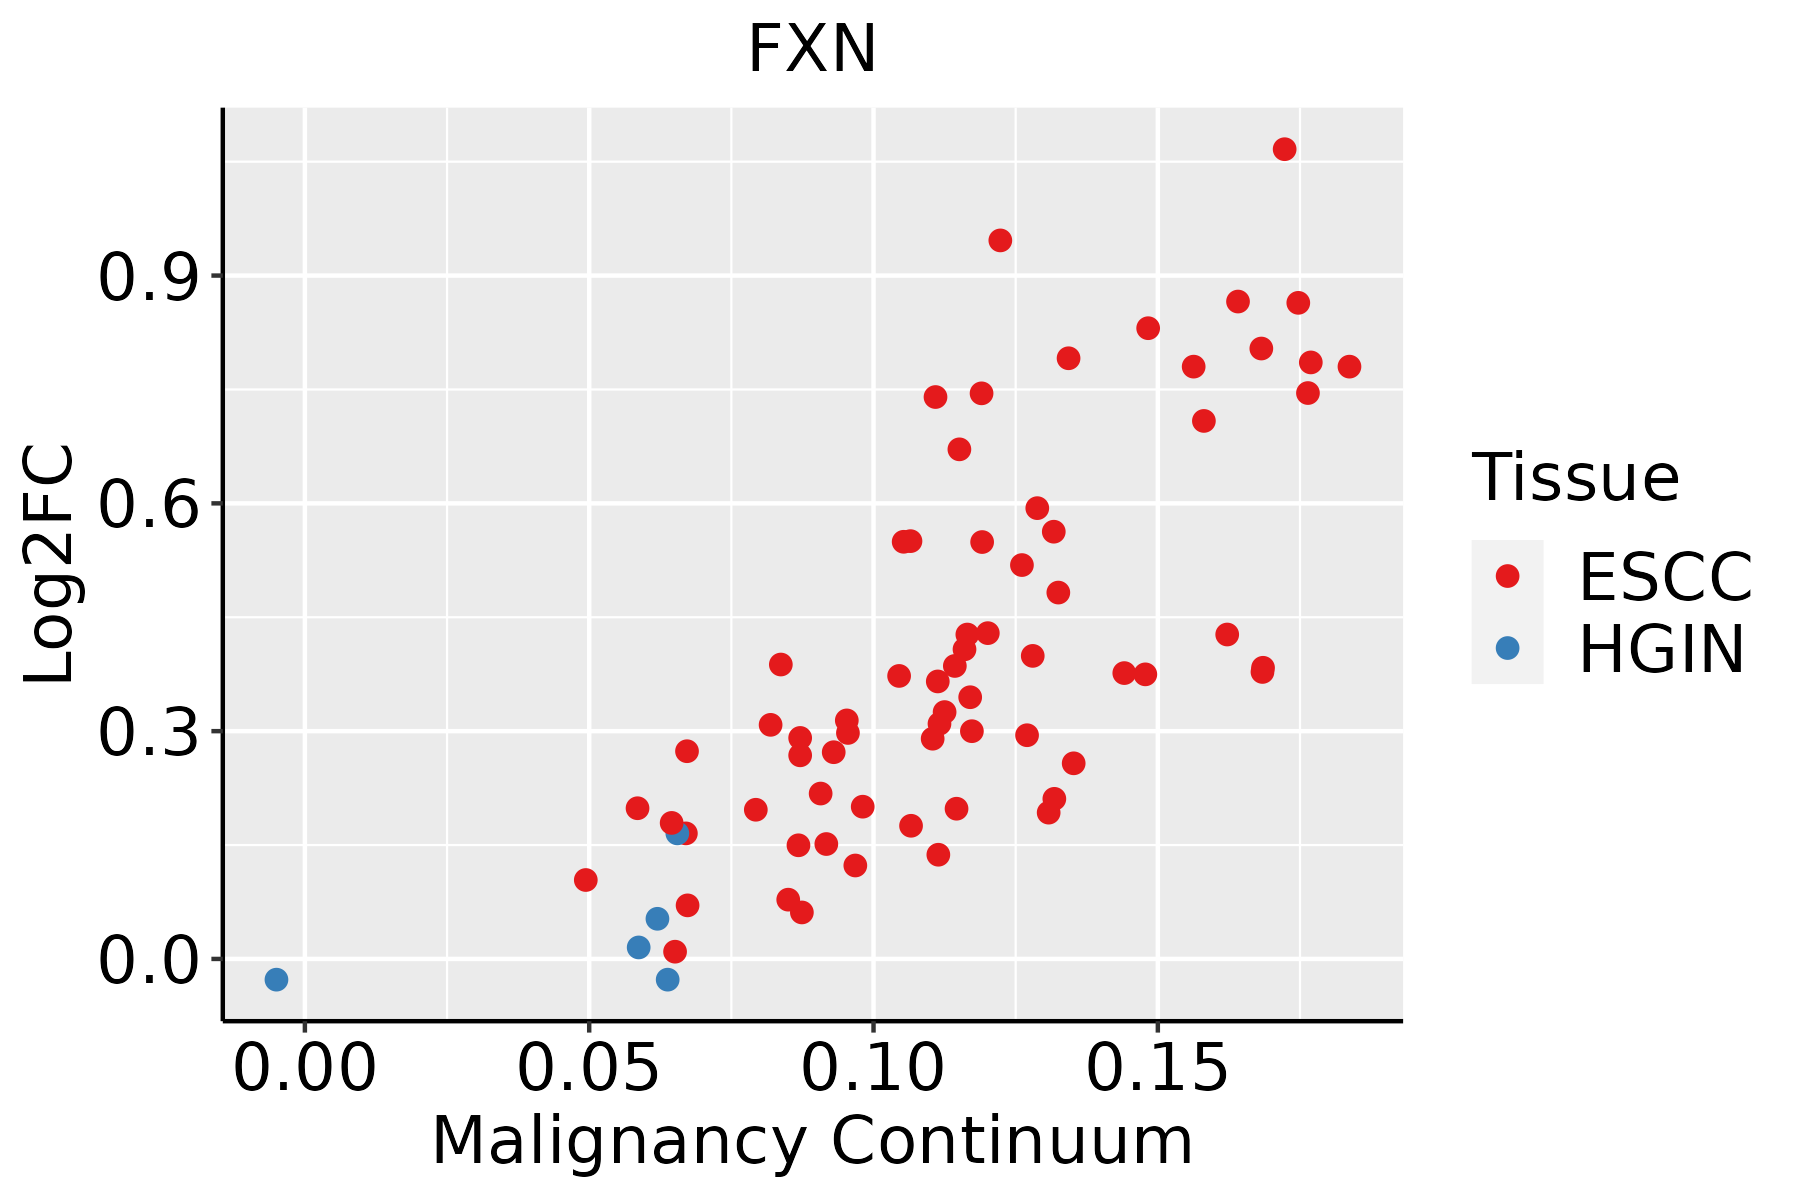 | ESCC: Esophageal squamous cell carcinoma |
| HGIN: High-grade intraepithelial neoplasias | ||
| LGIN: Low-grade intraepithelial neoplasias | ||
| Liver | 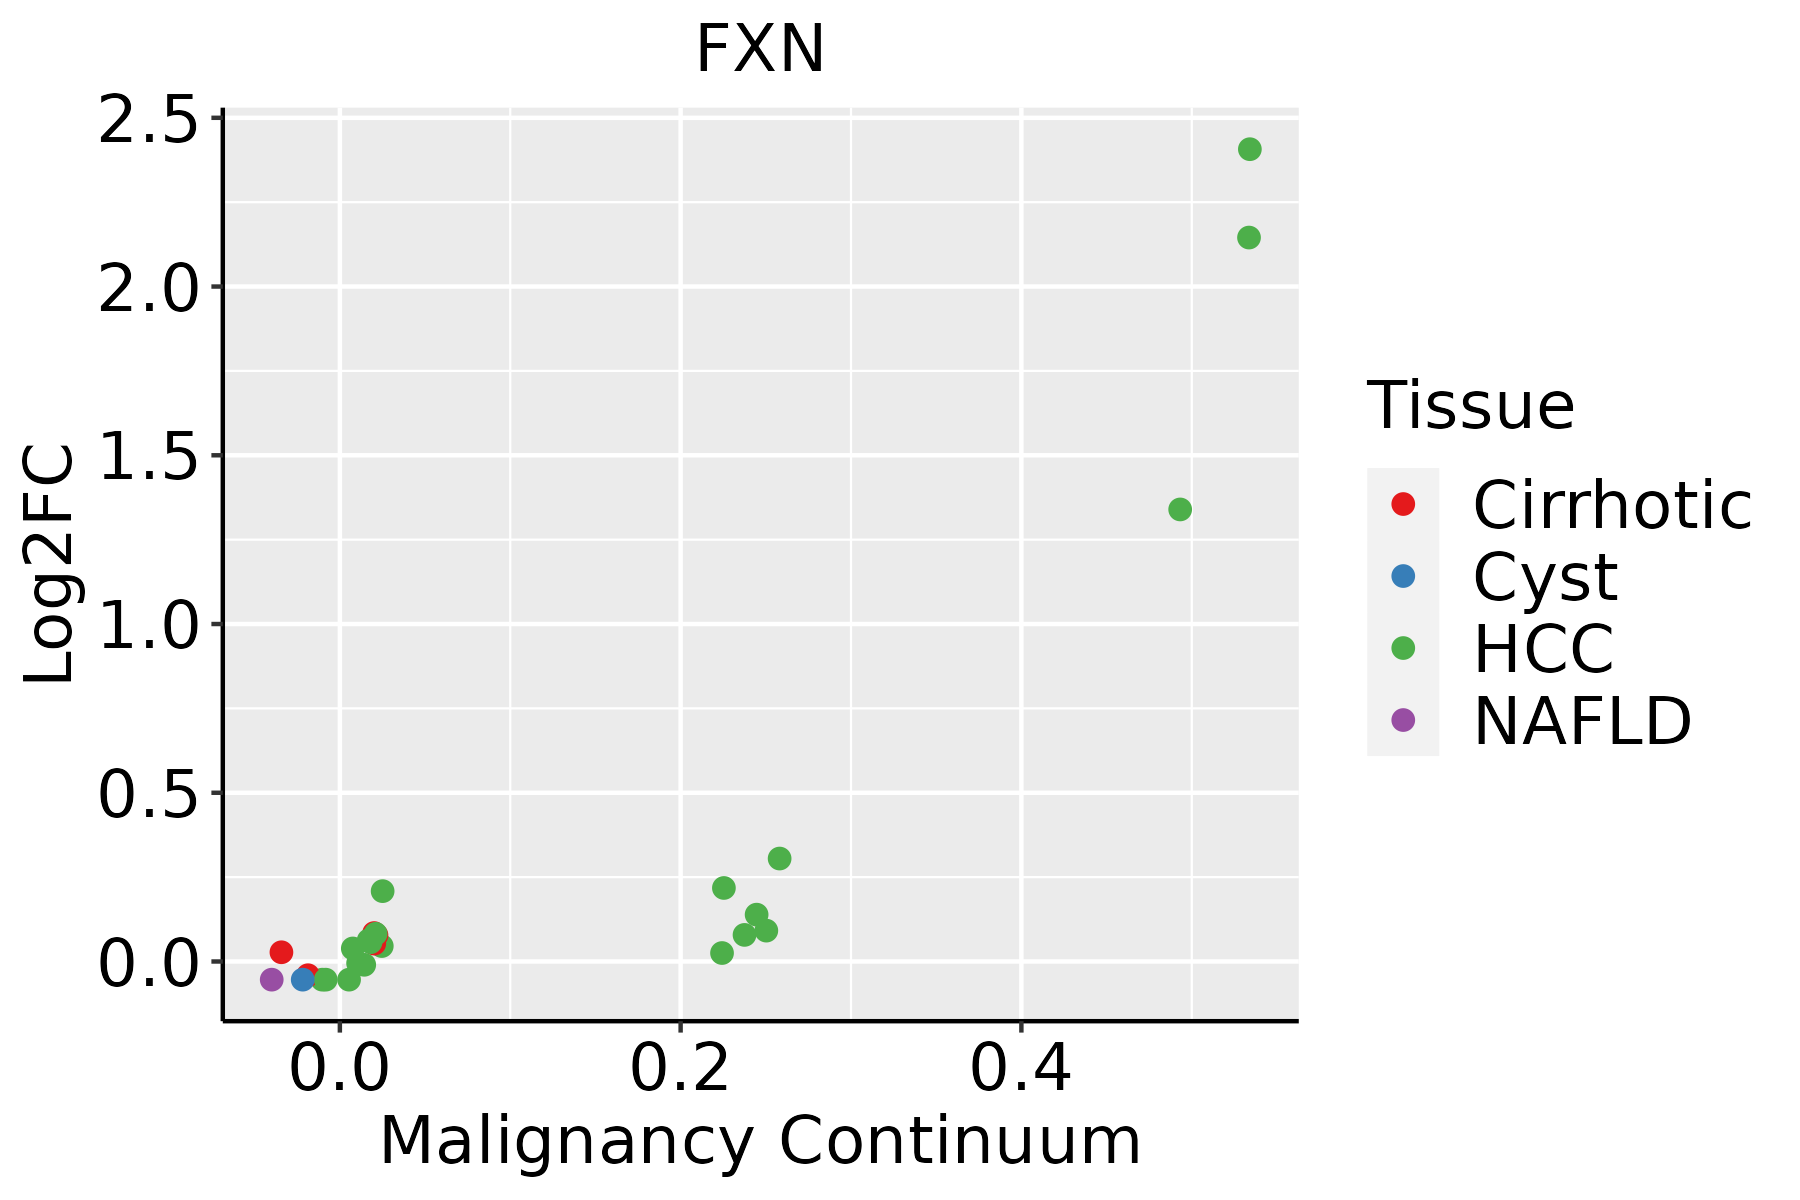 | HCC: Hepatocellular carcinoma |
| NAFLD: Non-alcoholic fatty liver disease | ||
| Oral Cavity | 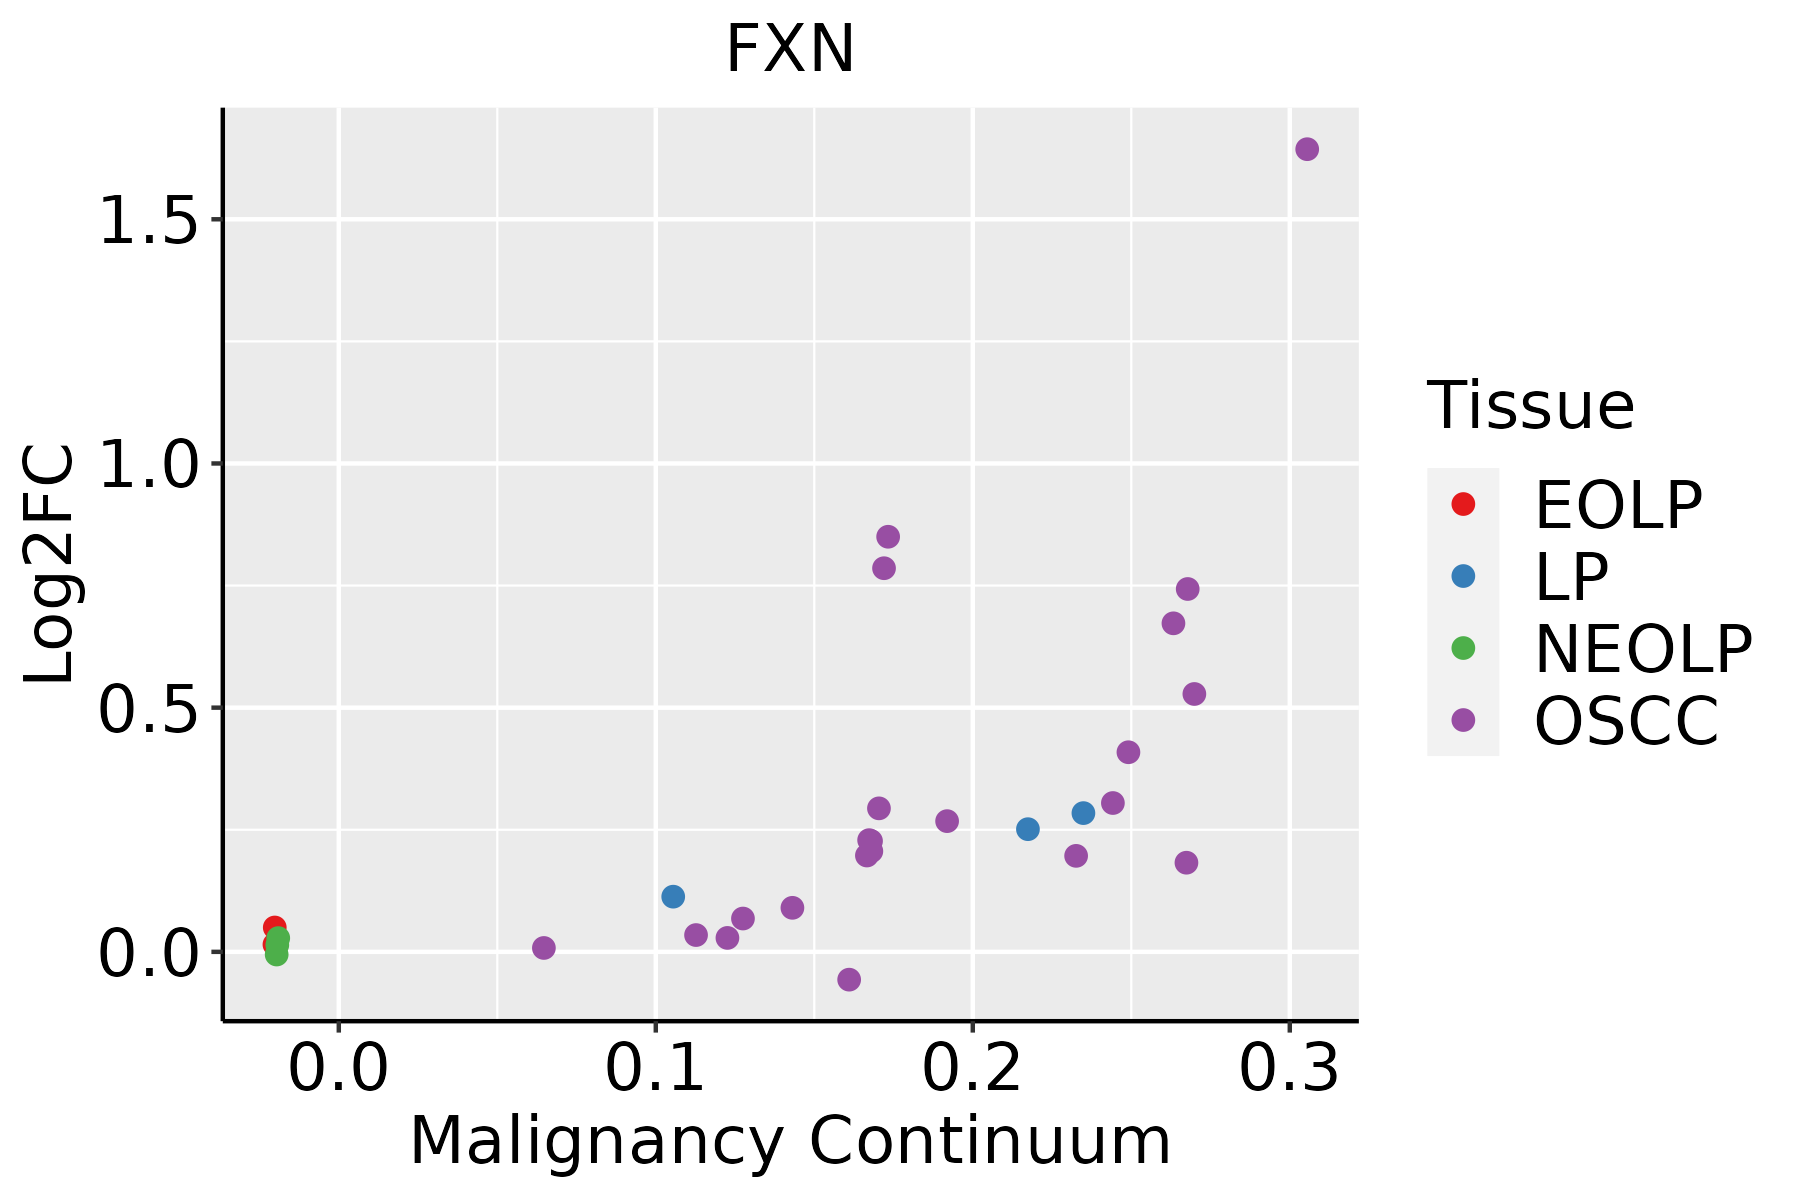 | EOLP: Erosive Oral lichen planus |
| LP: leukoplakia | ||
| NEOLP: Non-erosive oral lichen planus | ||
| OSCC: Oral squamous cell carcinoma |
| ∗log2FC in expression of this searched gene in stem-like cells from each diseased tissue sample relative to stem-like cells in normal samples in each tissue plotted against the malignancy continuum. Samples are colored based on if they are from different disease stage. |
Top |
Malignant transformation related pathway analysis |
| Find out the enriched GO biological processes and KEGG pathways involved in transition from healthy to precancer to cancer |
| Tissue | Disease Stage | Enriched GO biological Processes |
| Colorectum | AD |  |
| Colorectum | SER |  |
| Colorectum | MSS |  |
| Colorectum | MSI-H |  |
| Colorectum | FAP |  |
| ∗Top 15 enriched GO BP terms are showed in the bar plot of each disease state in each tissue. Each row represents a significant GO biological process which is colored according to the -log10(p.adjust). |
| Page: 1 2 3 4 5 6 7 8 9 |
| GO ID | Tissue | Disease Stage | Description | Gene Ratio | Bg Ratio | pvalue | p.adjust | Count |
| GO:0046034 | Colorectum | AD | ATP metabolic process | 142/3918 | 277/18723 | 2.64e-29 | 8.26e-26 | 142 |
| GO:0006091 | Colorectum | AD | generation of precursor metabolites and energy | 209/3918 | 490/18723 | 3.17e-28 | 6.61e-25 | 209 |
| GO:0009060 | Colorectum | AD | aerobic respiration | 108/3918 | 189/18723 | 9.14e-28 | 1.43e-24 | 108 |
| GO:0045333 | Colorectum | AD | cellular respiration | 119/3918 | 230/18723 | 3.21e-25 | 4.02e-22 | 119 |
| GO:0006119 | Colorectum | AD | oxidative phosphorylation | 83/3918 | 141/18723 | 7.95e-23 | 8.30e-20 | 83 |
| GO:0015980 | Colorectum | AD | energy derivation by oxidation of organic compounds | 143/3918 | 318/18723 | 2.78e-22 | 2.49e-19 | 143 |
| GO:0006839 | Colorectum | AD | mitochondrial transport | 102/3918 | 254/18723 | 1.87e-12 | 3.08e-10 | 102 |
| GO:0006979 | Colorectum | AD | response to oxidative stress | 145/3918 | 446/18723 | 5.16e-09 | 3.23e-07 | 145 |
| GO:1990542 | Colorectum | AD | mitochondrial transmembrane transport | 47/3918 | 102/18723 | 1.09e-08 | 6.52e-07 | 47 |
| GO:2001233 | Colorectum | AD | regulation of apoptotic signaling pathway | 119/3918 | 356/18723 | 2.14e-08 | 1.21e-06 | 119 |
| GO:0010639 | Colorectum | AD | negative regulation of organelle organization | 114/3918 | 348/18723 | 1.41e-07 | 6.49e-06 | 114 |
| GO:0010821 | Colorectum | AD | regulation of mitochondrion organization | 57/3918 | 144/18723 | 2.43e-07 | 9.92e-06 | 57 |
| GO:0062197 | Colorectum | AD | cellular response to chemical stress | 109/3918 | 337/18723 | 5.33e-07 | 1.95e-05 | 109 |
| GO:0000302 | Colorectum | AD | response to reactive oxygen species | 78/3918 | 222/18723 | 6.17e-07 | 2.21e-05 | 78 |
| GO:0055076 | Colorectum | AD | transition metal ion homeostasis | 53/3918 | 138/18723 | 1.89e-06 | 5.65e-05 | 53 |
| GO:0034599 | Colorectum | AD | cellular response to oxidative stress | 94/3918 | 288/18723 | 2.03e-06 | 6.02e-05 | 94 |
| GO:0016049 | Colorectum | AD | cell growth | 143/3918 | 482/18723 | 2.83e-06 | 8.09e-05 | 143 |
| GO:0001558 | Colorectum | AD | regulation of cell growth | 124/3918 | 414/18723 | 7.67e-06 | 1.86e-04 | 124 |
| GO:0008637 | Colorectum | AD | apoptotic mitochondrial changes | 42/3918 | 107/18723 | 1.13e-05 | 2.56e-04 | 42 |
| GO:2001234 | Colorectum | AD | negative regulation of apoptotic signaling pathway | 74/3918 | 224/18723 | 1.49e-05 | 3.18e-04 | 74 |
| Page: 1 2 3 4 5 6 7 8 9 10 11 12 13 14 15 |
| Pathway ID | Tissue | Disease Stage | Description | Gene Ratio | Bg Ratio | pvalue | p.adjust | qvalue | Count |
| Page: 1 |
Top |
Cell-cell communication analysis |
| Identification of potential cell-cell interactions between two cell types and their ligand-receptor pairs for different disease states |
| Ligand | Receptor | LRpair | Pathway | Tissue | Disease Stage |
| Page: 1 |
Top |
Single-cell gene regulatory network inference analysis |
| Find out the significant the regulons (TFs) and the target genes of each regulon across cell types for different disease states |
| TF | Cell Type | Tissue | Disease Stage | Target Gene | RSS | Regulon Activity |
| ∗The dot plots of a searched regulon are shown for all cell subpopulations in each disease state of each tissue based on the regulon specific score inferred using pySCENIC and by calculating the average expression. |
| Page: 1 |
Top |
Somatic mutation of malignant transformation related genes |
| Annotation of somatic variants for genes involved in malignant transformation |
| Hugo Symbol | Variant Class | Variant Classification | dbSNP RS | HGVSc | HGVSp | HGVSp Short | SWISSPROT | BIOTYPE | SIFT | PolyPhen | Tumor Sample Barcode | Tissue | Histology | Sex | Age | Stage | Therapy Types | Drugs | Outcome |
| FXN | SNV | Missense_Mutation | novel | c.485G>A | p.Gly162Glu | p.G162E | Q16595 | protein_coding | deleterious(0.02) | probably_damaging(1) | TCGA-C8-A26X-01 | Breast | breast invasive carcinoma | Female | <65 | I/II | Chemotherapy | 5-fluorouracil | CR |
| FXN | SNV | Missense_Mutation | rs551991546 | c.446C>T | p.Thr149Met | p.T149M | Q16595 | protein_coding | deleterious(0) | probably_damaging(1) | TCGA-AA-A022-01 | Colorectum | colon adenocarcinoma | Female | >=65 | I/II | Unknown | Unknown | SD |
| FXN | SNV | Missense_Mutation | c.320N>T | p.Ala107Val | p.A107V | Q16595 | protein_coding | deleterious(0.02) | possibly_damaging(0.571) | TCGA-AY-6197-01 | Colorectum | colon adenocarcinoma | Male | <65 | I/II | Unknown | Unknown | SD | |
| FXN | SNV | Missense_Mutation | novel | c.392N>C | p.Val131Ala | p.V131A | Q16595 | protein_coding | deleterious(0.02) | probably_damaging(0.991) | TCGA-D5-6540-01 | Colorectum | colon adenocarcinoma | Male | >=65 | I/II | Unknown | Unknown | SD |
| FXN | SNV | Missense_Mutation | novel | c.470N>A | p.Ser157Tyr | p.S157Y | Q16595 | protein_coding | deleterious(0) | probably_damaging(0.999) | TCGA-A5-A0G2-01 | Endometrium | uterine corpus endometrioid carcinoma | Female | <65 | III/IV | Unknown | Unknown | SD |
| FXN | SNV | Missense_Mutation | novel | c.560N>T | p.Ala187Val | p.A187V | Q16595 | protein_coding | deleterious(0.03) | benign(0.164) | TCGA-A5-A0G2-01 | Endometrium | uterine corpus endometrioid carcinoma | Female | <65 | III/IV | Unknown | Unknown | SD |
| FXN | SNV | Missense_Mutation | novel | c.242N>A | p.Ser81Tyr | p.S81Y | Q16595 | protein_coding | deleterious(0) | benign(0.133) | TCGA-A5-A2K5-01 | Endometrium | uterine corpus endometrioid carcinoma | Female | >=65 | I/II | Unknown | Unknown | SD |
| FXN | SNV | Missense_Mutation | novel | c.502N>C | p.Trp168Arg | p.W168R | Q16595 | protein_coding | deleterious(0.02) | benign(0.11) | TCGA-AP-A054-01 | Endometrium | uterine corpus endometrioid carcinoma | Female | <65 | III/IV | Chemotherapy | carboplatin | PD |
| FXN | SNV | Missense_Mutation | c.482G>T | p.Ser161Ile | p.S161I | Q16595 | protein_coding | deleterious(0) | probably_damaging(0.979) | TCGA-B5-A11Y-01 | Endometrium | uterine corpus endometrioid carcinoma | Female | <65 | I/II | Unknown | Unknown | SD | |
| FXN | SNV | Missense_Mutation | c.327T>A | p.Phe109Leu | p.F109L | Q16595 | protein_coding | deleterious(0.04) | possibly_damaging(0.758) | TCGA-D1-A17Q-01 | Endometrium | uterine corpus endometrioid carcinoma | Female | <65 | I/II | Unknown | Unknown | SD |
| Page: 1 2 |
Top |
Related drugs of malignant transformation related genes |
| Identification of chemicals and drugs interact with genes involved in malignant transfromation |
| (DGIdb 4.0) |
| Entrez ID | Symbol | Category | Interaction Types | Drug Claim Name | Drug Name | PMIDs |
| 2395 | FXN | TRANSPORTER, ENZYME | CISPLATIN | CISPLATIN | 12928720 | |
| 2395 | FXN | TRANSPORTER, ENZYME | ERYTHROPOIETIN | EPOETIN BETA | 16269021 |
| Page: 1 |

Copyright 2023-Present -The University of Texas Health Science Center at Houston |