
|
|||||
|
 | |
| |
| |
| |
| |
| |
|
Gene: FLYWCH1 |
Gene summary for FLYWCH1 |
| Gene information | Species | Human | Gene symbol | FLYWCH1 | Gene ID | 84256 |
| Gene name | FLYWCH-type zinc finger 1 | |
| Gene Alias | FLYWCH1 | |
| Cytomap | 16p13.3 | |
| Gene Type | protein-coding | GO ID | GO:0005575 | UniProtAcc | Q4VC44 |
Top |
Malignant transformation analysis |
| Identification of the aberrant gene expression in precancerous and cancerous lesions by comparing the gene expression of stem-like cells in diseased tissues with normal stem cells |
| Entrez ID | Symbol | Replicates | Species | Organ | Tissue | Adj P-value | Log2FC | Malignancy |
| 84256 | FLYWCH1 | P26T-E | Human | Esophagus | ESCC | 1.29e-12 | 2.42e-01 | 0.1276 |
| 84256 | FLYWCH1 | P27T-E | Human | Esophagus | ESCC | 3.27e-08 | 1.77e-01 | 0.1055 |
| 84256 | FLYWCH1 | P28T-E | Human | Esophagus | ESCC | 1.68e-18 | 3.29e-01 | 0.1149 |
| 84256 | FLYWCH1 | P30T-E | Human | Esophagus | ESCC | 1.59e-22 | 7.99e-01 | 0.137 |
| 84256 | FLYWCH1 | P31T-E | Human | Esophagus | ESCC | 3.00e-03 | 6.76e-02 | 0.1251 |
| 84256 | FLYWCH1 | P32T-E | Human | Esophagus | ESCC | 1.00e-17 | 3.13e-01 | 0.1666 |
| 84256 | FLYWCH1 | P36T-E | Human | Esophagus | ESCC | 2.06e-09 | 2.92e-01 | 0.1187 |
| 84256 | FLYWCH1 | P37T-E | Human | Esophagus | ESCC | 3.78e-08 | 1.58e-01 | 0.1371 |
| 84256 | FLYWCH1 | P39T-E | Human | Esophagus | ESCC | 1.15e-06 | 1.14e-01 | 0.0894 |
| 84256 | FLYWCH1 | P40T-E | Human | Esophagus | ESCC | 2.41e-07 | 3.35e-01 | 0.109 |
| 84256 | FLYWCH1 | P42T-E | Human | Esophagus | ESCC | 2.90e-12 | 3.91e-01 | 0.1175 |
| 84256 | FLYWCH1 | P47T-E | Human | Esophagus | ESCC | 1.87e-11 | 2.43e-01 | 0.1067 |
| 84256 | FLYWCH1 | P48T-E | Human | Esophagus | ESCC | 1.45e-22 | 3.34e-01 | 0.0959 |
| 84256 | FLYWCH1 | P49T-E | Human | Esophagus | ESCC | 1.58e-08 | 7.67e-01 | 0.1768 |
| 84256 | FLYWCH1 | P52T-E | Human | Esophagus | ESCC | 1.61e-16 | 3.35e-01 | 0.1555 |
| 84256 | FLYWCH1 | P54T-E | Human | Esophagus | ESCC | 1.35e-06 | 2.35e-01 | 0.0975 |
| 84256 | FLYWCH1 | P57T-E | Human | Esophagus | ESCC | 2.73e-15 | 2.28e-01 | 0.0926 |
| 84256 | FLYWCH1 | P61T-E | Human | Esophagus | ESCC | 5.21e-08 | 1.55e-01 | 0.099 |
| 84256 | FLYWCH1 | P62T-E | Human | Esophagus | ESCC | 1.06e-39 | 6.99e-01 | 0.1302 |
| 84256 | FLYWCH1 | P65T-E | Human | Esophagus | ESCC | 5.29e-16 | 3.57e-01 | 0.0978 |
| Page: 1 2 3 4 |
| Tissue | Expression Dynamics | Abbreviation |
| Esophagus | 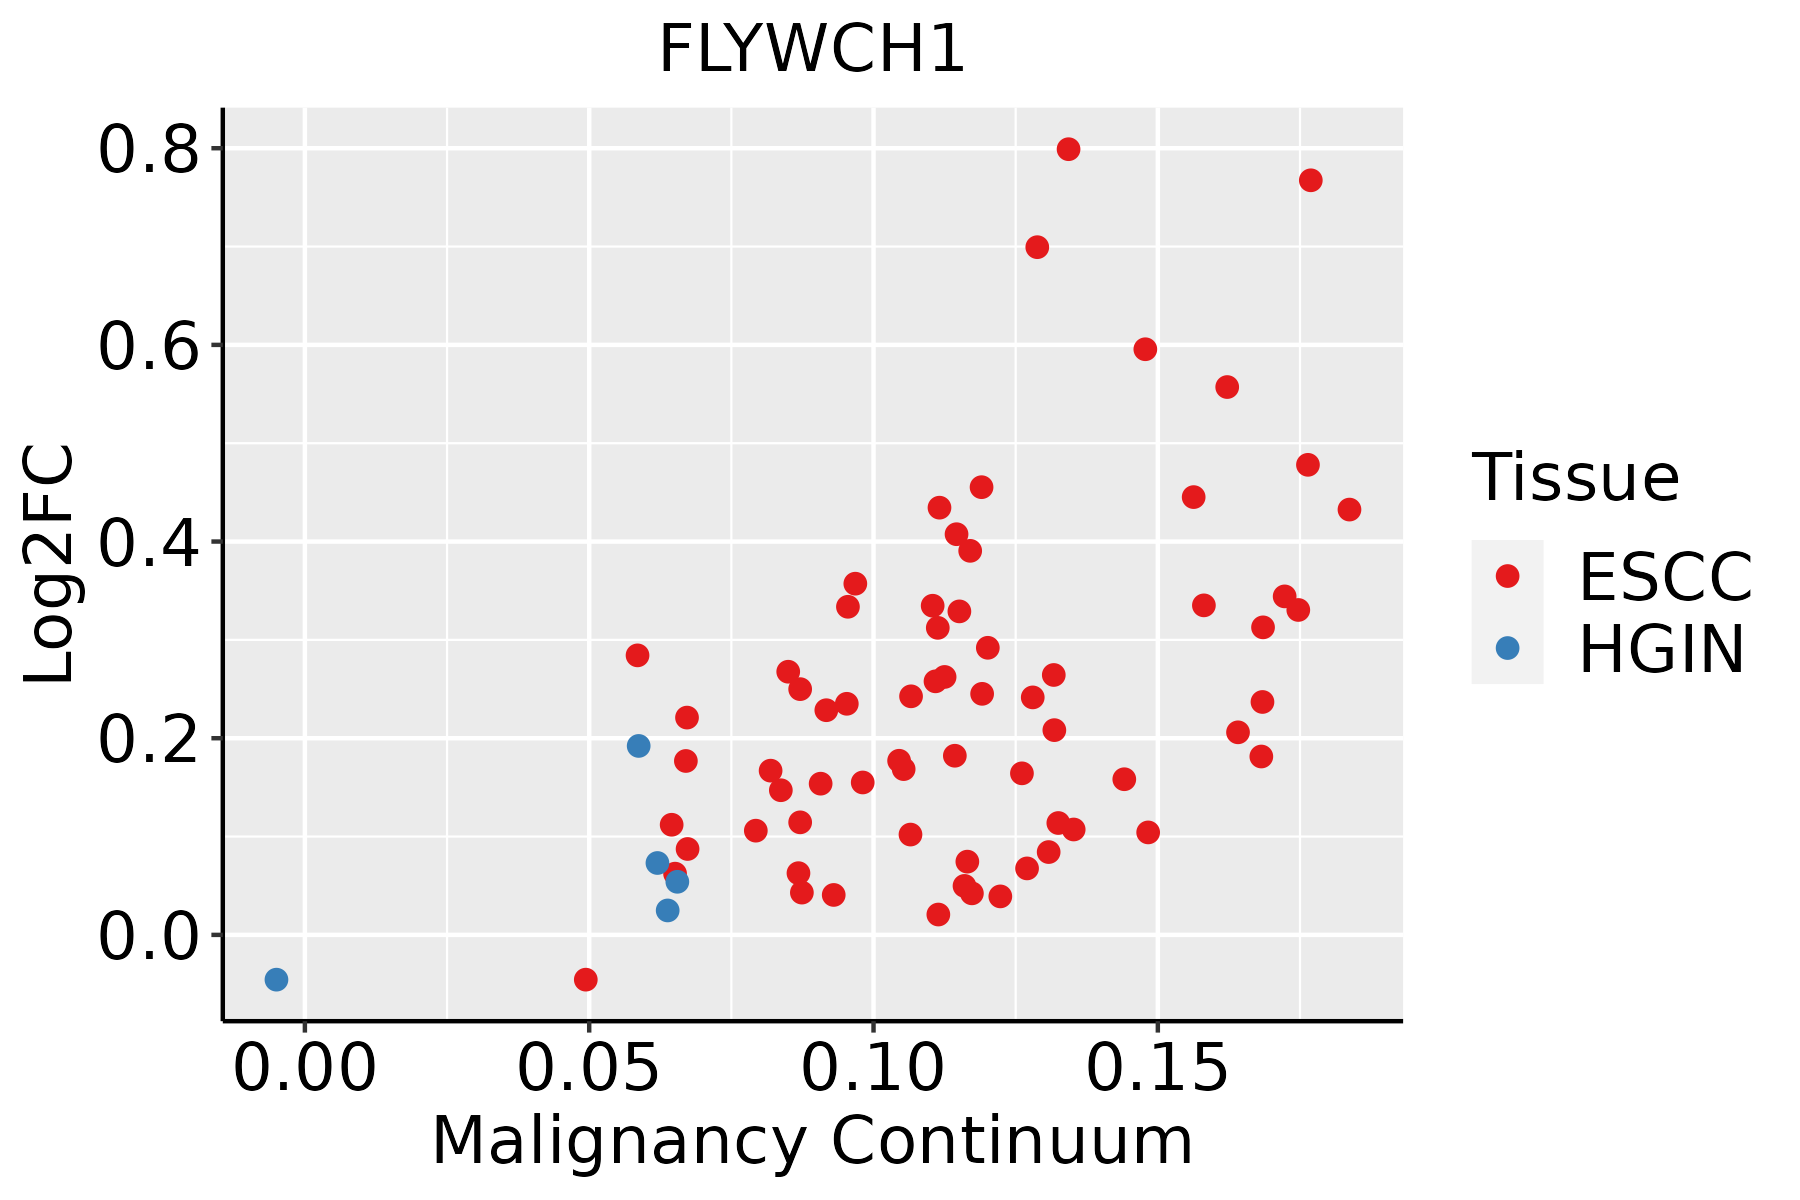 | ESCC: Esophageal squamous cell carcinoma |
| HGIN: High-grade intraepithelial neoplasias | ||
| LGIN: Low-grade intraepithelial neoplasias | ||
| Liver | 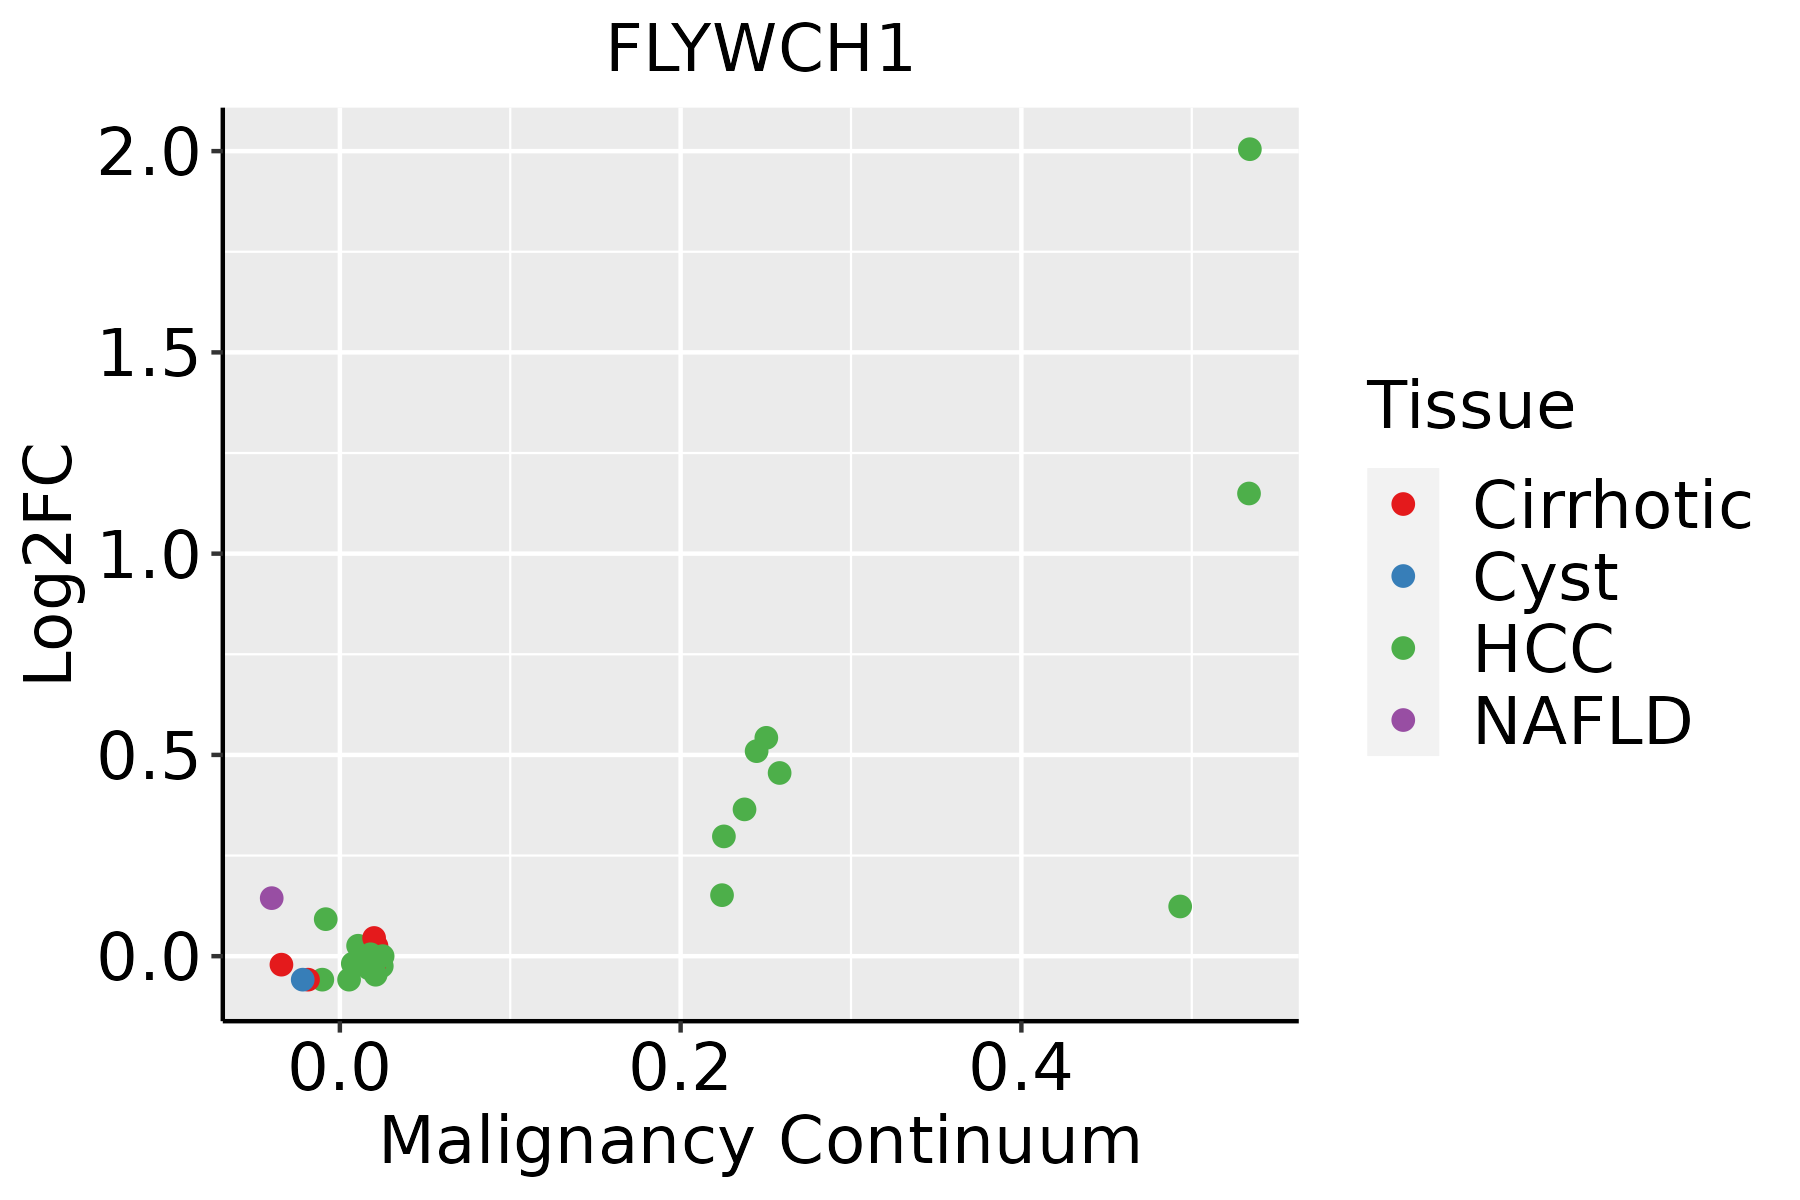 | HCC: Hepatocellular carcinoma |
| NAFLD: Non-alcoholic fatty liver disease | ||
| Oral Cavity | 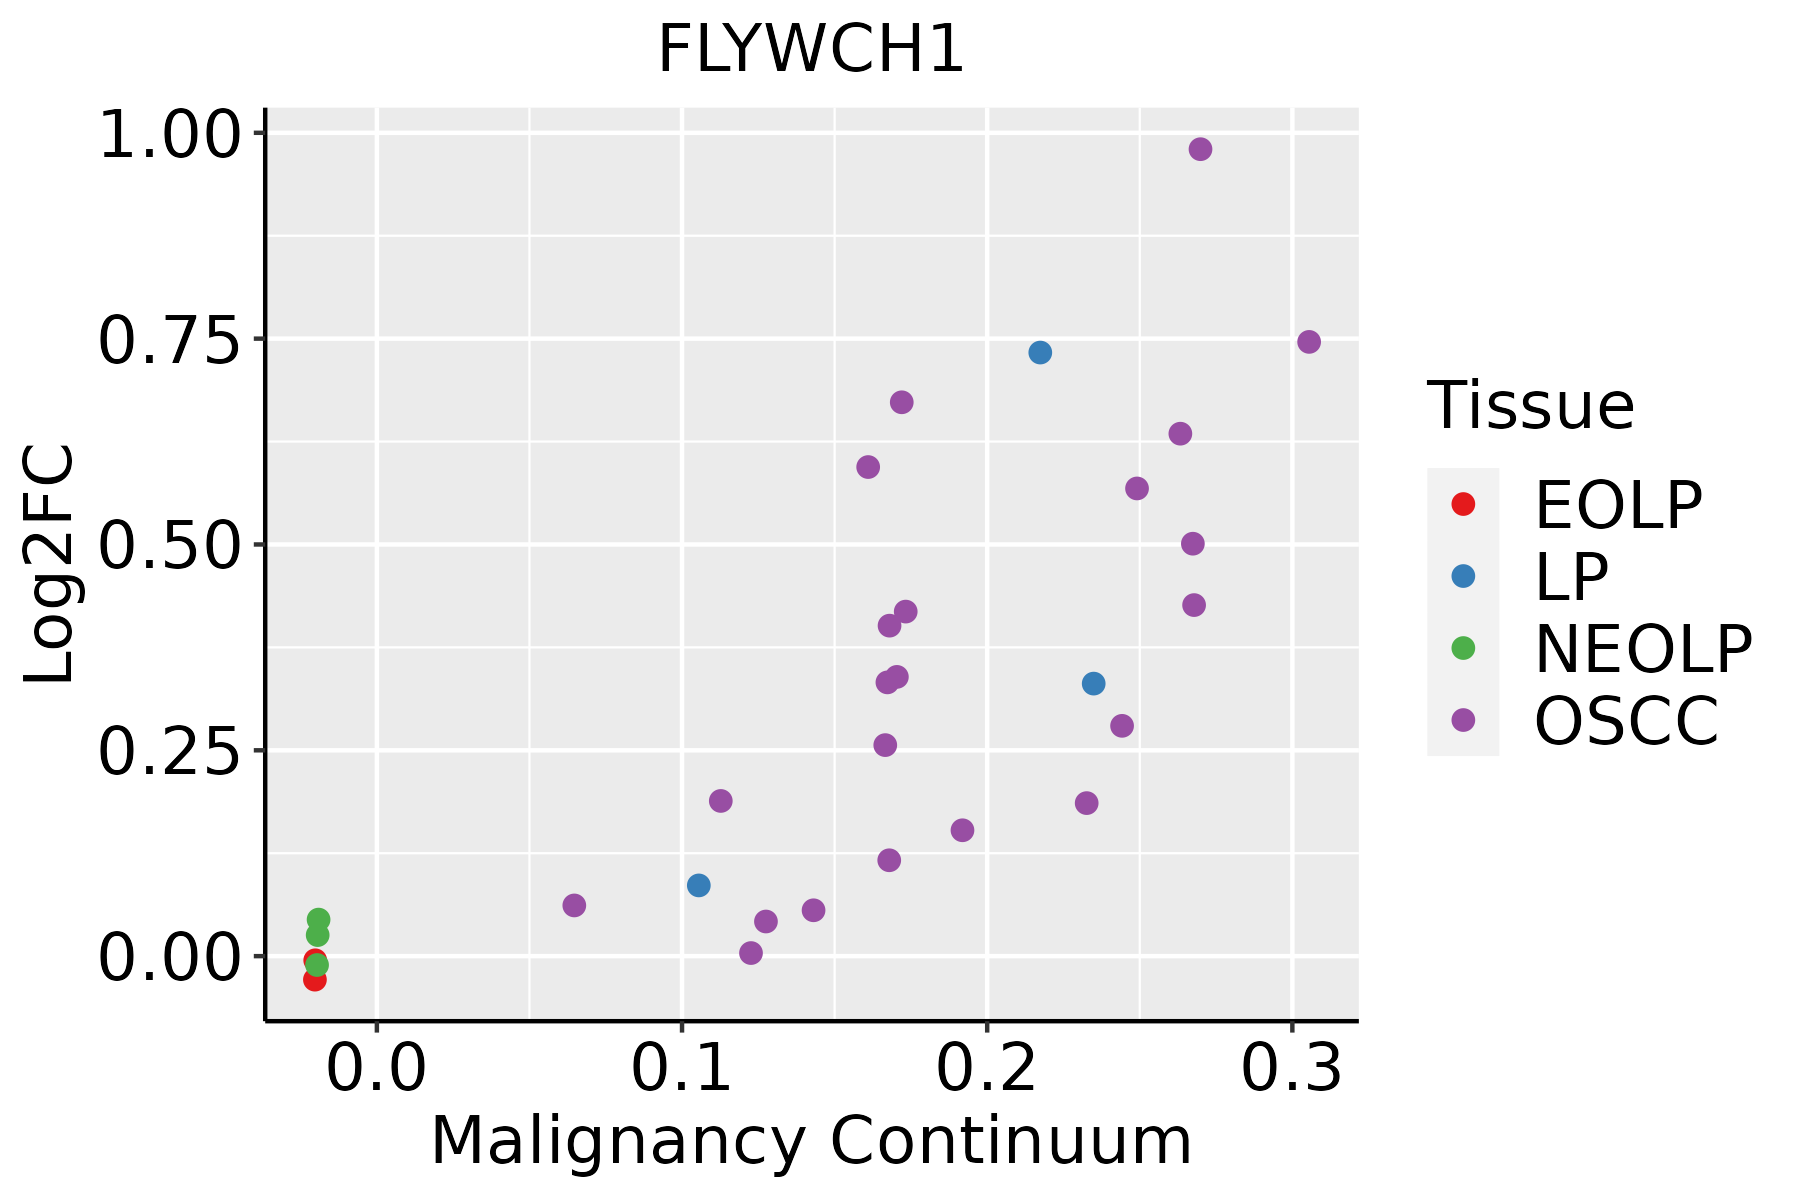 | EOLP: Erosive Oral lichen planus |
| LP: leukoplakia | ||
| NEOLP: Non-erosive oral lichen planus | ||
| OSCC: Oral squamous cell carcinoma |
| ∗log2FC in expression of this searched gene in stem-like cells from each diseased tissue sample relative to stem-like cells in normal samples in each tissue plotted against the malignancy continuum. Samples are colored based on if they are from different disease stage. |
Top |
Malignant transformation related pathway analysis |
| Find out the enriched GO biological processes and KEGG pathways involved in transition from healthy to precancer to cancer |
| Tissue | Disease Stage | Enriched GO biological Processes |
| Colorectum | AD |  |
| Colorectum | SER |  |
| Colorectum | MSS |  |
| Colorectum | MSI-H |  |
| Colorectum | FAP |  |
| ∗Top 15 enriched GO BP terms are showed in the bar plot of each disease state in each tissue. Each row represents a significant GO biological process which is colored according to the -log10(p.adjust). |
| Page: 1 2 3 4 5 6 7 8 9 |
| GO ID | Tissue | Disease Stage | Description | Gene Ratio | Bg Ratio | pvalue | p.adjust | Count |
| Page: 1 |
| Pathway ID | Tissue | Disease Stage | Description | Gene Ratio | Bg Ratio | pvalue | p.adjust | qvalue | Count |
| Page: 1 |
Top |
Cell-cell communication analysis |
| Identification of potential cell-cell interactions between two cell types and their ligand-receptor pairs for different disease states |
| Ligand | Receptor | LRpair | Pathway | Tissue | Disease Stage |
| Page: 1 |
Top |
Single-cell gene regulatory network inference analysis |
| Find out the significant the regulons (TFs) and the target genes of each regulon across cell types for different disease states |
| TF | Cell Type | Tissue | Disease Stage | Target Gene | RSS | Regulon Activity |
| ∗The dot plots of a searched regulon are shown for all cell subpopulations in each disease state of each tissue based on the regulon specific score inferred using pySCENIC and by calculating the average expression. |
| Page: 1 |
Top |
Somatic mutation of malignant transformation related genes |
| Annotation of somatic variants for genes involved in malignant transformation |
| Hugo Symbol | Variant Class | Variant Classification | dbSNP RS | HGVSc | HGVSp | HGVSp Short | SWISSPROT | BIOTYPE | SIFT | PolyPhen | Tumor Sample Barcode | Tissue | Histology | Sex | Age | Stage | Therapy Types | Drugs | Outcome |
| FLYWCH1 | SNV | Missense_Mutation | novel | c.303N>C | p.Gln101His | p.Q101H | Q4VC44 | protein_coding | tolerated_low_confidence(0.17) | benign(0) | TCGA-AC-A23H-01 | Breast | breast invasive carcinoma | Female | >=65 | I/II | Unknown | Unknown | PD |
| FLYWCH1 | SNV | Missense_Mutation | c.1811N>T | p.Ser604Phe | p.S604F | Q4VC44 | protein_coding | deleterious(0) | probably_damaging(0.914) | TCGA-BH-A0W7-01 | Breast | breast invasive carcinoma | Female | <65 | I/II | Chemotherapy | taxotere | CR | |
| FLYWCH1 | SNV | Missense_Mutation | rs371092849 | c.814N>A | p.Glu272Lys | p.E272K | Q4VC44 | protein_coding | deleterious(0.05) | probably_damaging(0.959) | TCGA-E9-A1R2-01 | Breast | breast invasive carcinoma | Female | <65 | III/IV | Chemotherapy | taxotere | CR |
| FLYWCH1 | SNV | Missense_Mutation | c.2092N>A | p.Glu698Lys | p.E698K | Q4VC44 | protein_coding | tolerated_low_confidence(0.06) | possibly_damaging(0.636) | TCGA-GM-A2D9-01 | Breast | breast invasive carcinoma | Female | >=65 | I/II | Hormone Therapy | arimidex | SD | |
| FLYWCH1 | SNV | Missense_Mutation | novel | c.1780N>A | p.Pro594Thr | p.P594T | Q4VC44 | protein_coding | tolerated(0.38) | benign(0.003) | TCGA-PL-A8LZ-01 | Breast | breast invasive carcinoma | Female | <65 | III/IV | Chemotherapy | paclitaxel | SD |
| FLYWCH1 | SNV | Missense_Mutation | rs766048567 | c.1615N>C | p.Thr539Pro | p.T539P | Q4VC44 | protein_coding | deleterious(0.05) | probably_damaging(0.995) | TCGA-S3-A6ZG-01 | Breast | breast invasive carcinoma | Female | >=65 | I/II | Chemotherapy | doxorubicin | CR |
| FLYWCH1 | deletion | Frame_Shift_Del | c.1278delN | p.Gly428AlafsTer44 | p.G428Afs*44 | Q4VC44 | protein_coding | TCGA-BH-A0HA-01 | Breast | breast invasive carcinoma | Female | <65 | I/II | Unknown | Unknown | SD | |||
| FLYWCH1 | SNV | Missense_Mutation | rs747935316 | c.1408C>T | p.Arg470Trp | p.R470W | Q4VC44 | protein_coding | deleterious(0) | probably_damaging(0.949) | TCGA-2W-A8YY-01 | Cervix | cervical & endocervical cancer | Female | <65 | I/II | Chemotherapy | cisplatin | CR |
| FLYWCH1 | SNV | Missense_Mutation | rs866521894 | c.1960C>T | p.Arg654Cys | p.R654C | Q4VC44 | protein_coding | deleterious(0) | probably_damaging(0.999) | TCGA-2W-A8YY-01 | Cervix | cervical & endocervical cancer | Female | <65 | I/II | Chemotherapy | cisplatin | CR |
| FLYWCH1 | SNV | Missense_Mutation | rs780119016 | c.1688N>A | p.Arg563His | p.R563H | Q4VC44 | protein_coding | deleterious(0.04) | probably_damaging(0.994) | TCGA-A6-5665-01 | Colorectum | colon adenocarcinoma | Female | >=65 | I/II | Unknown | Unknown | PD |
| Page: 1 2 3 4 5 6 |
Top |
Related drugs of malignant transformation related genes |
| Identification of chemicals and drugs interact with genes involved in malignant transfromation |
| (DGIdb 4.0) |
| Entrez ID | Symbol | Category | Interaction Types | Drug Claim Name | Drug Name | PMIDs |
| Page: 1 |

Copyright 2023-Present -The University of Texas Health Science Center at Houston |