
|
|||||
|
 | |
| |
| |
| |
| |
| |
|
Gene: FBXL17 |
Gene summary for FBXL17 |
| Gene information | Species | Human | Gene symbol | FBXL17 | Gene ID | 64839 |
| Gene name | F-box and leucine rich repeat protein 17 | |
| Gene Alias | FBXO13 | |
| Cytomap | 5q21.3 | |
| Gene Type | protein-coding | GO ID | GO:0000086 | UniProtAcc | Q9UF56 |
Top |
Malignant transformation analysis |
| Identification of the aberrant gene expression in precancerous and cancerous lesions by comparing the gene expression of stem-like cells in diseased tissues with normal stem cells |
| Entrez ID | Symbol | Replicates | Species | Organ | Tissue | Adj P-value | Log2FC | Malignancy |
| 64839 | FBXL17 | HTA11_99999971662_82457 | Human | Colorectum | MSS | 8.61e-15 | -5.35e-01 | 0.3859 |
| 64839 | FBXL17 | HTA11_99999973899_84307 | Human | Colorectum | MSS | 7.51e-03 | -6.11e-01 | 0.2585 |
| 64839 | FBXL17 | HTA11_99999974143_84620 | Human | Colorectum | MSS | 4.14e-47 | -8.54e-01 | 0.3005 |
| 64839 | FBXL17 | A015-C-203 | Human | Colorectum | FAP | 6.48e-36 | -5.79e-01 | -0.1294 |
| 64839 | FBXL17 | A015-C-204 | Human | Colorectum | FAP | 9.20e-06 | -3.65e-01 | -0.0228 |
| 64839 | FBXL17 | A014-C-040 | Human | Colorectum | FAP | 7.96e-08 | -6.33e-01 | -0.1184 |
| 64839 | FBXL17 | A002-C-201 | Human | Colorectum | FAP | 1.19e-12 | -4.20e-01 | 0.0324 |
| 64839 | FBXL17 | A001-C-119 | Human | Colorectum | FAP | 3.42e-14 | -7.16e-01 | -0.1557 |
| 64839 | FBXL17 | A001-C-108 | Human | Colorectum | FAP | 2.81e-14 | -4.09e-01 | -0.0272 |
| 64839 | FBXL17 | A002-C-205 | Human | Colorectum | FAP | 2.16e-30 | -6.87e-01 | -0.1236 |
| 64839 | FBXL17 | A001-C-104 | Human | Colorectum | FAP | 5.84e-03 | -2.81e-01 | 0.0184 |
| 64839 | FBXL17 | A015-C-005 | Human | Colorectum | FAP | 1.92e-06 | -4.71e-01 | -0.0336 |
| 64839 | FBXL17 | A015-C-006 | Human | Colorectum | FAP | 1.17e-23 | -7.18e-01 | -0.0994 |
| 64839 | FBXL17 | A015-C-106 | Human | Colorectum | FAP | 4.16e-14 | -4.99e-01 | -0.0511 |
| 64839 | FBXL17 | A002-C-114 | Human | Colorectum | FAP | 9.70e-29 | -7.25e-01 | -0.1561 |
| 64839 | FBXL17 | A015-C-104 | Human | Colorectum | FAP | 7.41e-41 | -7.55e-01 | -0.1899 |
| 64839 | FBXL17 | A001-C-014 | Human | Colorectum | FAP | 7.36e-16 | -4.07e-01 | 0.0135 |
| 64839 | FBXL17 | A002-C-016 | Human | Colorectum | FAP | 2.43e-25 | -3.78e-01 | 0.0521 |
| 64839 | FBXL17 | A015-C-002 | Human | Colorectum | FAP | 1.15e-16 | -5.91e-01 | -0.0763 |
| 64839 | FBXL17 | A001-C-007 | Human | Colorectum | CRC | 8.24e-03 | -5.09e-01 | 0.1899 |
| Page: 1 2 3 4 5 6 |
| Tissue | Expression Dynamics | Abbreviation |
| Cervix | 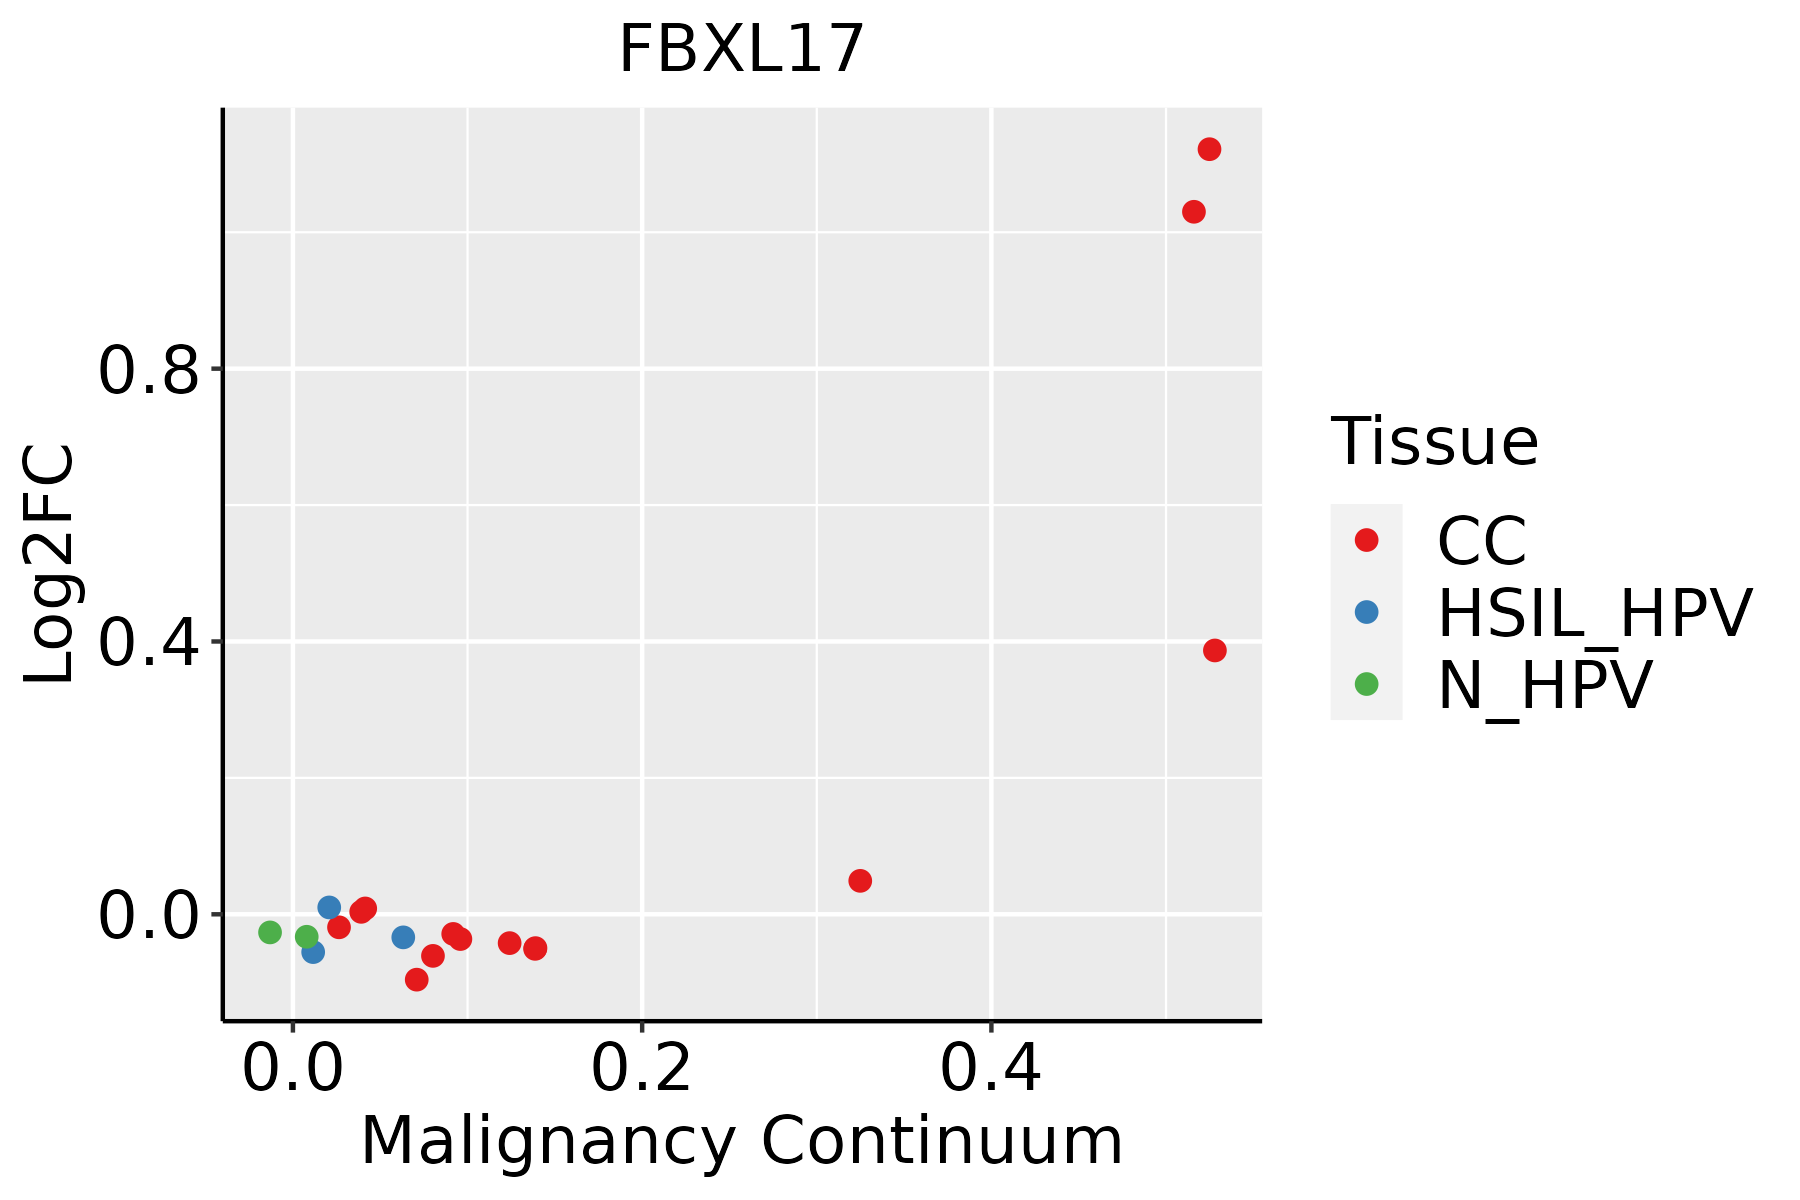 | CC: Cervix cancer |
| HSIL_HPV: HPV-infected high-grade squamous intraepithelial lesions | ||
| N_HPV: HPV-infected normal cervix | ||
| Colorectum (GSE201348) | 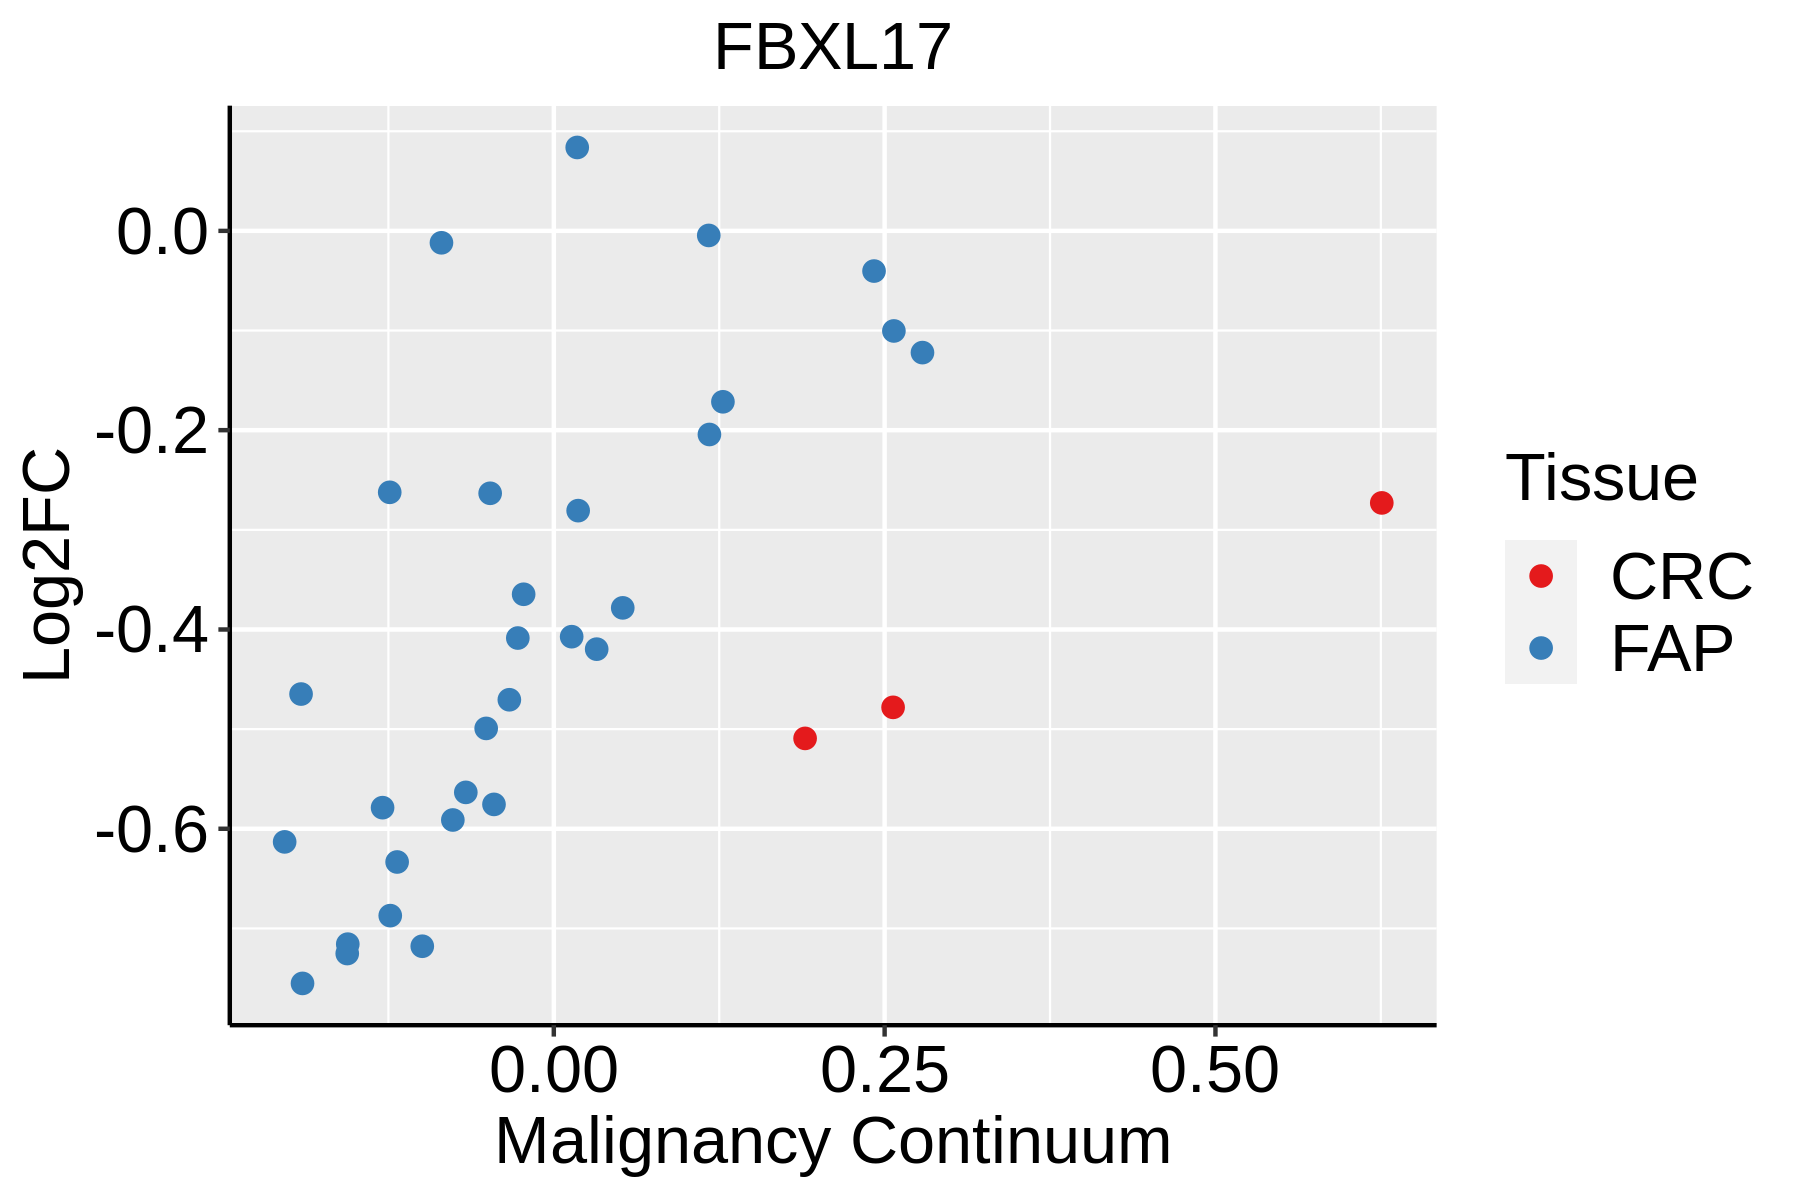 | FAP: Familial adenomatous polyposis |
| CRC: Colorectal cancer | ||
| Colorectum (HTA11) |  | AD: Adenomas |
| SER: Sessile serrated lesions | ||
| MSI-H: Microsatellite-high colorectal cancer | ||
| MSS: Microsatellite stable colorectal cancer | ||
| Endometrium |  | AEH: Atypical endometrial hyperplasia |
| EEC: Endometrioid Cancer | ||
| Liver |  | HCC: Hepatocellular carcinoma |
| NAFLD: Non-alcoholic fatty liver disease | ||
| Lung |  | AAH: Atypical adenomatous hyperplasia |
| AIS: Adenocarcinoma in situ | ||
| IAC: Invasive lung adenocarcinoma | ||
| MIA: Minimally invasive adenocarcinoma | ||
| Skin | 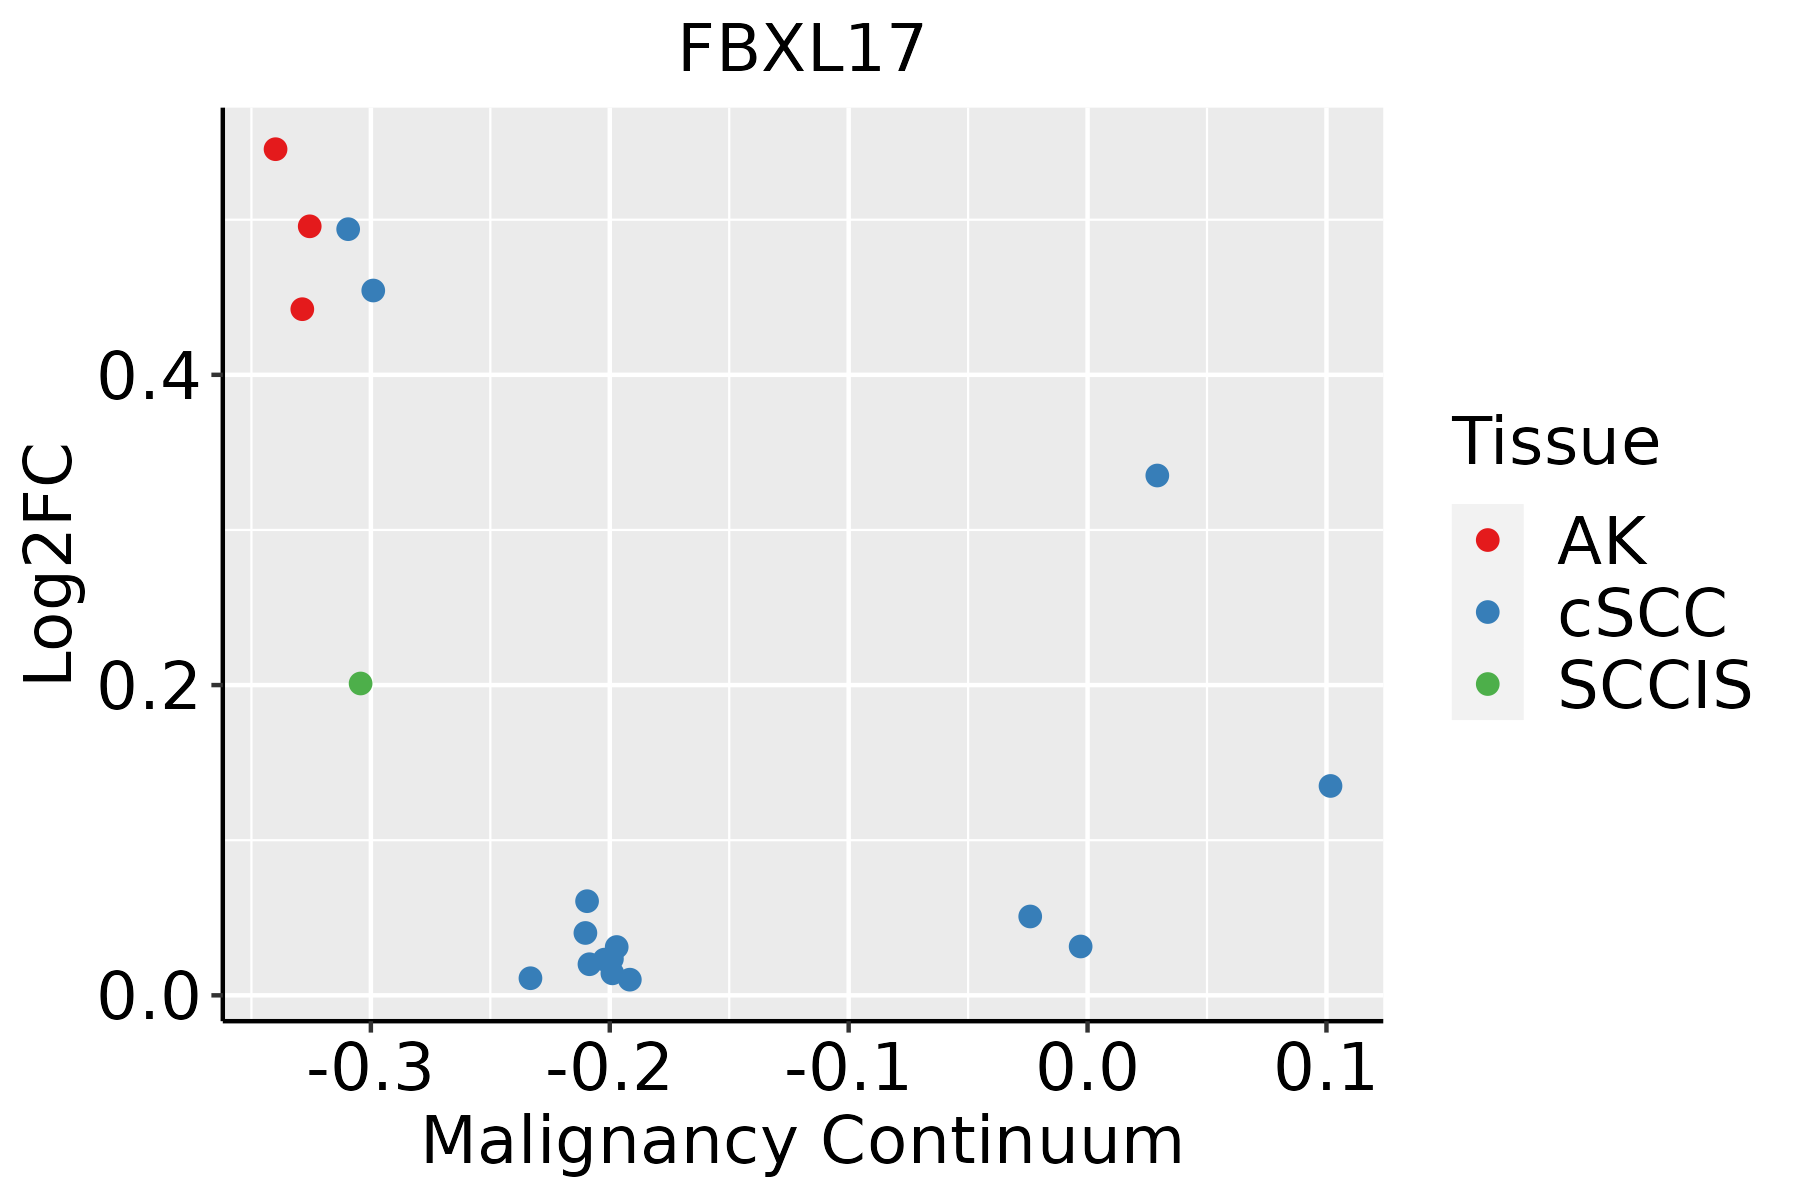 | AK: Actinic keratosis |
| cSCC: Cutaneous squamous cell carcinoma | ||
| SCCIS:squamous cell carcinoma in situ |
| ∗log2FC in expression of this searched gene in stem-like cells from each diseased tissue sample relative to stem-like cells in normal samples in each tissue plotted against the malignancy continuum. Samples are colored based on if they are from different disease stage. |
Top |
Malignant transformation related pathway analysis |
| Find out the enriched GO biological processes and KEGG pathways involved in transition from healthy to precancer to cancer |
| Tissue | Disease Stage | Enriched GO biological Processes |
| Colorectum | AD |  |
| Colorectum | SER |  |
| Colorectum | MSS |  |
| Colorectum | MSI-H |  |
| Colorectum | FAP |  |
| ∗Top 15 enriched GO BP terms are showed in the bar plot of each disease state in each tissue. Each row represents a significant GO biological process which is colored according to the -log10(p.adjust). |
| Page: 1 2 3 4 5 6 7 8 9 |
| GO ID | Tissue | Disease Stage | Description | Gene Ratio | Bg Ratio | pvalue | p.adjust | Count |
| GO:001049810 | Cervix | CC | proteasomal protein catabolic process | 111/2311 | 490/18723 | 8.98e-11 | 1.58e-08 | 111 |
| GO:004316110 | Cervix | CC | proteasome-mediated ubiquitin-dependent protein catabolic process | 91/2311 | 412/18723 | 1.65e-08 | 1.25e-06 | 91 |
| GO:00002097 | Cervix | CC | protein polyubiquitination | 58/2311 | 236/18723 | 1.57e-07 | 7.41e-06 | 58 |
| GO:00447725 | Cervix | CC | mitotic cell cycle phase transition | 89/2311 | 424/18723 | 2.70e-07 | 1.12e-05 | 89 |
| GO:00485118 | Cervix | CC | rhythmic process | 65/2311 | 298/18723 | 2.79e-06 | 8.04e-05 | 65 |
| GO:00093149 | Cervix | CC | response to radiation | 86/2311 | 456/18723 | 3.50e-05 | 5.63e-04 | 86 |
| GO:00488634 | Cervix | CC | stem cell differentiation | 46/2311 | 206/18723 | 4.11e-05 | 6.36e-04 | 46 |
| GO:00076238 | Cervix | CC | circadian rhythm | 46/2311 | 210/18723 | 6.76e-05 | 9.60e-04 | 46 |
| GO:00448392 | Cervix | CC | cell cycle G2/M phase transition | 31/2311 | 148/18723 | 2.07e-03 | 1.51e-02 | 31 |
| GO:00000862 | Cervix | CC | G2/M transition of mitotic cell cycle | 29/2311 | 137/18723 | 2.40e-03 | 1.70e-02 | 29 |
| GO:00487624 | Cervix | CC | mesenchymal cell differentiation | 42/2311 | 236/18723 | 9.12e-03 | 4.60e-02 | 42 |
| GO:00094163 | Cervix | CC | response to light stimulus | 54/2311 | 320/18723 | 1.03e-02 | 4.97e-02 | 54 |
| GO:0010498 | Colorectum | AD | proteasomal protein catabolic process | 174/3918 | 490/18723 | 3.18e-14 | 7.66e-12 | 174 |
| GO:0043161 | Colorectum | AD | proteasome-mediated ubiquitin-dependent protein catabolic process | 141/3918 | 412/18723 | 1.77e-10 | 1.68e-08 | 141 |
| GO:0007623 | Colorectum | AD | circadian rhythm | 72/3918 | 210/18723 | 4.50e-06 | 1.21e-04 | 72 |
| GO:0000209 | Colorectum | AD | protein polyubiquitination | 78/3918 | 236/18723 | 8.71e-06 | 2.06e-04 | 78 |
| GO:0048511 | Colorectum | AD | rhythmic process | 94/3918 | 298/18723 | 1.00e-05 | 2.34e-04 | 94 |
| GO:0006515 | Colorectum | AD | protein quality control for misfolded or incompletely synthesized proteins | 14/3918 | 28/18723 | 6.01e-04 | 6.33e-03 | 14 |
| GO:0042752 | Colorectum | AD | regulation of circadian rhythm | 40/3918 | 121/18723 | 1.24e-03 | 1.09e-02 | 40 |
| GO:00104981 | Colorectum | SER | proteasomal protein catabolic process | 132/2897 | 490/18723 | 3.08e-11 | 5.55e-09 | 132 |
| Page: 1 2 3 4 5 6 7 8 9 |
| Pathway ID | Tissue | Disease Stage | Description | Gene Ratio | Bg Ratio | pvalue | p.adjust | qvalue | Count |
| Page: 1 |
Top |
Cell-cell communication analysis |
| Identification of potential cell-cell interactions between two cell types and their ligand-receptor pairs for different disease states |
| Ligand | Receptor | LRpair | Pathway | Tissue | Disease Stage |
| Page: 1 |
Top |
Single-cell gene regulatory network inference analysis |
| Find out the significant the regulons (TFs) and the target genes of each regulon across cell types for different disease states |
| TF | Cell Type | Tissue | Disease Stage | Target Gene | RSS | Regulon Activity |
| ∗The dot plots of a searched regulon are shown for all cell subpopulations in each disease state of each tissue based on the regulon specific score inferred using pySCENIC and by calculating the average expression. |
| Page: 1 |
Top |
Somatic mutation of malignant transformation related genes |
| Annotation of somatic variants for genes involved in malignant transformation |
| Hugo Symbol | Variant Class | Variant Classification | dbSNP RS | HGVSc | HGVSp | HGVSp Short | SWISSPROT | BIOTYPE | SIFT | PolyPhen | Tumor Sample Barcode | Tissue | Histology | Sex | Age | Stage | Therapy Types | Drugs | Outcome |
| FBXL17 | SNV | Missense_Mutation | c.1613N>T | p.Lys538Met | p.K538M | Q9UF56 | protein_coding | deleterious(0.01) | benign(0.259) | TCGA-C8-A12L-01 | Breast | breast invasive carcinoma | Female | >=65 | I/II | Unknown | Unknown | SD | |
| FBXL17 | SNV | Missense_Mutation | c.1879T>C | p.Cys627Arg | p.C627R | Q9UF56 | protein_coding | deleterious(0) | probably_damaging(0.996) | TCGA-E9-A1R2-01 | Breast | breast invasive carcinoma | Female | <65 | III/IV | Chemotherapy | taxotere | CR | |
| FBXL17 | insertion | Nonsense_Mutation | novel | c.1845_1846insCTGTAGAACCAGCCAGGGATGTGAGCATGAGTTTAGGAAATGGTGT | p.Ser616LeufsTer2 | p.S616Lfs*2 | Q9UF56 | protein_coding | TCGA-AO-A0JB-01 | Breast | breast invasive carcinoma | Female | <65 | III/IV | Chemotherapy | cyclophosphamide | SD | ||
| FBXL17 | SNV | Missense_Mutation | c.1643G>A | p.Arg548His | p.R548H | Q9UF56 | protein_coding | deleterious(0.01) | probably_damaging(0.996) | TCGA-EA-A410-01 | Cervix | cervical & endocervical cancer | Female | <65 | I/II | Unknown | Unknown | SD | |
| FBXL17 | SNV | Missense_Mutation | c.1616T>C | p.Leu539Pro | p.L539P | Q9UF56 | protein_coding | deleterious(0.01) | probably_damaging(0.998) | TCGA-AA-3663-01 | Colorectum | colon adenocarcinoma | Male | <65 | I/II | Unknown | Unknown | SD | |
| FBXL17 | SNV | Missense_Mutation | novel | c.1479A>C | p.Gln493His | p.Q493H | Q9UF56 | protein_coding | deleterious(0.04) | probably_damaging(0.993) | TCGA-AA-3862-01 | Colorectum | colon adenocarcinoma | Male | >=65 | I/II | Unknown | Unknown | SD |
| FBXL17 | SNV | Missense_Mutation | rs201479758 | c.1972N>A | p.Glu658Lys | p.E658K | Q9UF56 | protein_coding | tolerated(0.14) | benign(0.373) | TCGA-AA-3984-01 | Colorectum | colon adenocarcinoma | Female | <65 | I/II | Unknown | Unknown | SD |
| FBXL17 | SNV | Missense_Mutation | novel | c.1033N>A | p.Ala345Thr | p.A345T | Q9UF56 | protein_coding | deleterious(0) | probably_damaging(0.921) | TCGA-AA-A010-01 | Colorectum | colon adenocarcinoma | Female | <65 | I/II | Chemotherapy | folinic | CR |
| FBXL17 | SNV | Missense_Mutation | novel | c.1402N>T | p.Asp468Tyr | p.D468Y | Q9UF56 | protein_coding | tolerated(0.21) | benign(0.106) | TCGA-AZ-4315-01 | Colorectum | colon adenocarcinoma | Male | <65 | I/II | Unknown | Unknown | SD |
| FBXL17 | SNV | Missense_Mutation | novel | c.1716N>G | p.Asn572Lys | p.N572K | Q9UF56 | protein_coding | deleterious(0.01) | possibly_damaging(0.815) | TCGA-CA-6717-01 | Colorectum | colon adenocarcinoma | Male | <65 | I/II | Chemotherapy | oxaliplatin | CR |
| Page: 1 2 3 4 5 6 |
Top |
Related drugs of malignant transformation related genes |
| Identification of chemicals and drugs interact with genes involved in malignant transfromation |
| (DGIdb 4.0) |
| Entrez ID | Symbol | Category | Interaction Types | Drug Claim Name | Drug Name | PMIDs |
| 64839 | FBXL17 | TUMOR SUPPRESSOR | hydrochlorothiazide | HYDROCHLOROTHIAZIDE |
| Page: 1 |

Copyright 2023-Present -The University of Texas Health Science Center at Houston |