
|
|||||
|
 | |
| |
| |
| |
| |
| |
|
Gene: FAM173B |
Gene summary for FAM173B |
| Gene information | Species | Human | Gene symbol | FAM173B | Gene ID | 134145 |
| Gene name | ATP synthase c subunit lysine N-methyltransferase | |
| Gene Alias | FAM173B | |
| Cytomap | 5p15.2 | |
| Gene Type | protein-coding | GO ID | GO:0003008 | UniProtAcc | Q6P4H8 |
Top |
Malignant transformation analysis |
| Identification of the aberrant gene expression in precancerous and cancerous lesions by comparing the gene expression of stem-like cells in diseased tissues with normal stem cells |
| Entrez ID | Symbol | Replicates | Species | Organ | Tissue | Adj P-value | Log2FC | Malignancy |
| 134145 | FAM173B | P32T-E | Human | Esophagus | ESCC | 2.91e-27 | 5.71e-01 | 0.1666 |
| 134145 | FAM173B | P37T-E | Human | Esophagus | ESCC | 1.34e-08 | 1.95e-01 | 0.1371 |
| 134145 | FAM173B | P39T-E | Human | Esophagus | ESCC | 5.00e-10 | 9.99e-02 | 0.0894 |
| 134145 | FAM173B | P40T-E | Human | Esophagus | ESCC | 1.91e-04 | 9.99e-02 | 0.109 |
| 134145 | FAM173B | P42T-E | Human | Esophagus | ESCC | 1.50e-04 | 9.99e-02 | 0.1175 |
| 134145 | FAM173B | P44T-E | Human | Esophagus | ESCC | 1.82e-07 | 1.72e-01 | 0.1096 |
| 134145 | FAM173B | P47T-E | Human | Esophagus | ESCC | 5.64e-10 | 8.70e-02 | 0.1067 |
| 134145 | FAM173B | P48T-E | Human | Esophagus | ESCC | 1.12e-12 | 7.19e-02 | 0.0959 |
| 134145 | FAM173B | P49T-E | Human | Esophagus | ESCC | 1.10e-04 | 3.53e-01 | 0.1768 |
| 134145 | FAM173B | P52T-E | Human | Esophagus | ESCC | 3.13e-09 | 1.92e-01 | 0.1555 |
| 134145 | FAM173B | P54T-E | Human | Esophagus | ESCC | 1.71e-12 | 1.65e-01 | 0.0975 |
| 134145 | FAM173B | P56T-E | Human | Esophagus | ESCC | 1.13e-04 | 7.17e-01 | 0.1613 |
| 134145 | FAM173B | P57T-E | Human | Esophagus | ESCC | 1.33e-11 | 7.82e-02 | 0.0926 |
| 134145 | FAM173B | P61T-E | Human | Esophagus | ESCC | 8.17e-03 | 9.80e-03 | 0.099 |
| 134145 | FAM173B | P62T-E | Human | Esophagus | ESCC | 1.13e-15 | 2.11e-01 | 0.1302 |
| 134145 | FAM173B | P65T-E | Human | Esophagus | ESCC | 7.42e-12 | 1.23e-01 | 0.0978 |
| 134145 | FAM173B | P74T-E | Human | Esophagus | ESCC | 1.17e-33 | 8.31e-01 | 0.1479 |
| 134145 | FAM173B | P75T-E | Human | Esophagus | ESCC | 2.53e-23 | 2.04e-01 | 0.1125 |
| 134145 | FAM173B | P76T-E | Human | Esophagus | ESCC | 3.37e-13 | 1.48e-01 | 0.1207 |
| 134145 | FAM173B | P79T-E | Human | Esophagus | ESCC | 4.19e-19 | 2.78e-01 | 0.1154 |
| Page: 1 2 3 |
| Tissue | Expression Dynamics | Abbreviation |
| Esophagus | 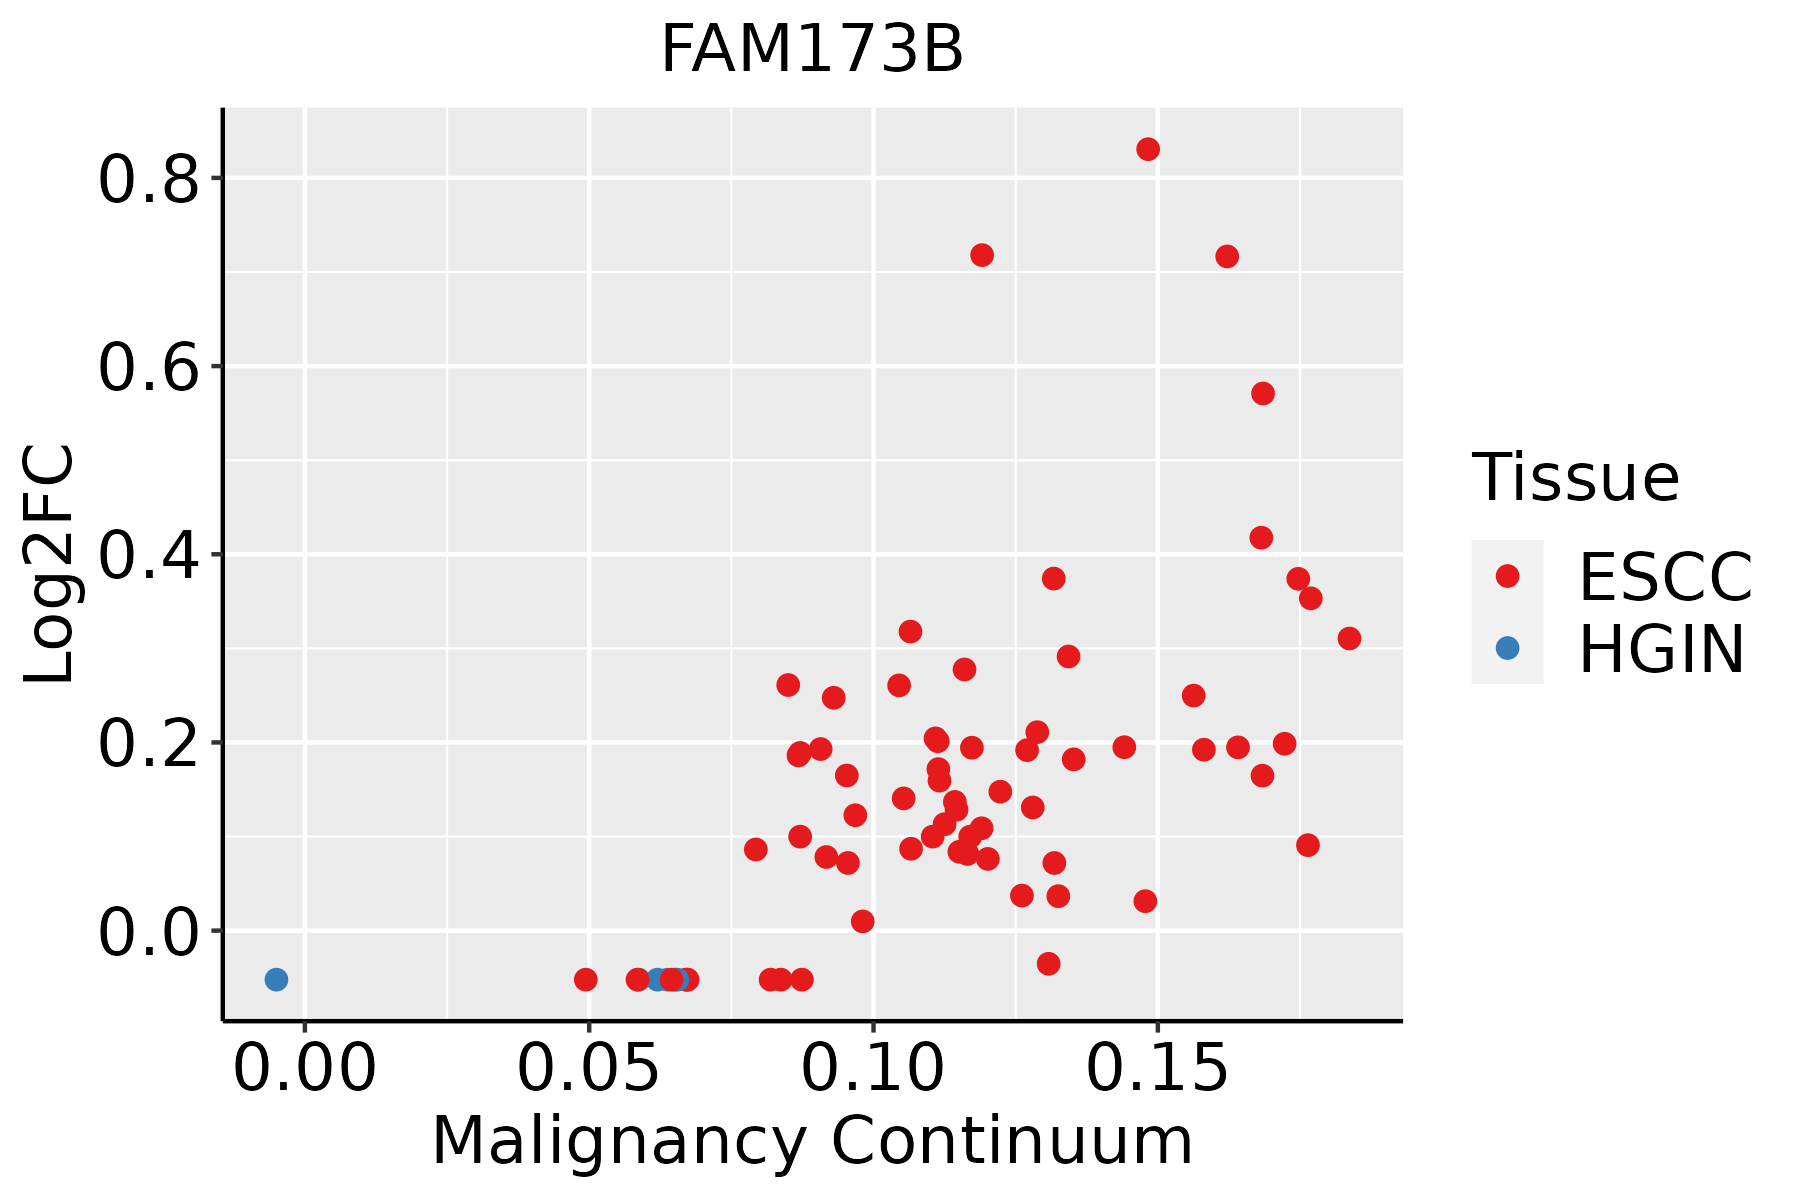 | ESCC: Esophageal squamous cell carcinoma |
| HGIN: High-grade intraepithelial neoplasias | ||
| LGIN: Low-grade intraepithelial neoplasias |
| ∗log2FC in expression of this searched gene in stem-like cells from each diseased tissue sample relative to stem-like cells in normal samples in each tissue plotted against the malignancy continuum. Samples are colored based on if they are from different disease stage. |
Top |
Malignant transformation related pathway analysis |
| Find out the enriched GO biological processes and KEGG pathways involved in transition from healthy to precancer to cancer |
| Tissue | Disease Stage | Enriched GO biological Processes |
| Colorectum | AD |  |
| Colorectum | SER |  |
| Colorectum | MSS |  |
| Colorectum | MSI-H |  |
| Colorectum | FAP |  |
| ∗Top 15 enriched GO BP terms are showed in the bar plot of each disease state in each tissue. Each row represents a significant GO biological process which is colored according to the -log10(p.adjust). |
| Page: 1 2 3 4 5 6 7 8 9 |
| GO ID | Tissue | Disease Stage | Description | Gene Ratio | Bg Ratio | pvalue | p.adjust | Count |
| Page: 1 |
| Pathway ID | Tissue | Disease Stage | Description | Gene Ratio | Bg Ratio | pvalue | p.adjust | qvalue | Count |
| Page: 1 |
Top |
Cell-cell communication analysis |
| Identification of potential cell-cell interactions between two cell types and their ligand-receptor pairs for different disease states |
| Ligand | Receptor | LRpair | Pathway | Tissue | Disease Stage |
| Page: 1 |
Top |
Single-cell gene regulatory network inference analysis |
| Find out the significant the regulons (TFs) and the target genes of each regulon across cell types for different disease states |
| TF | Cell Type | Tissue | Disease Stage | Target Gene | RSS | Regulon Activity |
| ∗The dot plots of a searched regulon are shown for all cell subpopulations in each disease state of each tissue based on the regulon specific score inferred using pySCENIC and by calculating the average expression. |
| Page: 1 |
Top |
Somatic mutation of malignant transformation related genes |
| Annotation of somatic variants for genes involved in malignant transformation |
| Hugo Symbol | Variant Class | Variant Classification | dbSNP RS | HGVSc | HGVSp | HGVSp Short | SWISSPROT | BIOTYPE | SIFT | PolyPhen | Tumor Sample Barcode | Tissue | Histology | Sex | Age | Stage | Therapy Types | Drugs | Outcome |
| FAM173B | SNV | Missense_Mutation | rs559270054 | c.302G>A | p.Arg101His | p.R101H | Q6P4H8 | protein_coding | deleterious(0.03) | probably_damaging(1) | TCGA-A2-A0CO-01 | Breast | breast invasive carcinoma | Female | >=65 | I/II | Hormone Therapy | tamoxiphen | CR |
| FAM173B | SNV | Missense_Mutation | c.677A>G | p.His226Arg | p.H226R | Q6P4H8 | protein_coding | tolerated_low_confidence(0.45) | benign(0) | TCGA-AR-A0TT-01 | Breast | breast invasive carcinoma | Female | <65 | III/IV | Chemotherapy | doxorubicin | SD | |
| FAM173B | SNV | Missense_Mutation | rs559270054 | c.302G>A | p.Arg101His | p.R101H | Q6P4H8 | protein_coding | deleterious(0.03) | probably_damaging(1) | TCGA-BH-A18G-01 | Breast | breast invasive carcinoma | Female | >=65 | I/II | Unknown | Unknown | SD |
| FAM173B | SNV | Missense_Mutation | c.413N>T | p.Ser138Phe | p.S138F | Q6P4H8 | protein_coding | deleterious(0.01) | benign(0.396) | TCGA-C8-A26Y-01 | Breast | breast invasive carcinoma | Female | >=65 | I/II | Unknown | Unknown | SD | |
| FAM173B | SNV | Missense_Mutation | c.112T>C | p.Phe38Leu | p.F38L | Q6P4H8 | protein_coding | tolerated(1) | benign(0) | TCGA-D8-A1XK-01 | Breast | breast invasive carcinoma | Female | <65 | I/II | Chemotherapy | doxorubicine+cyclophosphamide | SD | |
| FAM173B | insertion | Nonsense_Mutation | novel | c.75_76insGGATGAGCATTGAGTAGTTTCAGTTTACCTCAGTTTACTGATTTGC | p.Phe26GlyfsTer2 | p.F26Gfs*2 | Q6P4H8 | protein_coding | TCGA-AN-A0FS-01 | Breast | breast invasive carcinoma | Female | <65 | I/II | Unknown | Unknown | SD | ||
| FAM173B | insertion | In_Frame_Ins | novel | c.259_260insCACGAGGTCAGGAGTTCAAGACCAGCCTAACCAACATGGTGAAAC | p.Cys87delinsSerArgGlyGlnGluPheLysThrSerLeuThrAsnMetValLysArg | p.C87delinsSRGQEFKTSLTNMVKR | Q6P4H8 | protein_coding | TCGA-AQ-A04J-01 | Breast | breast invasive carcinoma | Female | <65 | I/II | Chemotherapy | cytoxan | SD | ||
| FAM173B | SNV | Missense_Mutation | novel | c.127N>T | p.Leu43Phe | p.L43F | Q6P4H8 | protein_coding | deleterious(0.02) | benign(0.035) | TCGA-EA-A3HU-01 | Cervix | cervical & endocervical cancer | Female | <65 | I/II | Unknown | Unknown | SD |
| FAM173B | SNV | Missense_Mutation | rs745363656 | c.388N>A | p.Ala130Thr | p.A130T | Q6P4H8 | protein_coding | tolerated(0.05) | probably_damaging(0.99) | TCGA-A6-5665-01 | Colorectum | colon adenocarcinoma | Female | >=65 | I/II | Unknown | Unknown | PD |
| FAM173B | SNV | Missense_Mutation | novel | c.67N>T | p.Pro23Ser | p.P23S | Q6P4H8 | protein_coding | deleterious(0.04) | benign(0.022) | TCGA-AA-3693-01 | Colorectum | colon adenocarcinoma | Female | >=65 | III/IV | Unknown | Unknown | SD |
| Page: 1 2 3 4 5 |
Top |
Related drugs of malignant transformation related genes |
| Identification of chemicals and drugs interact with genes involved in malignant transfromation |
| (DGIdb 4.0) |
| Entrez ID | Symbol | Category | Interaction Types | Drug Claim Name | Drug Name | PMIDs |
| Page: 1 |

Copyright 2023-Present -The University of Texas Health Science Center at Houston |