
|
|||||
|
 | |
| |
| |
| |
| |
| |
|
Gene: ESRP2 |
Gene summary for ESRP2 |
| Gene information | Species | Human | Gene symbol | ESRP2 | Gene ID | 80004 |
| Gene name | epithelial splicing regulatory protein 2 | |
| Gene Alias | RBM35B | |
| Cytomap | 16q22.1 | |
| Gene Type | protein-coding | GO ID | GO:0000375 | UniProtAcc | Q9H6T0 |
Top |
Malignant transformation analysis |
| Identification of the aberrant gene expression in precancerous and cancerous lesions by comparing the gene expression of stem-like cells in diseased tissues with normal stem cells |
| Entrez ID | Symbol | Replicates | Species | Organ | Tissue | Adj P-value | Log2FC | Malignancy |
| 80004 | ESRP2 | P30T-E | Human | Esophagus | ESCC | 7.26e-09 | 4.26e-01 | 0.137 |
| 80004 | ESRP2 | P31T-E | Human | Esophagus | ESCC | 1.67e-09 | 1.76e-01 | 0.1251 |
| 80004 | ESRP2 | P36T-E | Human | Esophagus | ESCC | 1.69e-03 | 1.43e-01 | 0.1187 |
| 80004 | ESRP2 | P37T-E | Human | Esophagus | ESCC | 2.89e-06 | 2.01e-01 | 0.1371 |
| 80004 | ESRP2 | P38T-E | Human | Esophagus | ESCC | 9.74e-04 | 1.45e-01 | 0.127 |
| 80004 | ESRP2 | P39T-E | Human | Esophagus | ESCC | 4.37e-08 | 2.29e-01 | 0.0894 |
| 80004 | ESRP2 | P40T-E | Human | Esophagus | ESCC | 1.22e-06 | 2.34e-01 | 0.109 |
| 80004 | ESRP2 | P42T-E | Human | Esophagus | ESCC | 1.54e-05 | 1.73e-01 | 0.1175 |
| 80004 | ESRP2 | P47T-E | Human | Esophagus | ESCC | 1.27e-05 | 7.71e-02 | 0.1067 |
| 80004 | ESRP2 | P48T-E | Human | Esophagus | ESCC | 4.43e-04 | 1.27e-01 | 0.0959 |
| 80004 | ESRP2 | P49T-E | Human | Esophagus | ESCC | 2.14e-03 | 3.30e-01 | 0.1768 |
| 80004 | ESRP2 | P52T-E | Human | Esophagus | ESCC | 4.57e-14 | 2.76e-01 | 0.1555 |
| 80004 | ESRP2 | P54T-E | Human | Esophagus | ESCC | 3.02e-16 | 3.54e-01 | 0.0975 |
| 80004 | ESRP2 | P57T-E | Human | Esophagus | ESCC | 1.06e-10 | 2.18e-01 | 0.0926 |
| 80004 | ESRP2 | P61T-E | Human | Esophagus | ESCC | 6.53e-06 | 1.60e-01 | 0.099 |
| 80004 | ESRP2 | P62T-E | Human | Esophagus | ESCC | 1.56e-20 | 5.06e-01 | 0.1302 |
| 80004 | ESRP2 | P65T-E | Human | Esophagus | ESCC | 5.34e-09 | 2.41e-01 | 0.0978 |
| 80004 | ESRP2 | P74T-E | Human | Esophagus | ESCC | 4.55e-14 | 4.86e-01 | 0.1479 |
| 80004 | ESRP2 | P75T-E | Human | Esophagus | ESCC | 1.81e-22 | 4.50e-01 | 0.1125 |
| 80004 | ESRP2 | P76T-E | Human | Esophagus | ESCC | 5.15e-03 | 8.86e-02 | 0.1207 |
| Page: 1 2 3 |
| Tissue | Expression Dynamics | Abbreviation |
| Esophagus | 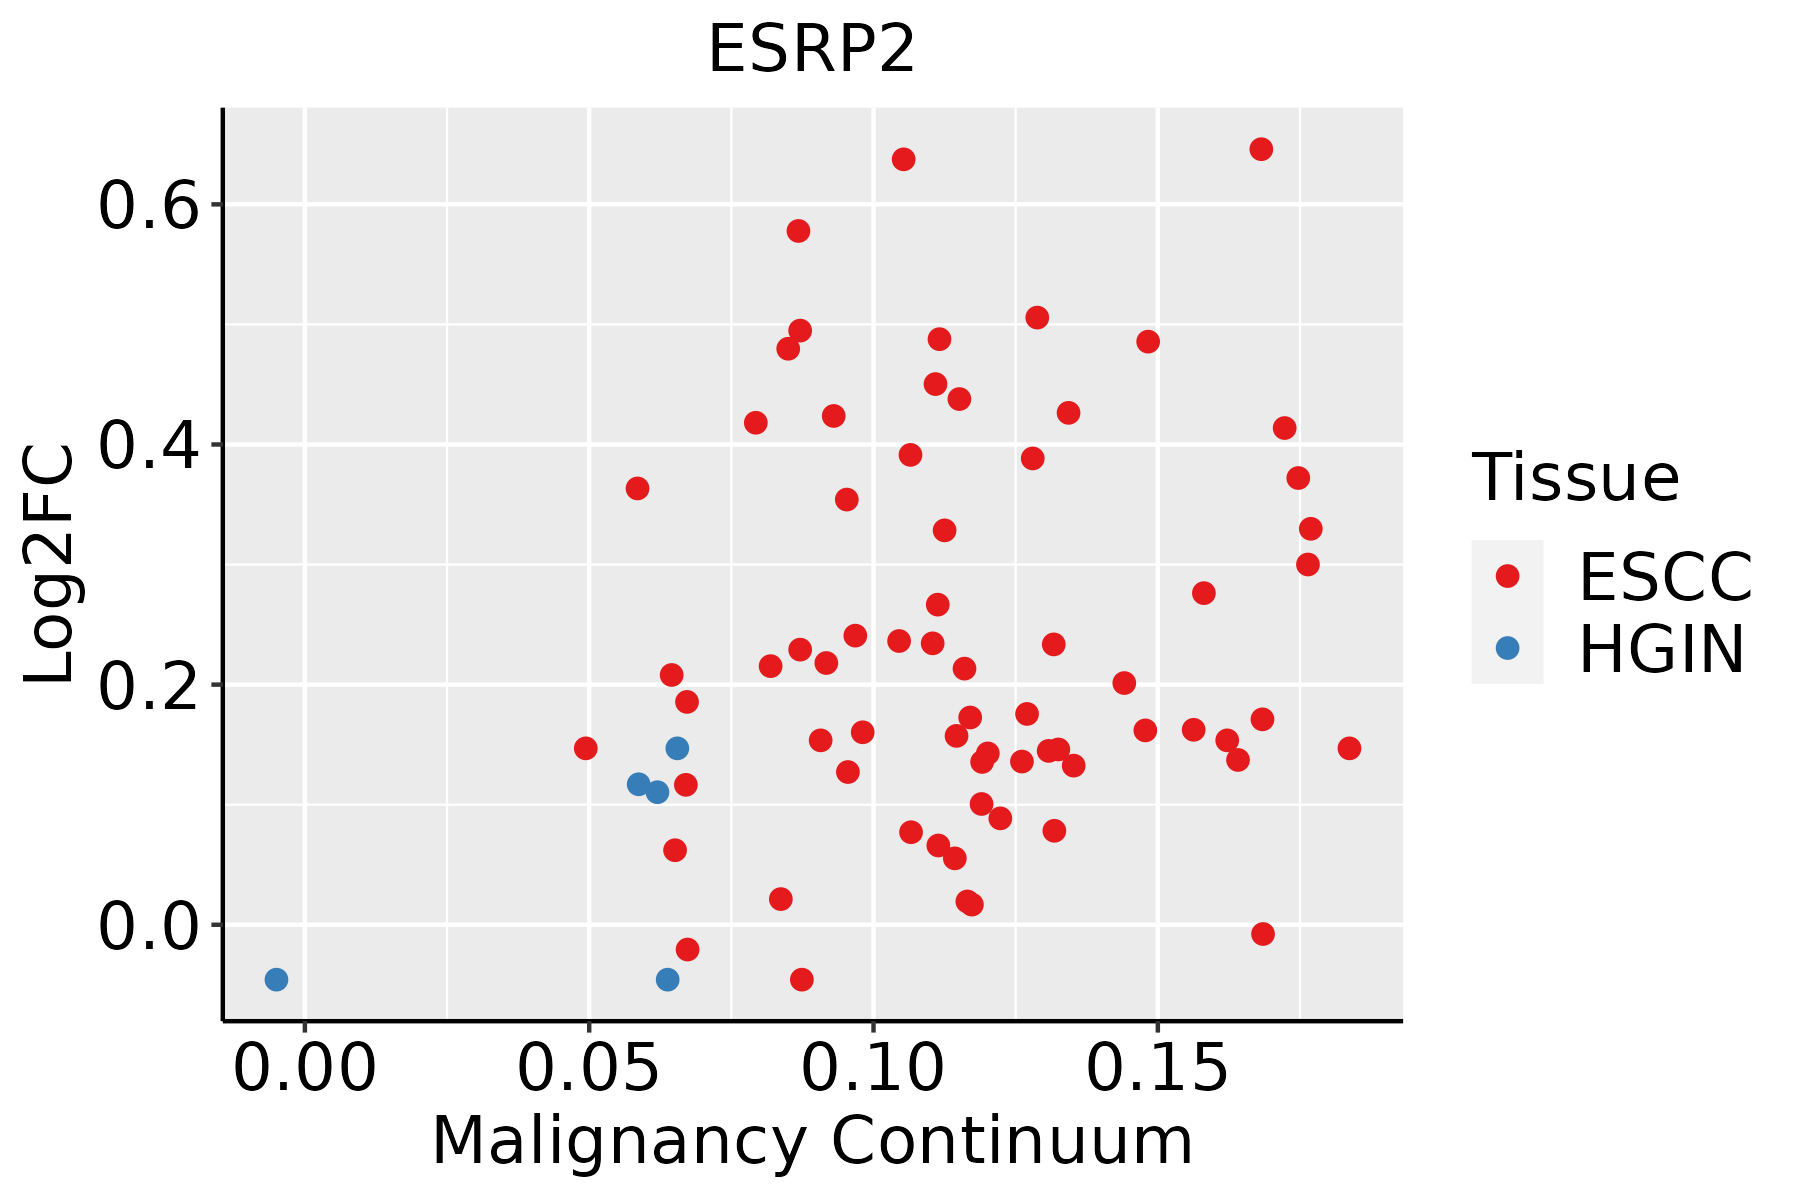 | ESCC: Esophageal squamous cell carcinoma |
| HGIN: High-grade intraepithelial neoplasias | ||
| LGIN: Low-grade intraepithelial neoplasias | ||
| Liver | 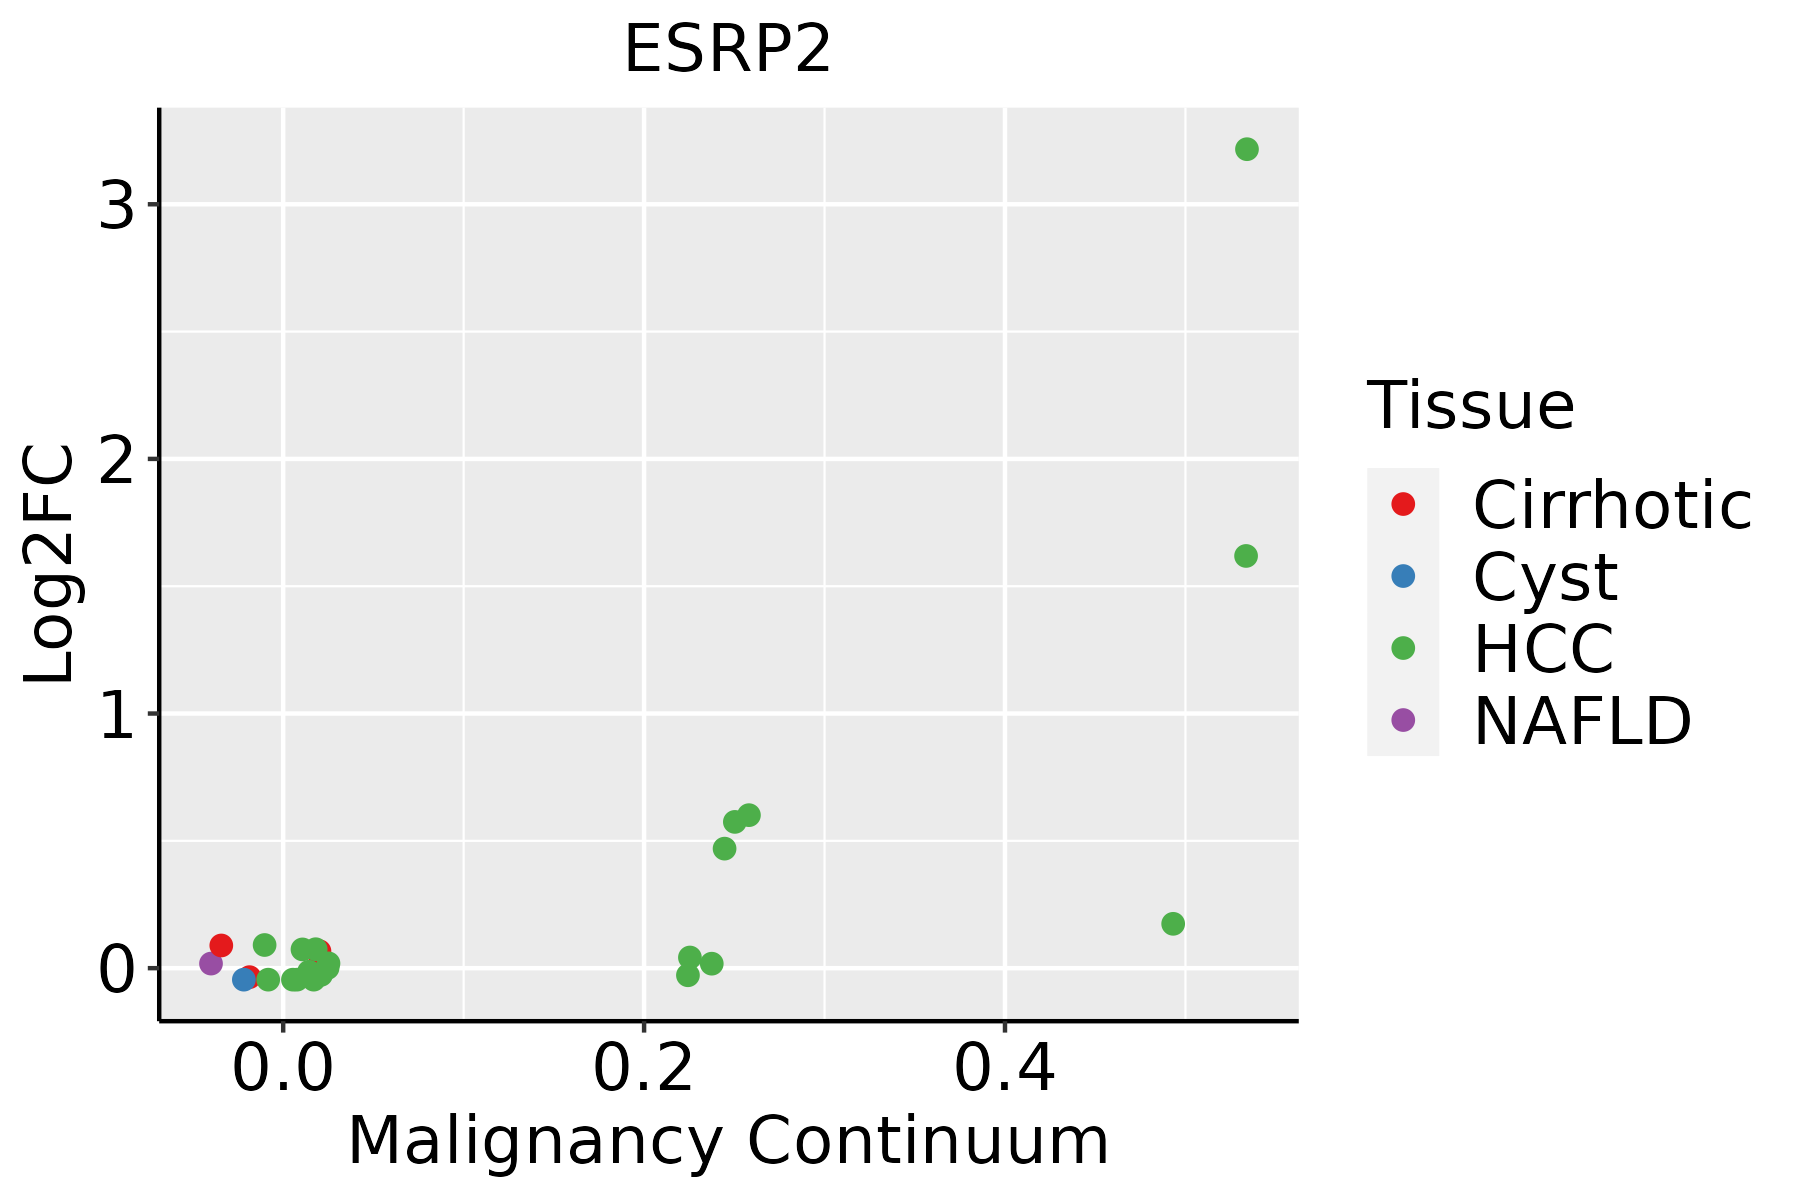 | HCC: Hepatocellular carcinoma |
| NAFLD: Non-alcoholic fatty liver disease |
| ∗log2FC in expression of this searched gene in stem-like cells from each diseased tissue sample relative to stem-like cells in normal samples in each tissue plotted against the malignancy continuum. Samples are colored based on if they are from different disease stage. |
Top |
Malignant transformation related pathway analysis |
| Find out the enriched GO biological processes and KEGG pathways involved in transition from healthy to precancer to cancer |
| Tissue | Disease Stage | Enriched GO biological Processes |
| Colorectum | AD |  |
| Colorectum | SER |  |
| Colorectum | MSS |  |
| Colorectum | MSI-H |  |
| Colorectum | FAP |  |
| ∗Top 15 enriched GO BP terms are showed in the bar plot of each disease state in each tissue. Each row represents a significant GO biological process which is colored according to the -log10(p.adjust). |
| Page: 1 2 3 4 5 6 7 8 9 |
| GO ID | Tissue | Disease Stage | Description | Gene Ratio | Bg Ratio | pvalue | p.adjust | Count |
| GO:0008380111 | Esophagus | ESCC | RNA splicing | 336/8552 | 434/18723 | 1.74e-42 | 3.67e-39 | 336 |
| GO:0000375111 | Esophagus | ESCC | RNA splicing, via transesterification reactions | 248/8552 | 324/18723 | 3.05e-30 | 1.49e-27 | 248 |
| GO:0000377111 | Esophagus | ESCC | RNA splicing, via transesterification reactions with bulged adenosine as nucleophile | 244/8552 | 320/18723 | 2.52e-29 | 1.07e-26 | 244 |
| GO:0000398111 | Esophagus | ESCC | mRNA splicing, via spliceosome | 244/8552 | 320/18723 | 2.52e-29 | 1.07e-26 | 244 |
| GO:0043484111 | Esophagus | ESCC | regulation of RNA splicing | 116/8552 | 148/18723 | 3.18e-16 | 2.38e-14 | 116 |
| GO:0048732111 | Esophagus | ESCC | gland development | 269/8552 | 436/18723 | 7.81e-12 | 2.95e-10 | 269 |
| GO:000038019 | Esophagus | ESCC | alternative mRNA splicing, via spliceosome | 55/8552 | 77/18723 | 4.07e-06 | 4.38e-05 | 55 |
| GO:002261216 | Esophagus | ESCC | gland morphogenesis | 78/8552 | 118/18723 | 5.83e-06 | 6.03e-05 | 78 |
| GO:00303239 | Esophagus | ESCC | respiratory tube development | 112/8552 | 181/18723 | 7.82e-06 | 7.69e-05 | 112 |
| GO:006056210 | Esophagus | ESCC | epithelial tube morphogenesis | 187/8552 | 325/18723 | 9.95e-06 | 9.44e-05 | 187 |
| GO:00605417 | Esophagus | ESCC | respiratory system development | 123/8552 | 203/18723 | 1.26e-05 | 1.15e-04 | 123 |
| GO:00303249 | Esophagus | ESCC | lung development | 109/8552 | 177/18723 | 1.40e-05 | 1.27e-04 | 109 |
| GO:00604257 | Esophagus | ESCC | lung morphogenesis | 37/8552 | 50/18723 | 4.42e-05 | 3.51e-04 | 37 |
| GO:005067318 | Esophagus | ESCC | epithelial cell proliferation | 238/8552 | 437/18723 | 1.19e-04 | 8.20e-04 | 238 |
| GO:005067817 | Esophagus | ESCC | regulation of epithelial cell proliferation | 206/8552 | 381/18723 | 5.51e-04 | 3.02e-03 | 206 |
| GO:00604414 | Esophagus | ESCC | epithelial tube branching involved in lung morphogenesis | 22/8552 | 29/18723 | 9.30e-04 | 4.73e-03 | 22 |
| GO:00017639 | Esophagus | ESCC | morphogenesis of a branching structure | 106/8552 | 196/18723 | 1.08e-02 | 3.66e-02 | 106 |
| GO:000838022 | Liver | HCC | RNA splicing | 313/7958 | 434/18723 | 1.36e-36 | 1.73e-33 | 313 |
| GO:000037522 | Liver | HCC | RNA splicing, via transesterification reactions | 228/7958 | 324/18723 | 1.47e-24 | 4.06e-22 | 228 |
| GO:000037722 | Liver | HCC | RNA splicing, via transesterification reactions with bulged adenosine as nucleophile | 224/7958 | 320/18723 | 1.16e-23 | 2.62e-21 | 224 |
| Page: 1 2 |
| Pathway ID | Tissue | Disease Stage | Description | Gene Ratio | Bg Ratio | pvalue | p.adjust | qvalue | Count |
| Page: 1 |
Top |
Cell-cell communication analysis |
| Identification of potential cell-cell interactions between two cell types and their ligand-receptor pairs for different disease states |
| Ligand | Receptor | LRpair | Pathway | Tissue | Disease Stage |
| Page: 1 |
Top |
Single-cell gene regulatory network inference analysis |
| Find out the significant the regulons (TFs) and the target genes of each regulon across cell types for different disease states |
| TF | Cell Type | Tissue | Disease Stage | Target Gene | RSS | Regulon Activity |
| ∗The dot plots of a searched regulon are shown for all cell subpopulations in each disease state of each tissue based on the regulon specific score inferred using pySCENIC and by calculating the average expression. |
| Page: 1 |
Top |
Somatic mutation of malignant transformation related genes |
| Annotation of somatic variants for genes involved in malignant transformation |
| Hugo Symbol | Variant Class | Variant Classification | dbSNP RS | HGVSc | HGVSp | HGVSp Short | SWISSPROT | BIOTYPE | SIFT | PolyPhen | Tumor Sample Barcode | Tissue | Histology | Sex | Age | Stage | Therapy Types | Drugs | Outcome |
| ESRP2 | SNV | Missense_Mutation | c.1305N>C | p.Leu435Phe | p.L435F | Q9H6T0 | protein_coding | deleterious(0) | probably_damaging(0.979) | TCGA-A1-A0SI-01 | Breast | breast invasive carcinoma | Female | <65 | I/II | Unknown | Unknown | SD | |
| ESRP2 | SNV | Missense_Mutation | c.833C>A | p.Ala278Glu | p.A278E | Q9H6T0 | protein_coding | deleterious(0) | probably_damaging(0.98) | TCGA-AN-A0FN-01 | Breast | breast invasive carcinoma | Female | <65 | I/II | Unknown | Unknown | SD | |
| ESRP2 | SNV | Missense_Mutation | c.1379N>A | p.Pro460His | p.P460H | Q9H6T0 | protein_coding | deleterious(0.04) | possibly_damaging(0.482) | TCGA-AO-A128-01 | Breast | breast invasive carcinoma | Female | <65 | I/II | Chemotherapy | doxorubicin | SD | |
| ESRP2 | SNV | Missense_Mutation | c.1678A>G | p.Ser560Gly | p.S560G | Q9H6T0 | protein_coding | tolerated(0.13) | benign(0.03) | TCGA-BH-A18G-01 | Breast | breast invasive carcinoma | Female | >=65 | I/II | Unknown | Unknown | SD | |
| ESRP2 | SNV | Missense_Mutation | rs372908528 | c.1477N>T | p.Arg493Trp | p.R493W | Q9H6T0 | protein_coding | deleterious(0.03) | possibly_damaging(0.761) | TCGA-C8-A1HG-01 | Breast | breast invasive carcinoma | Female | <65 | I/II | Unknown | Unknown | SD |
| ESRP2 | SNV | Missense_Mutation | novel | c.1361T>G | p.Ile454Ser | p.I454S | Q9H6T0 | protein_coding | tolerated(0.11) | benign(0.052) | TCGA-LL-A740-01 | Breast | breast invasive carcinoma | Female | <65 | I/II | Chemotherapy | adriamycin | CR |
| ESRP2 | deletion | Frame_Shift_Del | novel | c.2018delA | p.Tyr673SerfsTer5 | p.Y673Sfs*5 | Q9H6T0 | protein_coding | TCGA-EW-A2FV-01 | Breast | breast invasive carcinoma | Female | <65 | III/IV | Chemotherapy | docetaxel | SD | ||
| ESRP2 | SNV | Missense_Mutation | c.1273N>T | p.Arg425Trp | p.R425W | Q9H6T0 | protein_coding | deleterious(0) | probably_damaging(0.996) | TCGA-EA-A5O9-01 | Cervix | cervical & endocervical cancer | Female | <65 | I/II | Unknown | Unknown | SD | |
| ESRP2 | SNV | Missense_Mutation | c.1676G>A | p.Arg559His | p.R559H | Q9H6T0 | protein_coding | tolerated(0.08) | benign(0.36) | TCGA-EK-A2RK-01 | Cervix | cervical & endocervical cancer | Female | >=65 | I/II | Unknown | Unknown | SD | |
| ESRP2 | SNV | Missense_Mutation | rs569178519 | c.2113N>T | p.Arg705Cys | p.R705C | Q9H6T0 | protein_coding | deleterious_low_confidence(0) | probably_damaging(0.984) | TCGA-AA-3815-01 | Colorectum | colon adenocarcinoma | Female | >=65 | I/II | Unknown | Unknown | SD |
| Page: 1 2 3 4 5 6 |
Top |
Related drugs of malignant transformation related genes |
| Identification of chemicals and drugs interact with genes involved in malignant transfromation |
| (DGIdb 4.0) |
| Entrez ID | Symbol | Category | Interaction Types | Drug Claim Name | Drug Name | PMIDs |
| Page: 1 |

Copyright 2023-Present -The University of Texas Health Science Center at Houston |