
|
|||||
|
 | |
| |
| |
| |
| |
| |
|
Gene: EPHA1 |
Gene summary for EPHA1 |
| Gene information | Species | Human | Gene symbol | EPHA1 | Gene ID | 2041 |
| Gene name | EPH receptor A1 | |
| Gene Alias | EPH | |
| Cytomap | 7q34-q35 | |
| Gene Type | protein-coding | GO ID | GO:0000902 | UniProtAcc | P21709 |
Top |
Malignant transformation analysis |
| Identification of the aberrant gene expression in precancerous and cancerous lesions by comparing the gene expression of stem-like cells in diseased tissues with normal stem cells |
| Entrez ID | Symbol | Replicates | Species | Organ | Tissue | Adj P-value | Log2FC | Malignancy |
| 2041 | EPHA1 | P23T-E | Human | Esophagus | ESCC | 2.44e-07 | 2.06e-01 | 0.108 |
| 2041 | EPHA1 | P24T-E | Human | Esophagus | ESCC | 5.44e-03 | 8.77e-02 | 0.1287 |
| 2041 | EPHA1 | P26T-E | Human | Esophagus | ESCC | 3.80e-16 | 4.09e-01 | 0.1276 |
| 2041 | EPHA1 | P27T-E | Human | Esophagus | ESCC | 6.11e-12 | 2.54e-01 | 0.1055 |
| 2041 | EPHA1 | P28T-E | Human | Esophagus | ESCC | 2.19e-35 | 7.15e-01 | 0.1149 |
| 2041 | EPHA1 | P30T-E | Human | Esophagus | ESCC | 2.48e-12 | 4.90e-01 | 0.137 |
| 2041 | EPHA1 | P31T-E | Human | Esophagus | ESCC | 7.54e-06 | 1.14e-01 | 0.1251 |
| 2041 | EPHA1 | P32T-E | Human | Esophagus | ESCC | 6.03e-06 | 1.81e-01 | 0.1666 |
| 2041 | EPHA1 | P36T-E | Human | Esophagus | ESCC | 3.48e-04 | 1.44e-01 | 0.1187 |
| 2041 | EPHA1 | P37T-E | Human | Esophagus | ESCC | 3.46e-13 | 2.70e-01 | 0.1371 |
| 2041 | EPHA1 | P39T-E | Human | Esophagus | ESCC | 4.56e-03 | 1.45e-01 | 0.0894 |
| 2041 | EPHA1 | P40T-E | Human | Esophagus | ESCC | 5.46e-03 | 1.06e-01 | 0.109 |
| 2041 | EPHA1 | P42T-E | Human | Esophagus | ESCC | 7.44e-06 | 1.20e-01 | 0.1175 |
| 2041 | EPHA1 | P47T-E | Human | Esophagus | ESCC | 4.07e-07 | 1.64e-01 | 0.1067 |
| 2041 | EPHA1 | P48T-E | Human | Esophagus | ESCC | 4.92e-10 | 2.00e-01 | 0.0959 |
| 2041 | EPHA1 | P49T-E | Human | Esophagus | ESCC | 1.31e-16 | 1.30e+00 | 0.1768 |
| 2041 | EPHA1 | P52T-E | Human | Esophagus | ESCC | 2.09e-06 | 1.60e-01 | 0.1555 |
| 2041 | EPHA1 | P54T-E | Human | Esophagus | ESCC | 2.31e-14 | 3.15e-01 | 0.0975 |
| 2041 | EPHA1 | P57T-E | Human | Esophagus | ESCC | 2.18e-10 | 2.25e-01 | 0.0926 |
| 2041 | EPHA1 | P61T-E | Human | Esophagus | ESCC | 2.24e-17 | 4.56e-01 | 0.099 |
| Page: 1 2 3 |
| Tissue | Expression Dynamics | Abbreviation |
| Esophagus | 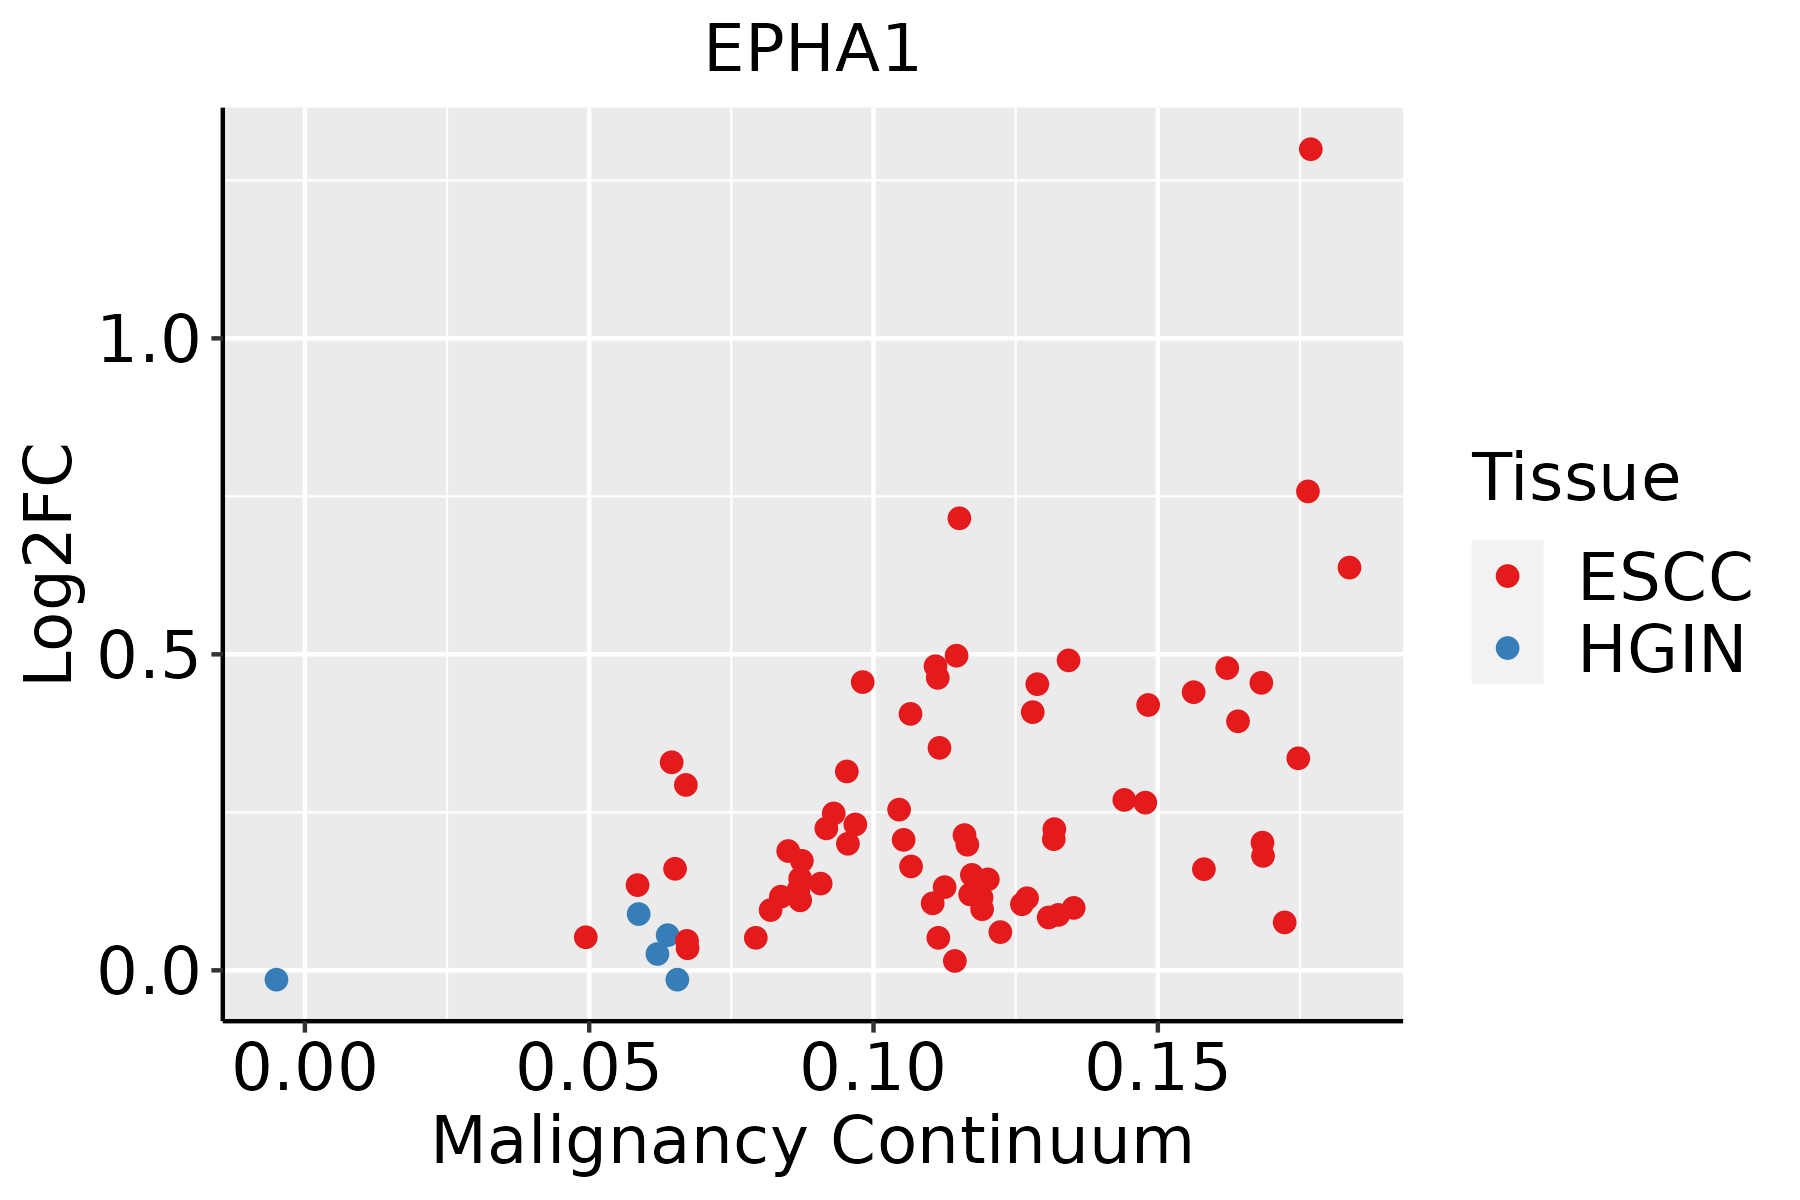 | ESCC: Esophageal squamous cell carcinoma |
| HGIN: High-grade intraepithelial neoplasias | ||
| LGIN: Low-grade intraepithelial neoplasias |
| ∗log2FC in expression of this searched gene in stem-like cells from each diseased tissue sample relative to stem-like cells in normal samples in each tissue plotted against the malignancy continuum. Samples are colored based on if they are from different disease stage. |
Top |
Malignant transformation related pathway analysis |
| Find out the enriched GO biological processes and KEGG pathways involved in transition from healthy to precancer to cancer |
| Tissue | Disease Stage | Enriched GO biological Processes |
| Colorectum | AD |  |
| Colorectum | SER |  |
| Colorectum | MSS |  |
| Colorectum | MSI-H |  |
| Colorectum | FAP |  |
| ∗Top 15 enriched GO BP terms are showed in the bar plot of each disease state in each tissue. Each row represents a significant GO biological process which is colored according to the -log10(p.adjust). |
| Page: 1 2 3 4 5 6 7 8 9 |
| GO ID | Tissue | Disease Stage | Description | Gene Ratio | Bg Ratio | pvalue | p.adjust | Count |
| GO:0010563111 | Esophagus | ESCC | negative regulation of phosphorus metabolic process | 274/8552 | 442/18723 | 2.32e-12 | 9.41e-11 | 274 |
| GO:0045936111 | Esophagus | ESCC | negative regulation of phosphate metabolic process | 273/8552 | 441/18723 | 3.18e-12 | 1.25e-10 | 273 |
| GO:0051348111 | Esophagus | ESCC | negative regulation of transferase activity | 177/8552 | 268/18723 | 1.08e-11 | 4.00e-10 | 177 |
| GO:1902905111 | Esophagus | ESCC | positive regulation of supramolecular fiber organization | 142/8552 | 209/18723 | 5.51e-11 | 1.76e-09 | 142 |
| GO:1902903111 | Esophagus | ESCC | regulation of supramolecular fiber organization | 237/8552 | 383/18723 | 9.06e-11 | 2.75e-09 | 237 |
| GO:0042326111 | Esophagus | ESCC | negative regulation of phosphorylation | 237/8552 | 385/18723 | 1.86e-10 | 5.33e-09 | 237 |
| GO:0001933111 | Esophagus | ESCC | negative regulation of protein phosphorylation | 213/8552 | 342/18723 | 3.54e-10 | 9.76e-09 | 213 |
| GO:003367319 | Esophagus | ESCC | negative regulation of kinase activity | 154/8552 | 237/18723 | 1.38e-09 | 3.27e-08 | 154 |
| GO:000646920 | Esophagus | ESCC | negative regulation of protein kinase activity | 140/8552 | 212/18723 | 1.53e-09 | 3.56e-08 | 140 |
| GO:005149520 | Esophagus | ESCC | positive regulation of cytoskeleton organization | 147/8552 | 226/18723 | 2.93e-09 | 6.38e-08 | 147 |
| GO:003158919 | Esophagus | ESCC | cell-substrate adhesion | 221/8552 | 363/18723 | 3.06e-09 | 6.62e-08 | 221 |
| GO:001081020 | Esophagus | ESCC | regulation of cell-substrate adhesion | 144/8552 | 221/18723 | 3.55e-09 | 7.45e-08 | 144 |
| GO:000701527 | Esophagus | ESCC | actin filament organization | 259/8552 | 442/18723 | 2.37e-08 | 4.50e-07 | 259 |
| GO:004578527 | Esophagus | ESCC | positive regulation of cell adhesion | 255/8552 | 437/18723 | 5.07e-08 | 9.11e-07 | 255 |
| GO:0032970111 | Esophagus | ESCC | regulation of actin filament-based process | 231/8552 | 397/18723 | 2.91e-07 | 4.20e-06 | 231 |
| GO:001081126 | Esophagus | ESCC | positive regulation of cell-substrate adhesion | 84/8552 | 123/18723 | 3.18e-07 | 4.50e-06 | 84 |
| GO:0032956111 | Esophagus | ESCC | regulation of actin cytoskeleton organization | 210/8552 | 358/18723 | 4.40e-07 | 6.00e-06 | 210 |
| GO:011005327 | Esophagus | ESCC | regulation of actin filament organization | 166/8552 | 278/18723 | 1.54e-06 | 1.85e-05 | 166 |
| GO:000195217 | Esophagus | ESCC | regulation of cell-matrix adhesion | 85/8552 | 128/18723 | 1.70e-06 | 2.02e-05 | 85 |
| GO:004677710 | Esophagus | ESCC | protein autophosphorylation | 138/8552 | 227/18723 | 2.98e-06 | 3.38e-05 | 138 |
| Page: 1 2 |
| Pathway ID | Tissue | Disease Stage | Description | Gene Ratio | Bg Ratio | pvalue | p.adjust | qvalue | Count |
| hsa0436016 | Esophagus | ESCC | Axon guidance | 108/4205 | 182/8465 | 5.13e-03 | 1.30e-02 | 6.67e-03 | 108 |
| hsa0436017 | Esophagus | ESCC | Axon guidance | 108/4205 | 182/8465 | 5.13e-03 | 1.30e-02 | 6.67e-03 | 108 |
| Page: 1 |
Top |
Cell-cell communication analysis |
| Identification of potential cell-cell interactions between two cell types and their ligand-receptor pairs for different disease states |
| Ligand | Receptor | LRpair | Pathway | Tissue | Disease Stage |
| EFNA1 | EPHA1 | EFNA1_EPHA1 | EPHA | HNSCC | OSCC |
| EFNA3 | EPHA1 | EFNA3_EPHA1 | EPHA | HNSCC | OSCC |
| EFNA4 | EPHA1 | EFNA4_EPHA1 | EPHA | HNSCC | OSCC |
| EFNA5 | EPHA1 | EFNA5_EPHA1 | EPHA | HNSCC | OSCC |
| EFNA1 | EPHA1 | EFNA1_EPHA1 | EPHA | HNSCC | Precancer |
| EFNA3 | EPHA1 | EFNA3_EPHA1 | EPHA | HNSCC | Precancer |
| EFNA4 | EPHA1 | EFNA4_EPHA1 | EPHA | HNSCC | Precancer |
| EFNA5 | EPHA1 | EFNA5_EPHA1 | EPHA | HNSCC | Precancer |
| Page: 1 |
Top |
Single-cell gene regulatory network inference analysis |
| Find out the significant the regulons (TFs) and the target genes of each regulon across cell types for different disease states |
| TF | Cell Type | Tissue | Disease Stage | Target Gene | RSS | Regulon Activity |
| ∗The dot plots of a searched regulon are shown for all cell subpopulations in each disease state of each tissue based on the regulon specific score inferred using pySCENIC and by calculating the average expression. |
| Page: 1 |
Top |
Somatic mutation of malignant transformation related genes |
| Annotation of somatic variants for genes involved in malignant transformation |
| Hugo Symbol | Variant Class | Variant Classification | dbSNP RS | HGVSc | HGVSp | HGVSp Short | SWISSPROT | BIOTYPE | SIFT | PolyPhen | Tumor Sample Barcode | Tissue | Histology | Sex | Age | Stage | Therapy Types | Drugs | Outcome |
| EPHA1 | SNV | Missense_Mutation | novel | c.1791N>C | p.Lys597Asn | p.K597N | P21709 | protein_coding | deleterious(0.03) | probably_damaging(0.922) | TCGA-A8-A09C-01 | Breast | breast invasive carcinoma | Female | >=65 | I/II | Unknown | Unknown | SD |
| EPHA1 | SNV | Missense_Mutation | novel | c.2782A>G | p.Lys928Glu | p.K928E | P21709 | protein_coding | tolerated(0.91) | benign(0.437) | TCGA-A8-A0A4-01 | Breast | breast invasive carcinoma | Female | >=65 | I/II | Hormone Therapy | tamoxiphen | CR |
| EPHA1 | SNV | Missense_Mutation | novel | c.2371C>A | p.Arg791Ser | p.R791S | P21709 | protein_coding | deleterious(0) | probably_damaging(1) | TCGA-AN-A046-01 | Breast | breast invasive carcinoma | Female | >=65 | I/II | Unknown | Unknown | SD |
| EPHA1 | SNV | Missense_Mutation | c.1581C>G | p.Phe527Leu | p.F527L | P21709 | protein_coding | tolerated(0.08) | benign(0.334) | TCGA-C8-A12N-01 | Breast | breast invasive carcinoma | Female | <65 | I/II | Unknown | Unknown | SD | |
| EPHA1 | SNV | Missense_Mutation | rs571770871 | c.136N>T | p.Pro46Ser | p.P46S | P21709 | protein_coding | tolerated(0.06) | benign(0.107) | TCGA-C8-A12Z-01 | Breast | breast invasive carcinoma | Female | <65 | I/II | Chemotherapy | 5-fluorouracil | CR |
| EPHA1 | SNV | Missense_Mutation | c.2386N>C | p.Glu796Gln | p.E796Q | P21709 | protein_coding | deleterious(0) | probably_damaging(0.999) | TCGA-E9-A243-01 | Breast | breast invasive carcinoma | Female | <65 | I/II | Chemotherapy | 5-fluorouracil | PD | |
| EPHA1 | SNV | Missense_Mutation | novel | c.883C>G | p.Leu295Val | p.L295V | P21709 | protein_coding | tolerated(0.33) | benign(0) | TCGA-PE-A5DE-01 | Breast | breast invasive carcinoma | Female | <65 | I/II | Chemotherapy | taxotere | CR |
| EPHA1 | insertion | Frame_Shift_Ins | novel | c.1792_1793insATTGTGTTCTTGTTAAAAACCCCTCATCAGGT | p.Pro598HisfsTer38 | p.P598Hfs*38 | P21709 | protein_coding | TCGA-A8-A09C-01 | Breast | breast invasive carcinoma | Female | >=65 | I/II | Unknown | Unknown | SD | ||
| EPHA1 | insertion | Nonsense_Mutation | novel | c.2779_2780insGGGCGGGGATCCTGCATCCCTAGACCATGTTGGGTCC | p.Met927ArgfsTer8 | p.M927Rfs*8 | P21709 | protein_coding | TCGA-A8-A0A4-01 | Breast | breast invasive carcinoma | Female | >=65 | I/II | Hormone Therapy | tamoxiphen | CR | ||
| EPHA1 | deletion | Frame_Shift_Del | novel | c.2886delN | p.His963ThrfsTer73 | p.H963Tfs*73 | P21709 | protein_coding | TCGA-EW-A2FV-01 | Breast | breast invasive carcinoma | Female | <65 | III/IV | Chemotherapy | docetaxel | SD |
| Page: 1 2 3 4 5 6 7 8 9 10 |
Top |
Related drugs of malignant transformation related genes |
| Identification of chemicals and drugs interact with genes involved in malignant transfromation |
| (DGIdb 4.0) |
| Entrez ID | Symbol | Category | Interaction Types | Drug Claim Name | Drug Name | PMIDs |
| 2041 | EPHA1 | DRUGGABLE GENOME, KINASE, TYROSINE KINASE | inhibitor | 249565804 | ||
| 2041 | EPHA1 | DRUGGABLE GENOME, KINASE, TYROSINE KINASE | inhibitor | CHEMBL24828 | VANDETANIB | |
| 2041 | EPHA1 | DRUGGABLE GENOME, KINASE, TYROSINE KINASE | inhibitor | 249565821 |
| Page: 1 |

Copyright 2023-Present -The University of Texas Health Science Center at Houston |