
|
|||||
|
 | |
| |
| |
| |
| |
| |
|
Gene: EPB42 |
Gene summary for EPB42 |
| Gene information | Species | Human | Gene symbol | EPB42 | Gene ID | 2038 |
| Gene name | erythrocyte membrane protein band 4.2 | |
| Gene Alias | PA | |
| Cytomap | 15q15.2 | |
| Gene Type | protein-coding | GO ID | GO:0000902 | UniProtAcc | P16452 |
Top |
Malignant transformation analysis |
| Identification of the aberrant gene expression in precancerous and cancerous lesions by comparing the gene expression of stem-like cells in diseased tissues with normal stem cells |
| Entrez ID | Symbol | Replicates | Species | Organ | Tissue | Adj P-value | Log2FC | Malignancy |
| 2038 | EPB42 | HTA11_4255_2000001011 | Human | Colorectum | SER | 1.51e-11 | 5.15e-01 | 0.0446 |
| 2038 | EPB42 | HTA11_9408_2000001011 | Human | Colorectum | AD | 9.81e-03 | 2.34e-01 | 0.0451 |
| 2038 | EPB42 | HTA11_8622_2000001021 | Human | Colorectum | SER | 5.63e-12 | 5.44e-01 | 0.0528 |
| 2038 | EPB42 | HTA11_7663_2000001011 | Human | Colorectum | SER | 1.71e-18 | 7.62e-01 | 0.0131 |
| 2038 | EPB42 | HTA11_10623_2000001011 | Human | Colorectum | AD | 5.57e-13 | 5.17e-01 | -0.0177 |
| 2038 | EPB42 | HTA11_6801_2000001011 | Human | Colorectum | SER | 1.19e-07 | 3.87e-01 | 0.0171 |
| 2038 | EPB42 | HTA11_10711_2000001011 | Human | Colorectum | AD | 1.53e-17 | 4.92e-01 | 0.0338 |
| 2038 | EPB42 | HTA11_7696_3000711011 | Human | Colorectum | AD | 2.10e-17 | 3.51e-01 | 0.0674 |
| 2038 | EPB42 | HTA11_6818_2000001011 | Human | Colorectum | AD | 7.12e-28 | 9.56e-01 | 0.0112 |
| 2038 | EPB42 | HTA11_7469_2000001011 | Human | Colorectum | AD | 6.07e-11 | 7.37e-01 | -0.0124 |
| 2038 | EPB42 | HTA11_11156_2000001011 | Human | Colorectum | AD | 1.57e-05 | 3.90e-01 | 0.0397 |
| 2038 | EPB42 | HTA11_6818_2000001021 | Human | Colorectum | AD | 2.57e-46 | 1.23e+00 | 0.0588 |
| 2038 | EPB42 | HTA11_99999970781_79442 | Human | Colorectum | MSS | 1.59e-37 | 7.40e-01 | 0.294 |
| 2038 | EPB42 | HTA11_99999965062_69753 | Human | Colorectum | MSI-H | 1.89e-11 | 1.20e+00 | 0.3487 |
| 2038 | EPB42 | HTA11_99999965104_69814 | Human | Colorectum | MSS | 8.49e-18 | 4.93e-01 | 0.281 |
| 2038 | EPB42 | HTA11_99999971662_82457 | Human | Colorectum | MSS | 3.40e-53 | 1.07e+00 | 0.3859 |
| 2038 | EPB42 | HTA11_99999973899_84307 | Human | Colorectum | MSS | 8.26e-07 | 3.35e-01 | 0.2585 |
| 2038 | EPB42 | HTA11_99999974143_84620 | Human | Colorectum | MSS | 1.15e-20 | 4.26e-01 | 0.3005 |
| Page: 1 2 |
| Tissue | Expression Dynamics | Abbreviation |
| Colorectum (GSE201348) | 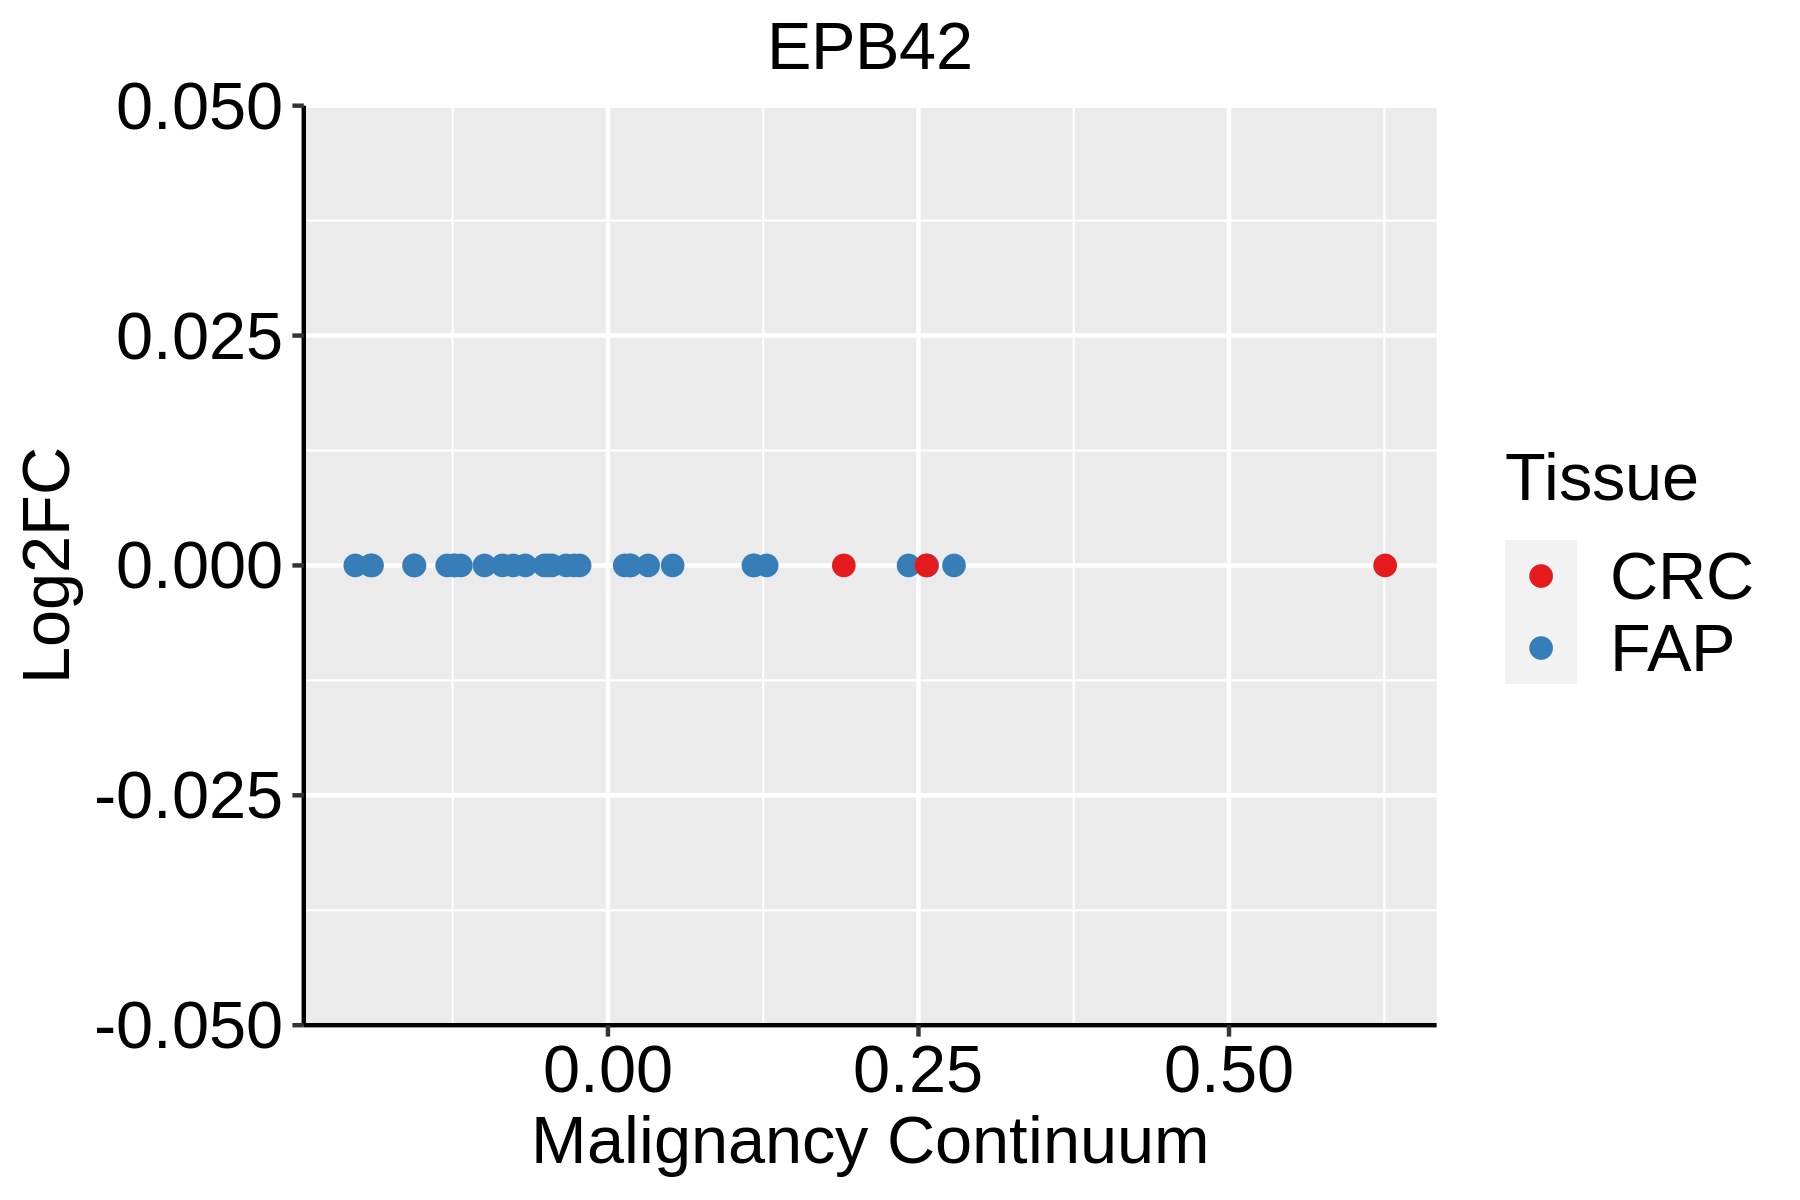 | FAP: Familial adenomatous polyposis |
| CRC: Colorectal cancer | ||
| Colorectum (HTA11) |  | AD: Adenomas |
| SER: Sessile serrated lesions | ||
| MSI-H: Microsatellite-high colorectal cancer | ||
| MSS: Microsatellite stable colorectal cancer |
| ∗log2FC in expression of this searched gene in stem-like cells from each diseased tissue sample relative to stem-like cells in normal samples in each tissue plotted against the malignancy continuum. Samples are colored based on if they are from different disease stage. |
Top |
Malignant transformation related pathway analysis |
| Find out the enriched GO biological processes and KEGG pathways involved in transition from healthy to precancer to cancer |
| Tissue | Disease Stage | Enriched GO biological Processes |
| Colorectum | AD |  |
| Colorectum | SER |  |
| Colorectum | MSS |  |
| Colorectum | MSI-H |  |
| Colorectum | FAP |  |
| ∗Top 15 enriched GO BP terms are showed in the bar plot of each disease state in each tissue. Each row represents a significant GO biological process which is colored according to the -log10(p.adjust). |
| Page: 1 2 3 4 5 6 7 8 9 |
| GO ID | Tissue | Disease Stage | Description | Gene Ratio | Bg Ratio | pvalue | p.adjust | Count |
| GO:0022604 | Colorectum | AD | regulation of cell morphogenesis | 109/3918 | 309/18723 | 3.08e-09 | 2.07e-07 | 109 |
| GO:0034101 | Colorectum | AD | erythrocyte homeostasis | 51/3918 | 129/18723 | 1.07e-06 | 3.59e-05 | 51 |
| GO:0030099 | Colorectum | AD | myeloid cell differentiation | 119/3918 | 381/18723 | 1.24e-06 | 4.01e-05 | 119 |
| GO:0055076 | Colorectum | AD | transition metal ion homeostasis | 53/3918 | 138/18723 | 1.89e-06 | 5.65e-05 | 53 |
| GO:0002262 | Colorectum | AD | myeloid cell homeostasis | 57/3918 | 157/18723 | 6.17e-06 | 1.56e-04 | 57 |
| GO:0008360 | Colorectum | AD | regulation of cell shape | 56/3918 | 154/18723 | 7.01e-06 | 1.73e-04 | 56 |
| GO:0048872 | Colorectum | AD | homeostasis of number of cells | 87/3918 | 272/18723 | 1.16e-05 | 2.61e-04 | 87 |
| GO:0030218 | Colorectum | AD | erythrocyte differentiation | 45/3918 | 120/18723 | 2.22e-05 | 4.39e-04 | 45 |
| GO:0055072 | Colorectum | AD | iron ion homeostasis | 32/3918 | 85/18723 | 2.97e-04 | 3.60e-03 | 32 |
| GO:00226041 | Colorectum | SER | regulation of cell morphogenesis | 89/2897 | 309/18723 | 1.51e-09 | 1.52e-07 | 89 |
| GO:00550761 | Colorectum | SER | transition metal ion homeostasis | 41/2897 | 138/18723 | 1.66e-05 | 5.05e-04 | 41 |
| GO:00341011 | Colorectum | SER | erythrocyte homeostasis | 39/2897 | 129/18723 | 1.70e-05 | 5.11e-04 | 39 |
| GO:00022621 | Colorectum | SER | myeloid cell homeostasis | 44/2897 | 157/18723 | 4.09e-05 | 1.03e-03 | 44 |
| GO:00083601 | Colorectum | SER | regulation of cell shape | 43/2897 | 154/18723 | 5.47e-05 | 1.30e-03 | 43 |
| GO:00488721 | Colorectum | SER | homeostasis of number of cells | 65/2897 | 272/18723 | 1.70e-04 | 3.19e-03 | 65 |
| GO:00302181 | Colorectum | SER | erythrocyte differentiation | 33/2897 | 120/18723 | 5.15e-04 | 7.30e-03 | 33 |
| GO:00550721 | Colorectum | SER | iron ion homeostasis | 24/2897 | 85/18723 | 1.91e-03 | 1.93e-02 | 24 |
| GO:00300991 | Colorectum | SER | myeloid cell differentiation | 80/2897 | 381/18723 | 2.28e-03 | 2.18e-02 | 80 |
| GO:00226042 | Colorectum | MSS | regulation of cell morphogenesis | 103/3467 | 309/18723 | 2.70e-10 | 2.56e-08 | 103 |
| GO:00341012 | Colorectum | MSS | erythrocyte homeostasis | 49/3467 | 129/18723 | 1.58e-07 | 7.19e-06 | 49 |
| Page: 1 2 |
| Pathway ID | Tissue | Disease Stage | Description | Gene Ratio | Bg Ratio | pvalue | p.adjust | qvalue | Count |
| Page: 1 |
Top |
Cell-cell communication analysis |
| Identification of potential cell-cell interactions between two cell types and their ligand-receptor pairs for different disease states |
| Ligand | Receptor | LRpair | Pathway | Tissue | Disease Stage |
| Page: 1 |
Top |
Single-cell gene regulatory network inference analysis |
| Find out the significant the regulons (TFs) and the target genes of each regulon across cell types for different disease states |
| TF | Cell Type | Tissue | Disease Stage | Target Gene | RSS | Regulon Activity |
| ∗The dot plots of a searched regulon are shown for all cell subpopulations in each disease state of each tissue based on the regulon specific score inferred using pySCENIC and by calculating the average expression. |
| Page: 1 |
Top |
Somatic mutation of malignant transformation related genes |
| Annotation of somatic variants for genes involved in malignant transformation |
| Hugo Symbol | Variant Class | Variant Classification | dbSNP RS | HGVSc | HGVSp | HGVSp Short | SWISSPROT | BIOTYPE | SIFT | PolyPhen | Tumor Sample Barcode | Tissue | Histology | Sex | Age | Stage | Therapy Types | Drugs | Outcome |
| EPB42 | SNV | Missense_Mutation | rs116008388 | c.1463G>A | p.Arg488His | p.R488H | P16452 | protein_coding | tolerated(0.59) | benign(0) | TCGA-BH-A0HF-01 | Breast | breast invasive carcinoma | Female | >=65 | I/II | Hormone Therapy | arimidex | SD |
| EPB42 | SNV | Missense_Mutation | c.80N>A | p.Ile27Asn | p.I27N | P16452 | protein_coding | tolerated_low_confidence(0.56) | benign(0.118) | TCGA-C8-A12U-01 | Breast | breast invasive carcinoma | Female | <65 | I/II | Unknown | Unknown | SD | |
| EPB42 | insertion | In_Frame_Ins | novel | c.1362_1363insCCCAACCTTGCTCTCTCATCATTCAAGGGGAGAATTCAT | p.Gly454_Ser455insProAsnLeuAlaLeuSerSerPheLysGlyArgIleHis | p.G454_S455insPNLALSSFKGRIH | P16452 | protein_coding | TCGA-A2-A0D1-01 | Breast | breast invasive carcinoma | Female | >=65 | I/II | Chemotherapy | taxotere | SD | ||
| EPB42 | insertion | In_Frame_Ins | novel | c.957_958insCCAGGCTGCATTTCCAGA | p.Val319_Thr320insProGlyCysIleSerArg | p.V319_T320insPGCISR | P16452 | protein_coding | TCGA-A7-A0CE-01 | Breast | breast invasive carcinoma | Female | <65 | I/II | Chemotherapy | adriamycin | SD | ||
| EPB42 | SNV | Missense_Mutation | rs755579126 | c.872N>A | p.Arg291Gln | p.R291Q | P16452 | protein_coding | tolerated(0.41) | possibly_damaging(0.563) | TCGA-2W-A8YY-01 | Cervix | cervical & endocervical cancer | Female | <65 | I/II | Chemotherapy | cisplatin | CR |
| EPB42 | SNV | Missense_Mutation | rs747441833 | c.1465N>A | p.Glu489Lys | p.E489K | P16452 | protein_coding | tolerated(0.81) | benign(0) | TCGA-C5-A2LZ-01 | Cervix | cervical & endocervical cancer | Female | >=65 | III/IV | Unknown | Unknown | PD |
| EPB42 | SNV | Missense_Mutation | novel | c.788C>T | p.Thr263Ile | p.T263I | P16452 | protein_coding | tolerated(0.13) | benign(0.027) | TCGA-5M-AAT6-01 | Colorectum | colon adenocarcinoma | Female | <65 | III/IV | Unknown | Unknown | PD |
| EPB42 | SNV | Missense_Mutation | c.287N>A | p.Gly96Glu | p.G96E | P16452 | protein_coding | deleterious(0) | probably_damaging(0.988) | TCGA-A6-5661-01 | Colorectum | colon adenocarcinoma | Female | >=65 | I/II | Unknown | Unknown | SD | |
| EPB42 | SNV | Missense_Mutation | rs146348439 | c.671N>A | p.Arg224His | p.R224H | P16452 | protein_coding | tolerated(0.12) | possibly_damaging(0.553) | TCGA-AA-3509-01 | Colorectum | colon adenocarcinoma | Female | <65 | I/II | Unknown | Unknown | SD |
| EPB42 | SNV | Missense_Mutation | rs765302713 | c.952N>A | p.Val318Met | p.V318M | P16452 | protein_coding | deleterious(0) | probably_damaging(0.992) | TCGA-AA-3710-01 | Colorectum | colon adenocarcinoma | Female | >=65 | I/II | Unknown | Unknown | SD |
| Page: 1 2 3 4 5 6 7 8 |
Top |
Related drugs of malignant transformation related genes |
| Identification of chemicals and drugs interact with genes involved in malignant transfromation |
| (DGIdb 4.0) |
| Entrez ID | Symbol | Category | Interaction Types | Drug Claim Name | Drug Name | PMIDs |
| Page: 1 |

Copyright 2023-Present -The University of Texas Health Science Center at Houston |