
|
|||||
|
 | |
| |
| |
| |
| |
| |
|
Gene: EPB41L4A |
Gene summary for EPB41L4A |
| Gene information | Species | Human | Gene symbol | EPB41L4A | Gene ID | 64097 |
| Gene name | erythrocyte membrane protein band 4.1 like 4A | |
| Gene Alias | EPB41L4 | |
| Cytomap | 5q22.1-q22.2 | |
| Gene Type | protein-coding | GO ID | GO:0006996 | UniProtAcc | Q8N8X1 |
Top |
Malignant transformation analysis |
| Identification of the aberrant gene expression in precancerous and cancerous lesions by comparing the gene expression of stem-like cells in diseased tissues with normal stem cells |
| Entrez ID | Symbol | Replicates | Species | Organ | Tissue | Adj P-value | Log2FC | Malignancy |
| 64097 | EPB41L4A | A001-C-119 | Human | Colorectum | FAP | 1.69e-04 | -4.55e-01 | -0.1557 |
| 64097 | EPB41L4A | A001-C-108 | Human | Colorectum | FAP | 5.25e-10 | -2.71e-01 | -0.0272 |
| 64097 | EPB41L4A | A002-C-205 | Human | Colorectum | FAP | 1.23e-18 | -5.81e-01 | -0.1236 |
| 64097 | EPB41L4A | A001-C-104 | Human | Colorectum | FAP | 4.24e-07 | -4.03e-01 | 0.0184 |
| 64097 | EPB41L4A | A015-C-005 | Human | Colorectum | FAP | 6.79e-03 | -3.76e-01 | -0.0336 |
| 64097 | EPB41L4A | A015-C-006 | Human | Colorectum | FAP | 8.13e-13 | -5.84e-01 | -0.0994 |
| 64097 | EPB41L4A | A015-C-106 | Human | Colorectum | FAP | 3.98e-11 | -3.53e-01 | -0.0511 |
| 64097 | EPB41L4A | A002-C-114 | Human | Colorectum | FAP | 1.36e-13 | -5.32e-01 | -0.1561 |
| 64097 | EPB41L4A | A015-C-104 | Human | Colorectum | FAP | 6.16e-18 | -4.77e-01 | -0.1899 |
| 64097 | EPB41L4A | A001-C-014 | Human | Colorectum | FAP | 1.64e-09 | -2.38e-01 | 0.0135 |
| 64097 | EPB41L4A | A002-C-016 | Human | Colorectum | FAP | 1.10e-17 | -4.63e-01 | 0.0521 |
| 64097 | EPB41L4A | A015-C-002 | Human | Colorectum | FAP | 7.12e-06 | -3.58e-01 | -0.0763 |
| 64097 | EPB41L4A | A001-C-007 | Human | Colorectum | CRC | 1.75e-10 | -6.49e-01 | 0.1899 |
| 64097 | EPB41L4A | A001-C-203 | Human | Colorectum | FAP | 1.83e-08 | -3.35e-01 | -0.0481 |
| 64097 | EPB41L4A | A002-C-116 | Human | Colorectum | FAP | 4.34e-26 | -5.85e-01 | -0.0452 |
| 64097 | EPB41L4A | A014-C-008 | Human | Colorectum | FAP | 7.77e-11 | -4.99e-01 | -0.191 |
| 64097 | EPB41L4A | A018-E-020 | Human | Colorectum | FAP | 2.04e-14 | -5.07e-01 | -0.2034 |
| 64097 | EPB41L4A | F034 | Human | Colorectum | FAP | 3.25e-24 | -5.54e-01 | -0.0665 |
| 64097 | EPB41L4A | F072B | Human | Colorectum | FAP | 5.11e-24 | -5.90e-01 | 0.257 |
| 64097 | EPB41L4A | CRC-1-8810 | Human | Colorectum | CRC | 5.22e-22 | -5.48e-01 | 0.6257 |
| Page: 1 2 3 4 |
| Tissue | Expression Dynamics | Abbreviation |
| Colorectum (GSE201348) |  | FAP: Familial adenomatous polyposis |
| CRC: Colorectal cancer | ||
| Colorectum (HTA11) |  | AD: Adenomas |
| SER: Sessile serrated lesions | ||
| MSI-H: Microsatellite-high colorectal cancer | ||
| MSS: Microsatellite stable colorectal cancer | ||
| Endometrium |  | AEH: Atypical endometrial hyperplasia |
| EEC: Endometrioid Cancer | ||
| Lung | 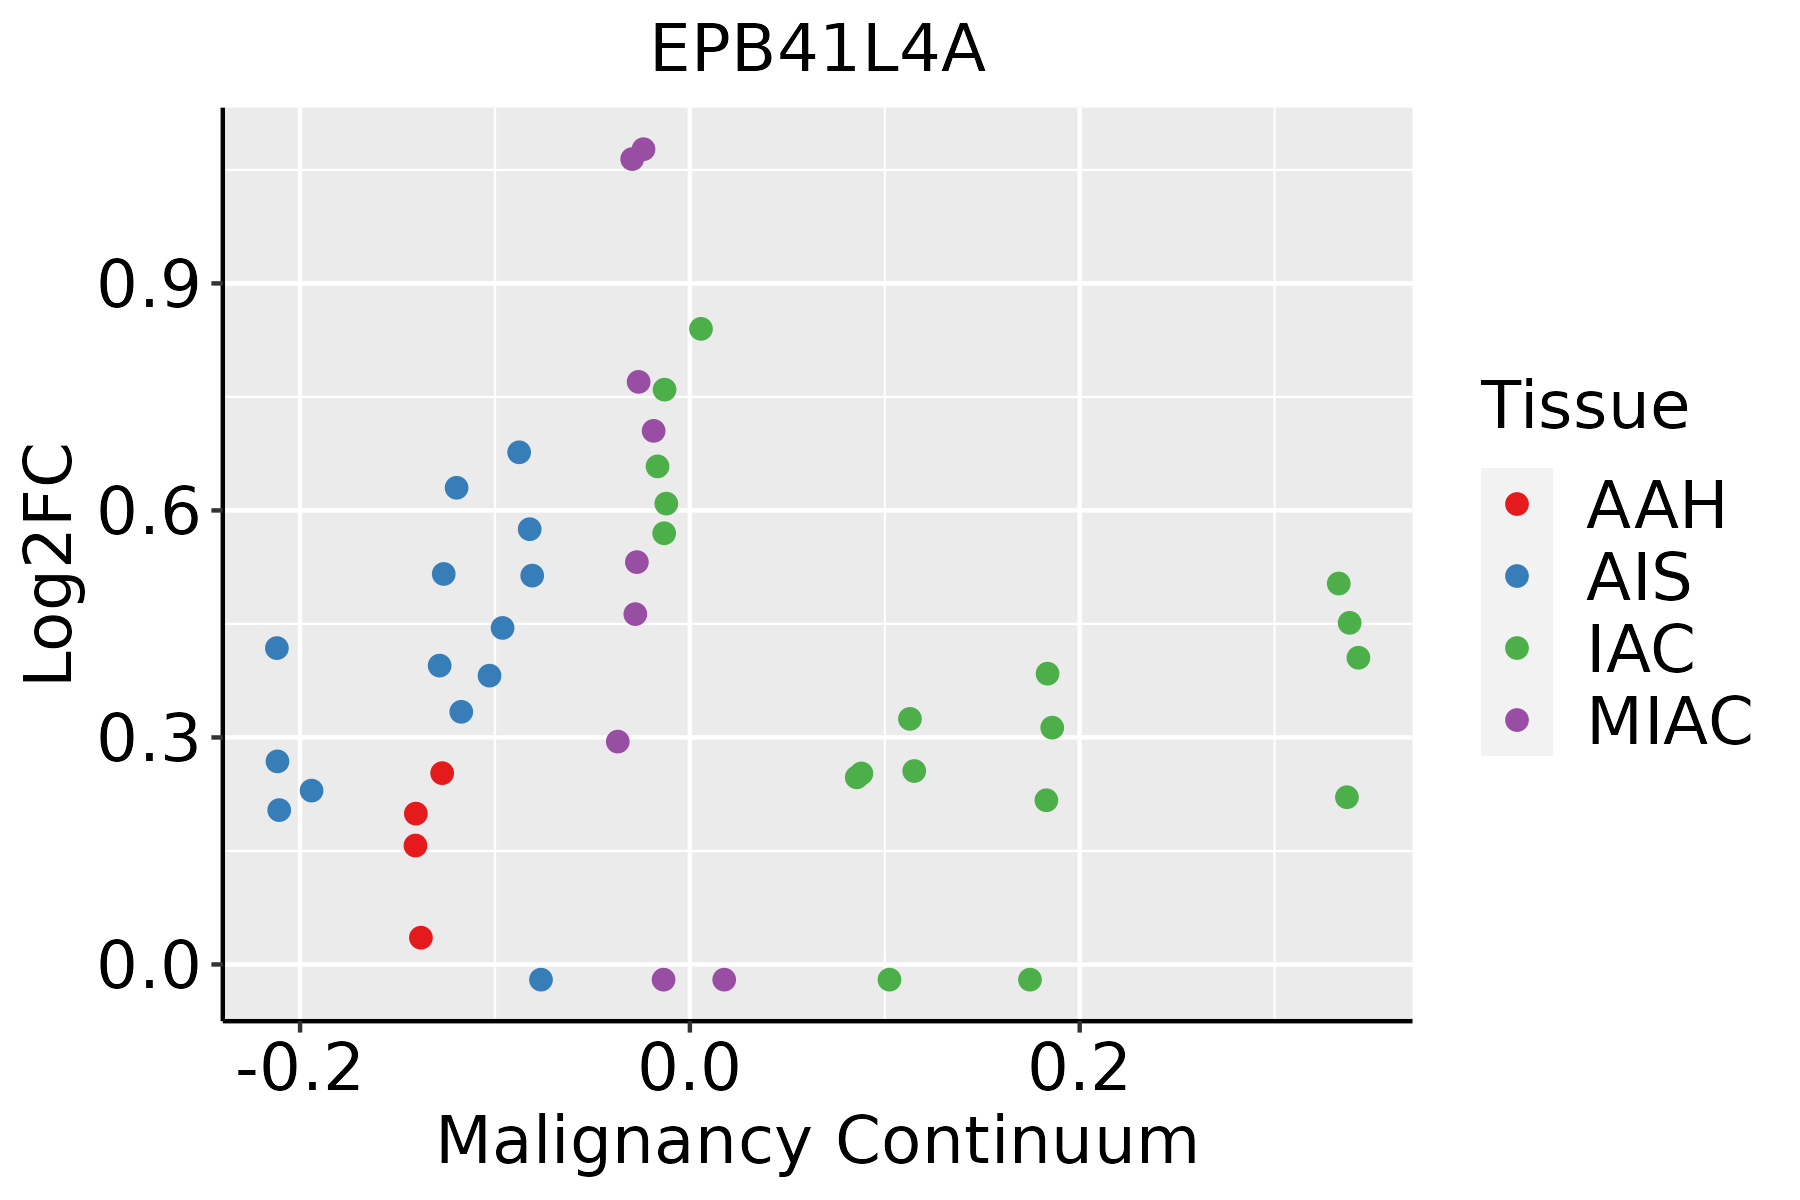 | AAH: Atypical adenomatous hyperplasia |
| AIS: Adenocarcinoma in situ | ||
| IAC: Invasive lung adenocarcinoma | ||
| MIA: Minimally invasive adenocarcinoma | ||
| Thyroid | 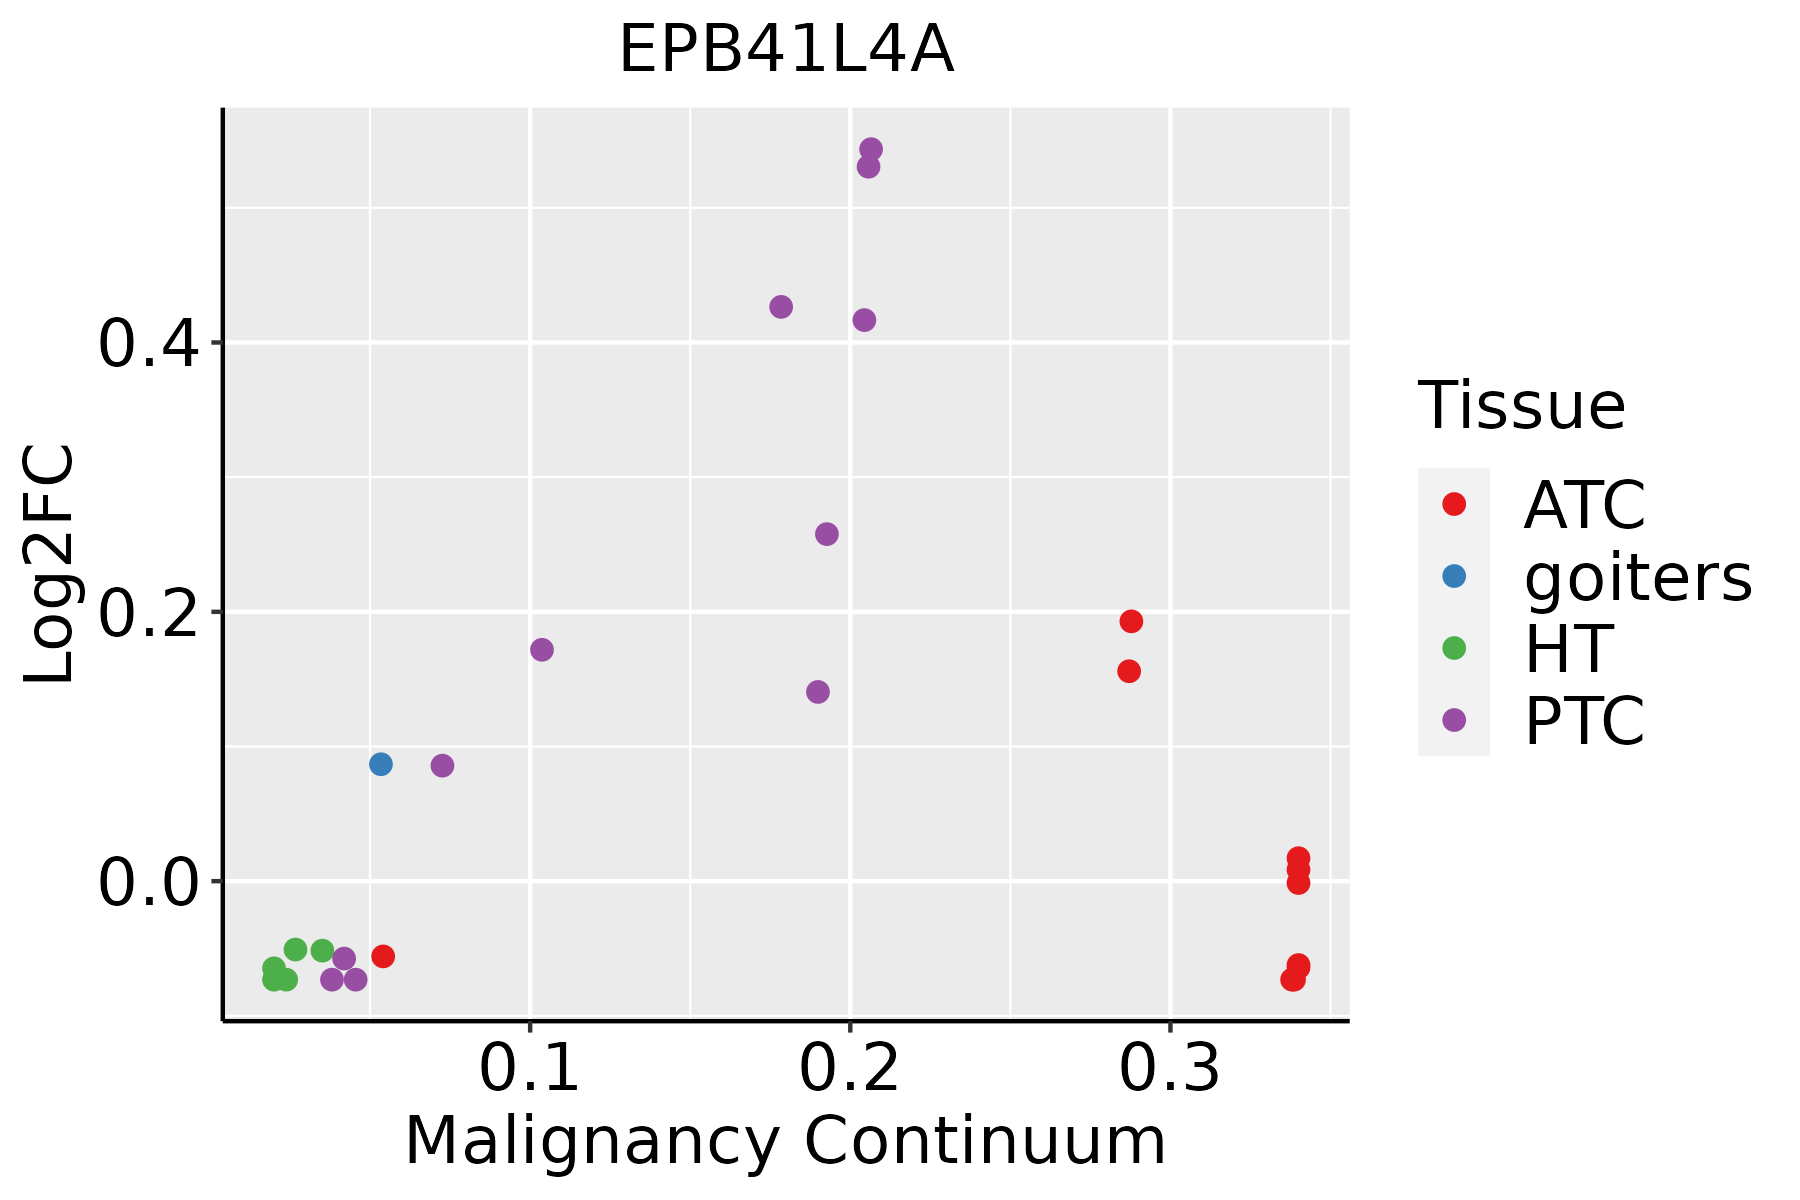 | ATC: Anaplastic thyroid cancer |
| HT: Hashimoto's thyroiditis | ||
| PTC: Papillary thyroid cancer |
| ∗log2FC in expression of this searched gene in stem-like cells from each diseased tissue sample relative to stem-like cells in normal samples in each tissue plotted against the malignancy continuum. Samples are colored based on if they are from different disease stage. |
Top |
Malignant transformation related pathway analysis |
| Find out the enriched GO biological processes and KEGG pathways involved in transition from healthy to precancer to cancer |
| Tissue | Disease Stage | Enriched GO biological Processes |
| Colorectum | AD |  |
| Colorectum | SER |  |
| Colorectum | MSS |  |
| Colorectum | MSI-H |  |
| Colorectum | FAP |  |
| ∗Top 15 enriched GO BP terms are showed in the bar plot of each disease state in each tissue. Each row represents a significant GO biological process which is colored according to the -log10(p.adjust). |
| Page: 1 2 3 4 5 6 7 8 9 |
| GO ID | Tissue | Disease Stage | Description | Gene Ratio | Bg Ratio | pvalue | p.adjust | Count |
| GO:0031032 | Colorectum | AD | actomyosin structure organization | 65/3918 | 196/18723 | 4.17e-05 | 7.37e-04 | 65 |
| GO:00310321 | Colorectum | SER | actomyosin structure organization | 45/2897 | 196/18723 | 3.60e-03 | 3.03e-02 | 45 |
| GO:00310322 | Colorectum | MSS | actomyosin structure organization | 53/3467 | 196/18723 | 2.04e-03 | 1.75e-02 | 53 |
| GO:00310323 | Colorectum | FAP | actomyosin structure organization | 51/2622 | 196/18723 | 5.89e-06 | 1.88e-04 | 51 |
| GO:00310324 | Colorectum | CRC | actomyosin structure organization | 45/2078 | 196/18723 | 1.49e-06 | 8.14e-05 | 45 |
| GO:003103210 | Endometrium | AEH | actomyosin structure organization | 46/2100 | 196/18723 | 8.00e-07 | 2.91e-05 | 46 |
| GO:003103214 | Endometrium | EEC | actomyosin structure organization | 46/2168 | 196/18723 | 1.94e-06 | 5.80e-05 | 46 |
| GO:00310327 | Lung | IAC | actomyosin structure organization | 46/2061 | 196/18723 | 4.70e-07 | 3.10e-05 | 46 |
| GO:003103213 | Lung | AIS | actomyosin structure organization | 43/1849 | 196/18723 | 4.08e-07 | 3.25e-05 | 43 |
| GO:003103232 | Lung | MIAC | actomyosin structure organization | 27/967 | 196/18723 | 3.17e-06 | 3.45e-04 | 27 |
| GO:0031032110 | Thyroid | PTC | actomyosin structure organization | 91/5968 | 196/18723 | 1.35e-05 | 1.45e-04 | 91 |
| GO:003103226 | Thyroid | ATC | actomyosin structure organization | 98/6293 | 196/18723 | 1.44e-06 | 1.77e-05 | 98 |
| Page: 1 |
| Pathway ID | Tissue | Disease Stage | Description | Gene Ratio | Bg Ratio | pvalue | p.adjust | qvalue | Count |
| Page: 1 |
Top |
Cell-cell communication analysis |
| Identification of potential cell-cell interactions between two cell types and their ligand-receptor pairs for different disease states |
| Ligand | Receptor | LRpair | Pathway | Tissue | Disease Stage |
| Page: 1 |
Top |
Single-cell gene regulatory network inference analysis |
| Find out the significant the regulons (TFs) and the target genes of each regulon across cell types for different disease states |
| TF | Cell Type | Tissue | Disease Stage | Target Gene | RSS | Regulon Activity |
| ∗The dot plots of a searched regulon are shown for all cell subpopulations in each disease state of each tissue based on the regulon specific score inferred using pySCENIC and by calculating the average expression. |
| Page: 1 |
Top |
Somatic mutation of malignant transformation related genes |
| Annotation of somatic variants for genes involved in malignant transformation |
| Hugo Symbol | Variant Class | Variant Classification | dbSNP RS | HGVSc | HGVSp | HGVSp Short | SWISSPROT | BIOTYPE | SIFT | PolyPhen | Tumor Sample Barcode | Tissue | Histology | Sex | Age | Stage | Therapy Types | Drugs | Outcome |
| EPB41L4A | SNV | Missense_Mutation | c.1694G>A | p.Gly565Glu | p.G565E | Q9HCS5 | protein_coding | deleterious(0) | possibly_damaging(0.759) | TCGA-A2-A0EX-01 | Breast | breast invasive carcinoma | Female | <65 | I/II | Hormone Therapy | tamoxiphen | SD | |
| EPB41L4A | SNV | Missense_Mutation | c.145N>A | p.Val49Ile | p.V49I | Q9HCS5 | protein_coding | tolerated(0.36) | benign(0) | TCGA-AR-A0TV-01 | Breast | breast invasive carcinoma | Female | >=65 | I/II | Unknown | Unknown | SD | |
| EPB41L4A | SNV | Missense_Mutation | novel | c.1975N>G | p.Gln659Glu | p.Q659E | Q9HCS5 | protein_coding | tolerated_low_confidence(0.14) | benign(0.015) | TCGA-BH-A0W7-01 | Breast | breast invasive carcinoma | Female | <65 | I/II | Chemotherapy | taxotere | CR |
| EPB41L4A | SNV | Missense_Mutation | c.1405N>C | p.Asp469His | p.D469H | Q9HCS5 | protein_coding | tolerated(0.1) | possibly_damaging(0.459) | TCGA-EW-A1J5-01 | Breast | breast invasive carcinoma | Female | <65 | I/II | Chemotherapy | adriamycin | SD | |
| EPB41L4A | SNV | Missense_Mutation | novel | c.1231N>T | p.His411Tyr | p.H411Y | Q9HCS5 | protein_coding | deleterious(0.01) | benign(0.04) | TCGA-C5-A1MH-01 | Cervix | cervical & endocervical cancer | Female | >=65 | III/IV | Chemotherapy | cisplatin | PD |
| EPB41L4A | insertion | Frame_Shift_Ins | novel | c.493_494insATCATTCTAGAAACTTTTC | p.Phe165TyrfsTer10 | p.F165Yfs*10 | Q9HCS5 | protein_coding | TCGA-DS-A1OB-01 | Cervix | cervical & endocervical cancer | Female | <65 | I/II | Chemotherapy | carboplatin | PD | ||
| EPB41L4A | SNV | Missense_Mutation | novel | c.1537N>T | p.Pro513Ser | p.P513S | Q9HCS5 | protein_coding | tolerated(0.14) | possibly_damaging(0.727) | TCGA-A6-2672-01 | Colorectum | colon adenocarcinoma | Female | >=65 | III/IV | Unknown | Unknown | SD |
| EPB41L4A | SNV | Missense_Mutation | novel | c.1981N>C | p.Ser661Pro | p.S661P | Q9HCS5 | protein_coding | deleterious_low_confidence(0.01) | benign(0.23) | TCGA-A6-3808-01 | Colorectum | colon adenocarcinoma | Male | >=65 | I/II | Unknown | Unknown | SD |
| EPB41L4A | SNV | Missense_Mutation | rs750489592 | c.1289G>A | p.Arg430His | p.R430H | Q9HCS5 | protein_coding | deleterious(0.01) | probably_damaging(0.996) | TCGA-AA-3492-01 | Colorectum | colon adenocarcinoma | Female | >=65 | I/II | Unknown | Unknown | SD |
| EPB41L4A | SNV | Missense_Mutation | c.129C>G | p.Asp43Glu | p.D43E | Q9HCS5 | protein_coding | tolerated(0.07) | benign(0.009) | TCGA-AA-3492-01 | Colorectum | colon adenocarcinoma | Female | >=65 | I/II | Unknown | Unknown | SD |
| Page: 1 2 3 4 5 6 7 8 9 10 |
Top |
Related drugs of malignant transformation related genes |
| Identification of chemicals and drugs interact with genes involved in malignant transfromation |
| (DGIdb 4.0) |
| Entrez ID | Symbol | Category | Interaction Types | Drug Claim Name | Drug Name | PMIDs |
| Page: 1 |

Copyright 2023-Present -The University of Texas Health Science Center at Houston |