
|
|||||
|
 | |
| |
| |
| |
| |
| |
|
Gene: EMSY |
Gene summary for EMSY |
| Gene information | Species | Human | Gene symbol | EMSY | Gene ID | 56946 |
| Gene name | EMSY transcriptional repressor, BRCA2 interacting | |
| Gene Alias | C11orf30 | |
| Cytomap | 11q13.5 | |
| Gene Type | protein-coding | GO ID | GO:0006139 | UniProtAcc | Q7Z589 |
Top |
Malignant transformation analysis |
| Identification of the aberrant gene expression in precancerous and cancerous lesions by comparing the gene expression of stem-like cells in diseased tissues with normal stem cells |
| Entrez ID | Symbol | Replicates | Species | Organ | Tissue | Adj P-value | Log2FC | Malignancy |
| 56946 | EMSY | P19T-E | Human | Esophagus | ESCC | 1.84e-03 | 1.73e-01 | 0.1662 |
| 56946 | EMSY | P20T-E | Human | Esophagus | ESCC | 1.37e-08 | 6.94e-02 | 0.1124 |
| 56946 | EMSY | P21T-E | Human | Esophagus | ESCC | 1.33e-15 | 1.42e-01 | 0.1617 |
| 56946 | EMSY | P22T-E | Human | Esophagus | ESCC | 3.80e-08 | 1.23e-02 | 0.1236 |
| 56946 | EMSY | P23T-E | Human | Esophagus | ESCC | 3.60e-23 | 4.26e-01 | 0.108 |
| 56946 | EMSY | P26T-E | Human | Esophagus | ESCC | 2.29e-14 | 1.31e-01 | 0.1276 |
| 56946 | EMSY | P27T-E | Human | Esophagus | ESCC | 8.25e-20 | 1.95e-01 | 0.1055 |
| 56946 | EMSY | P28T-E | Human | Esophagus | ESCC | 3.62e-27 | 4.03e-01 | 0.1149 |
| 56946 | EMSY | P30T-E | Human | Esophagus | ESCC | 1.65e-21 | 4.82e-01 | 0.137 |
| 56946 | EMSY | P31T-E | Human | Esophagus | ESCC | 4.76e-13 | 1.46e-01 | 0.1251 |
| 56946 | EMSY | P32T-E | Human | Esophagus | ESCC | 1.92e-11 | 8.86e-02 | 0.1666 |
| 56946 | EMSY | P36T-E | Human | Esophagus | ESCC | 2.20e-06 | 1.50e-01 | 0.1187 |
| 56946 | EMSY | P37T-E | Human | Esophagus | ESCC | 4.48e-12 | 9.23e-02 | 0.1371 |
| 56946 | EMSY | P40T-E | Human | Esophagus | ESCC | 5.70e-06 | 9.54e-02 | 0.109 |
| 56946 | EMSY | P42T-E | Human | Esophagus | ESCC | 1.76e-08 | 1.00e-01 | 0.1175 |
| 56946 | EMSY | P47T-E | Human | Esophagus | ESCC | 5.76e-07 | 4.30e-02 | 0.1067 |
| 56946 | EMSY | P48T-E | Human | Esophagus | ESCC | 2.06e-12 | 1.54e-01 | 0.0959 |
| 56946 | EMSY | P49T-E | Human | Esophagus | ESCC | 4.20e-14 | 7.80e-01 | 0.1768 |
| 56946 | EMSY | P52T-E | Human | Esophagus | ESCC | 1.33e-16 | 2.00e-01 | 0.1555 |
| 56946 | EMSY | P54T-E | Human | Esophagus | ESCC | 1.02e-14 | 1.33e-01 | 0.0975 |
| Page: 1 2 3 |
| Tissue | Expression Dynamics | Abbreviation |
| Breast |  | IDC: Invasive ductal carcinoma |
| DCIS: Ductal carcinoma in situ | ||
| Precancer(BRCA1-mut): Precancerous lesion from BRCA1 mutation carriers | ||
| Esophagus | 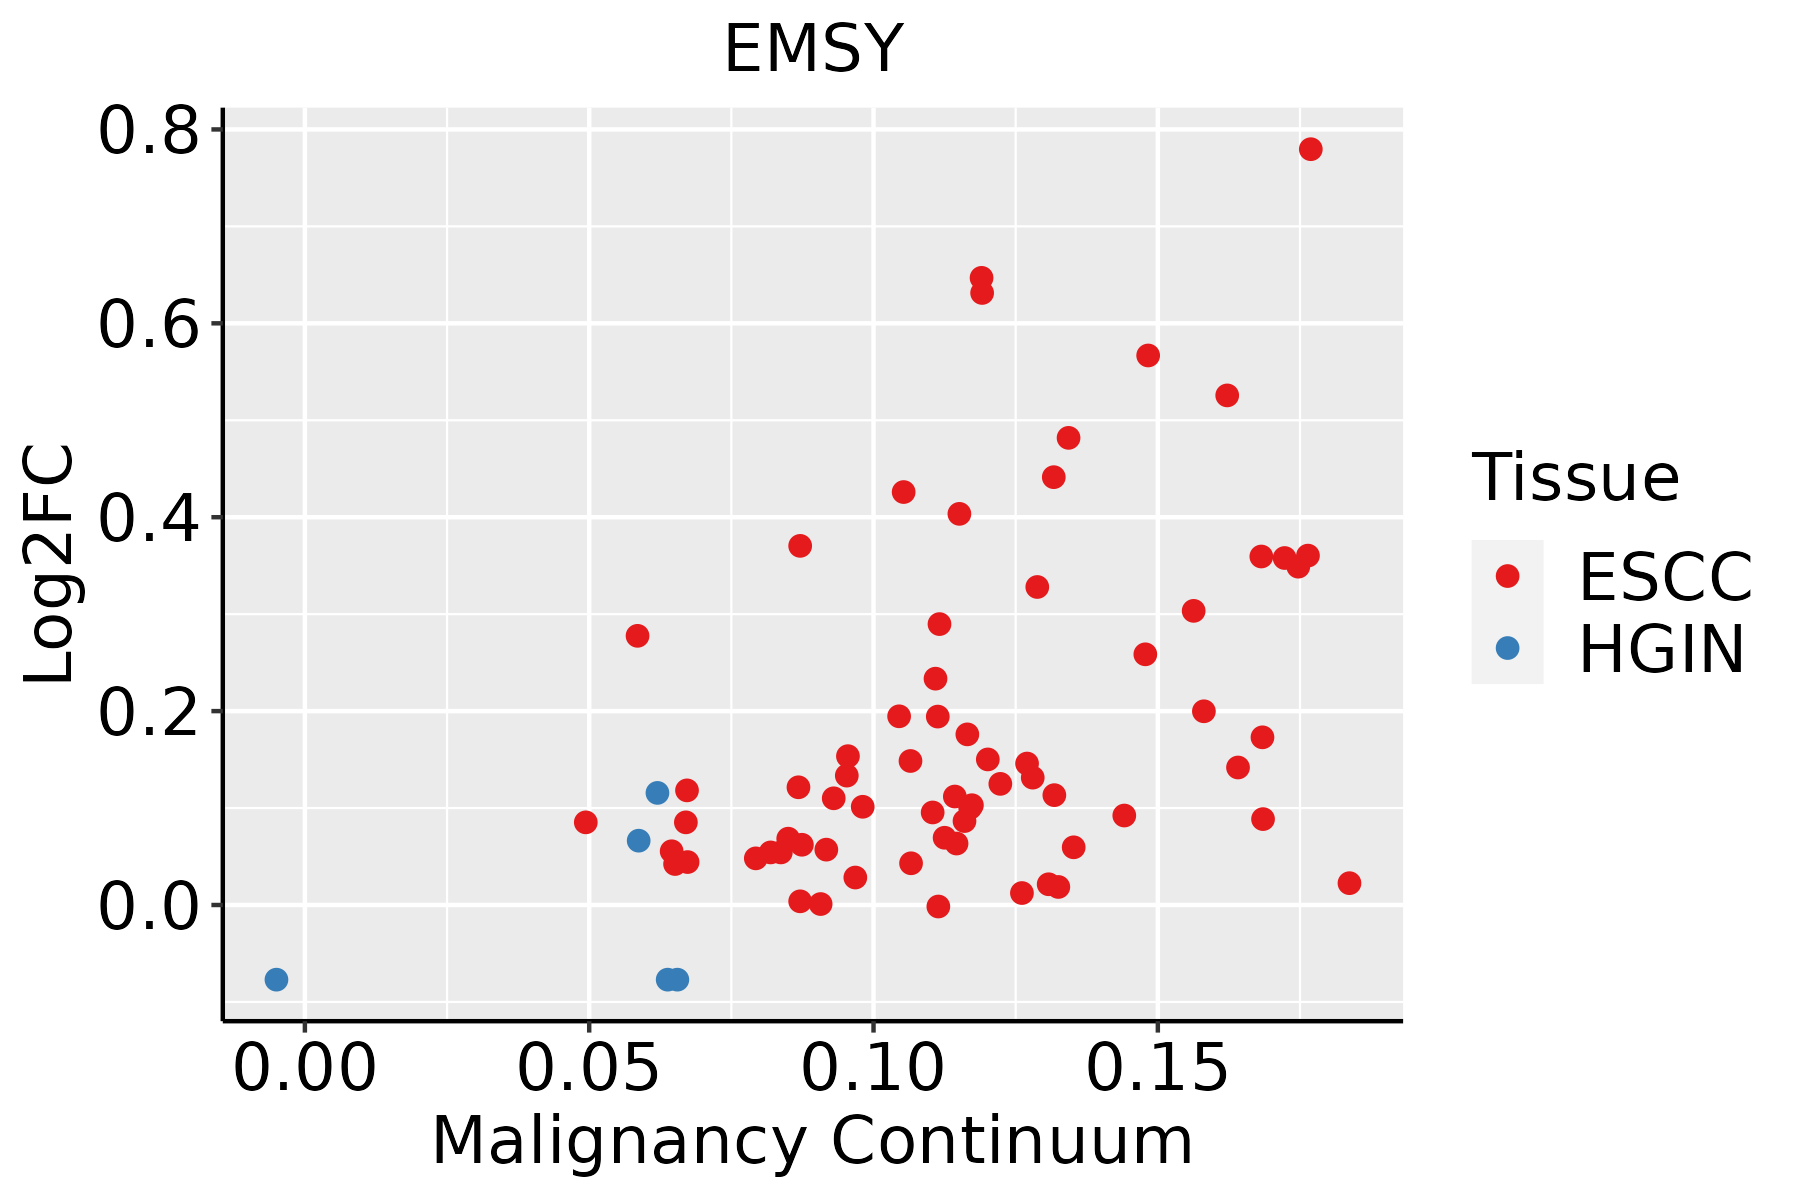 | ESCC: Esophageal squamous cell carcinoma |
| HGIN: High-grade intraepithelial neoplasias | ||
| LGIN: Low-grade intraepithelial neoplasias |
| ∗log2FC in expression of this searched gene in stem-like cells from each diseased tissue sample relative to stem-like cells in normal samples in each tissue plotted against the malignancy continuum. Samples are colored based on if they are from different disease stage. |
Top |
Malignant transformation related pathway analysis |
| Find out the enriched GO biological processes and KEGG pathways involved in transition from healthy to precancer to cancer |
| Tissue | Disease Stage | Enriched GO biological Processes |
| Colorectum | AD |  |
| Colorectum | SER |  |
| Colorectum | MSS |  |
| Colorectum | MSI-H |  |
| Colorectum | FAP |  |
| ∗Top 15 enriched GO BP terms are showed in the bar plot of each disease state in each tissue. Each row represents a significant GO biological process which is colored according to the -log10(p.adjust). |
| Page: 1 2 3 4 5 6 7 8 9 |
| GO ID | Tissue | Disease Stage | Description | Gene Ratio | Bg Ratio | pvalue | p.adjust | Count |
| GO:000632517 | Esophagus | ESCC | chromatin organization | 240/8552 | 409/18723 | 6.52e-08 | 1.14e-06 | 240 |
| Page: 1 |
| Pathway ID | Tissue | Disease Stage | Description | Gene Ratio | Bg Ratio | pvalue | p.adjust | qvalue | Count |
| Page: 1 |
Top |
Cell-cell communication analysis |
| Identification of potential cell-cell interactions between two cell types and their ligand-receptor pairs for different disease states |
| Ligand | Receptor | LRpair | Pathway | Tissue | Disease Stage |
| Page: 1 |
Top |
Single-cell gene regulatory network inference analysis |
| Find out the significant the regulons (TFs) and the target genes of each regulon across cell types for different disease states |
| TF | Cell Type | Tissue | Disease Stage | Target Gene | RSS | Regulon Activity |
| ∗The dot plots of a searched regulon are shown for all cell subpopulations in each disease state of each tissue based on the regulon specific score inferred using pySCENIC and by calculating the average expression. |
| Page: 1 |
Top |
Somatic mutation of malignant transformation related genes |
| Annotation of somatic variants for genes involved in malignant transformation |
| Hugo Symbol | Variant Class | Variant Classification | dbSNP RS | HGVSc | HGVSp | HGVSp Short | SWISSPROT | BIOTYPE | SIFT | PolyPhen | Tumor Sample Barcode | Tissue | Histology | Sex | Age | Stage | Therapy Types | Drugs | Outcome |
| EMSY | SNV | Missense_Mutation | c.3495G>C | p.Leu1165Phe | p.L1165F | Q7Z589 | protein_coding | deleterious_low_confidence(0.01) | probably_damaging(0.991) | TCGA-A1-A0SI-01 | Breast | breast invasive carcinoma | Female | <65 | I/II | Unknown | Unknown | SD | |
| EMSY | SNV | Missense_Mutation | c.2901N>C | p.Gln967His | p.Q967H | Q7Z589 | protein_coding | tolerated_low_confidence(0.06) | probably_damaging(0.948) | TCGA-A2-A0YK-01 | Breast | breast invasive carcinoma | Female | <65 | I/II | Chemotherapy | cytoxan | SD | |
| EMSY | SNV | Missense_Mutation | novel | c.2105T>C | p.Leu702Pro | p.L702P | Q7Z589 | protein_coding | deleterious_low_confidence(0) | probably_damaging(0.995) | TCGA-A2-A3XY-01 | Breast | breast invasive carcinoma | Female | <65 | I/II | Chemotherapy | adriamycin | PD |
| EMSY | SNV | Missense_Mutation | c.58N>G | p.Leu20Val | p.L20V | Q7Z589 | protein_coding | deleterious_low_confidence(0) | probably_damaging(0.945) | TCGA-A8-A09Z-01 | Breast | breast invasive carcinoma | Female | >=65 | I/II | Unknown | Unknown | SD | |
| EMSY | SNV | Missense_Mutation | c.1630G>A | p.Ala544Thr | p.A544T | Q7Z589 | protein_coding | tolerated(0.59) | benign(0.003) | TCGA-AC-A23H-01 | Breast | breast invasive carcinoma | Female | >=65 | I/II | Unknown | Unknown | PD | |
| EMSY | SNV | Missense_Mutation | c.3937N>G | p.Met1313Val | p.M1313V | Q7Z589 | protein_coding | tolerated_low_confidence(0.06) | benign(0) | TCGA-AN-A0AK-01 | Breast | breast invasive carcinoma | Female | >=65 | I/II | Unknown | Unknown | SD | |
| EMSY | SNV | Missense_Mutation | c.1173C>G | p.Ile391Met | p.I391M | Q7Z589 | protein_coding | deleterious(0.03) | benign(0.157) | TCGA-AN-A0FL-01 | Breast | breast invasive carcinoma | Female | <65 | I/II | Unknown | Unknown | SD | |
| EMSY | SNV | Missense_Mutation | c.1662C>G | p.Ile554Met | p.I554M | Q7Z589 | protein_coding | deleterious(0.01) | probably_damaging(0.979) | TCGA-AO-A0JE-01 | Breast | breast invasive carcinoma | Female | <65 | III/IV | Chemotherapy | doxorubicin | SD | |
| EMSY | SNV | Missense_Mutation | c.2143N>A | p.Glu715Lys | p.E715K | Q7Z589 | protein_coding | tolerated_low_confidence(0.21) | possibly_damaging(0.607) | TCGA-BH-A0BD-01 | Breast | breast invasive carcinoma | Female | <65 | I/II | Chemotherapy | doxorubicin | SD | |
| EMSY | SNV | Missense_Mutation | c.2712N>G | p.Ile904Met | p.I904M | Q7Z589 | protein_coding | deleterious_low_confidence(0.01) | probably_damaging(0.924) | TCGA-BH-A0BD-01 | Breast | breast invasive carcinoma | Female | <65 | I/II | Chemotherapy | doxorubicin | SD |
| Page: 1 2 3 4 5 6 7 8 9 10 11 12 13 |
Top |
Related drugs of malignant transformation related genes |
| Identification of chemicals and drugs interact with genes involved in malignant transfromation |
| (DGIdb 4.0) |
| Entrez ID | Symbol | Category | Interaction Types | Drug Claim Name | Drug Name | PMIDs |
| Page: 1 |

Copyright 2023-Present -The University of Texas Health Science Center at Houston |